



The 2017 Auto Bild winter tyre test started with fifty 225/50 R17 winter tyre patterns which Auto Bild tested for wet braking performance, and then dropped the worse twenty tyres from the test.
The next phase was testing the remaining thirty patterns for snow braking, which was then combined with the wet braking distances to allow the ten worst tyres to be dropped. This left twenty winter tyres which Auto Bild regarded as the best winter tyres on the market, and deemed worthy enough to take through to the full testing.
As ever with Auto Bild testing, they undertake all the usual dry, wet and snow testing, but also including important factors such as wear and cost per 1,000 km, which a lot of tests are unable to include.
The results as closer than ever, and you'd be hard pressed to classify any of the top 10 tyres as bad tyres, but three in particular rose to the top.
Dry
In the dry grip testing, no tyre got close the reference summer tyre. During the braking tests, the Pirelli was the closest, but with all twenty winter tyres separated by just 3 meters overall when braking from 100 km/h, the differences between the top ten were small.
Dry Braking
Dry braking in meters
Lower is better ↓| Position / Tyre | Result | Gap to best |
|---|---|---|
RefReference Summer |
37.9 m | -5.80 m |
| 43.7 m | Best | |
| 44.5 m | +0.80 m | |
| 44.5 m | +0.80 m | |
| 44.5 m | +0.80 m | |
| 44.6 m | +0.90 m | |
| 44.8 m | +1.10 m | |
| 44.9 m | +1.20 m | |
| 44.9 m | +1.20 m | |
| 45.1 m | +1.40 m | |
| 45.2 m | +1.50 m | |
| 45.4 m | +1.70 m | |
| 45.4 m | +1.70 m | |
| 45.5 m | +1.80 m | |
| 45.6 m | +1.90 m | |
| 45.6 m | +1.90 m | |
| 45.6 m | +1.90 m | |
| 45.7 m | +2.00 m | |
| 46 m | +2.30 m | |
| 46.3 m | +2.60 m | |
| 46.7 m | +3.00 m |
The difference between best and worst was 23.2% (8.8 m ≈ 2 Car Lengths).
The Continental winter tyre was a step above the rest during dry handling, however it was still a large margin behind the summer reference tyre in another closely contested category.
Dry Handling
Dry Handling Average Speed
Higher is better ↑| Position / Tyre | Result | Gap to best |
|---|---|---|
RefReference Summer |
113.2 km/h | +2.40 km/h |
| 110.8 km/h | Best | |
| 109.7 km/h | -1.10 km/h | |
| 109.6 km/h | -1.20 km/h | |
| 109.6 km/h | -1.20 km/h | |
| 109.5 km/h | -1.30 km/h | |
| 109.4 km/h | -1.40 km/h | |
| 109.3 km/h | -1.50 km/h | |
| 109.1 km/h | -1.70 km/h | |
| 109.1 km/h | -1.70 km/h | |
| 109 km/h | -1.80 km/h | |
| 108.9 km/h | -1.90 km/h | |
| 108.8 km/h | -2.00 km/h | |
| 108.7 km/h | -2.10 km/h | |
| 108.6 km/h | -2.20 km/h | |
| 108.5 km/h | -2.30 km/h | |
| 108.3 km/h | -2.50 km/h | |
| 108.3 km/h | -2.50 km/h | |
| 107.3 km/h | -3.50 km/h | |
| 107.3 km/h | -3.50 km/h | |
| 107 km/h | -3.80 km/h |
The difference between best and worst was 5.5% (6.2 Km/H).
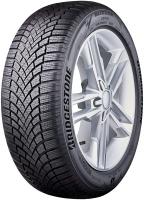
Winter tyres often have a bad reputation for being noisy, but every winter tyre managed to best the summer reference on test, with the Bridgestone winter tyre quietest by some margin.
All tests are the combined results of drive by noise readings at both 50 km/h and 80 km/h.
Noise
External noise in dB
Lower is better ↓| Position / Tyre | Result | Gap to best |
|---|---|---|
| 70.9 dB | Best | |
| 71.8 dB | +0.90 dB | |
| 71.9 dB | +1.00 dB | |
| 71.9 dB | +1.00 dB | |
| 72.2 dB | +1.30 dB | |
| 72.2 dB | +1.30 dB | |
| 72.2 dB | +1.30 dB | |
| 72.4 dB | +1.50 dB | |
| 72.7 dB | +1.80 dB | |
| 72.8 dB | +1.90 dB | |
| 72.8 dB | +1.90 dB | |
| 73 dB | +2.10 dB | |
| 73 dB | +2.10 dB | |
| 73.1 dB | +2.20 dB | |
| 73.5 dB | +2.60 dB | |
| 73.5 dB | +2.60 dB | |
| 73.5 dB | +2.60 dB | |
| 73.7 dB | +2.80 dB | |
| 73.9 dB | +3.00 dB | |
| 74 dB | +3.10 dB | |
RefReference Summer |
75.3 dB | +4.40 dB |
The difference between best and worst was 6.2% (4.4 dB).
Wet
The shallow water wet testing results were a little more spread out, but the summer tyre still dominated. Again, the Pirelli was closest in wet braking, but this time there was over 4 meters separating the winter tyres when braking from 80 km/h.
Wet Braking
Wet braking in meters
Lower is better ↓| Position / Tyre | Result | Gap to best |
|---|---|---|
RefReference Summer |
31 m | -1.20 m |
| 32.2 m | Best | |
| 32.5 m | +0.30 m | |
| 33.3 m | +1.10 m | |
| 33.4 m | +1.20 m | |
| 33.5 m | +1.30 m | |
| 33.6 m | +1.40 m | |
| 34 m | +1.80 m | |
| 34.4 m | +2.20 m | |
| 34.7 m | +2.50 m | |
| 34.8 m | +2.60 m | |
| 35 m | +2.80 m | |
| 35.1 m | +2.90 m | |
| 35.5 m | +3.30 m | |
| 35.7 m | +3.50 m | |
| 35.8 m | +3.60 m | |
| 35.9 m | +3.70 m | |
| 36 m | +3.80 m | |
| 36.3 m | +4.10 m | |
| 36.4 m | +4.20 m | |
| 36.5 m | +4.30 m |
The difference between best and worst was 17.7% (5.5 m ≈ 1.2 Car Lengths).
This time the Pirelli matched its wet braking peformance and finished the best winter tyre during wet handling too.
Wet Handling
Wet Handling Average Speed
Higher is better ↑| Position / Tyre | Result | Gap to best |
|---|---|---|
RefReference Summer |
77.5 km/h | +1.70 km/h |
| 75.8 km/h | Best | |
| 74.9 km/h | -0.90 km/h | |
| 74.7 km/h | -1.10 km/h | |
| 74.6 km/h | -1.20 km/h | |
| 74.2 km/h | -1.60 km/h | |
| 74.1 km/h | -1.70 km/h | |
| 73.6 km/h | -2.20 km/h | |
| 73.6 km/h | -2.20 km/h | |
| 73.5 km/h | -2.30 km/h | |
| 72.8 km/h | -3.00 km/h | |
| 72.6 km/h | -3.20 km/h | |
| 72.3 km/h | -3.50 km/h | |
| 72.2 km/h | -3.60 km/h | |
| 72.1 km/h | -3.70 km/h | |
| 71.9 km/h | -3.90 km/h | |
| 71.3 km/h | -4.50 km/h | |
| 71.3 km/h | -4.50 km/h | |
| 71.2 km/h | -4.60 km/h | |
| 71.1 km/h | -4.70 km/h | |
| 70.6 km/h | -5.20 km/h |
The difference between best and worst was 8.9% (6.9 Km/H).
The summer tyre could only manage fourth place overall in the deep water aquaplaning tests, with the Michelin owned BF Goodrich and Kleber taking the top two places.
Straight Aqua
Float Speed in Km/H
Higher is better ↑| Position / Tyre | Result | Gap to best |
|---|---|---|
| 93.3 km/h | Best | |
| 90.9 km/h | -2.40 km/h | |
| 90.7 km/h | -2.60 km/h | |
RefReference Summer |
90.5 km/h | -2.80 km/h |
| 90.5 km/h | -2.80 km/h | |
| 88.9 km/h | -4.40 km/h | |
| 88.7 km/h | -4.60 km/h | |
| 88.3 km/h | -5.00 km/h | |
| 88.1 km/h | -5.20 km/h | |
| 87.8 km/h | -5.50 km/h | |
| 87.5 km/h | -5.80 km/h | |
| 87.5 km/h | -5.80 km/h | |
| 87.5 km/h | -5.80 km/h | |
| 86.8 km/h | -6.50 km/h | |
| 86.5 km/h | -6.80 km/h | |
| 86.1 km/h | -7.20 km/h | |
| 85.5 km/h | -7.80 km/h | |
| 85.4 km/h | -7.90 km/h | |
| 85 km/h | -8.30 km/h | |
| 84.8 km/h | -8.50 km/h | |
| 84.6 km/h | -8.70 km/h |
The difference between best and worst was 9.3% (8.7 Km/H).

Snow
BF Goodrich and Kleber continued their success during the aquaplaning tests to stop the quickest when braking from 50 km/h on snow.
Snow Braking
Snow braking in meters
Lower is better ↓| Position / Tyre | Result | Gap to best |
|---|---|---|
| 25.9 m | Best | |
| 26.7 m | +0.80 m | |
| 27.2 m | +1.30 m | |
| 27.4 m | +1.50 m | |
| 27.5 m | +1.60 m | |
| 27.6 m | +1.70 m | |
| 27.6 m | +1.70 m | |
| 27.7 m | +1.80 m | |
| 27.7 m | +1.80 m | |
| 27.9 m | +2.00 m | |
| 28 m | +2.10 m | |
| 28.1 m | +2.20 m | |
| 28.1 m | +2.20 m | |
| 28.3 m | +2.40 m | |
| 28.3 m | +2.40 m | |
| 28.6 m | +2.70 m | |
| 28.7 m | +2.80 m | |
| 28.7 m | +2.80 m | |
| 29.2 m | +3.30 m | |
| 29.8 m | +3.90 m | |
RefReference Summer |
60.7 m | +34.80 m |
The difference between best and worst was 134.4% (34.8 m ≈ 7.7 Car Lengths).
Barum took a surprise win during snow handling, with BF Goodrich a close second place. The reference summer tyre couldn't even manage a lap of the snow handling course.
Snow Handling
Snow handling average speed
Higher is better ↑| Position / Tyre | Result | Gap to best |
|---|---|---|
| 52.6 km/h | Best | |
| 52.3 km/h | -0.30 km/h | |
| 52.2 km/h | -0.40 km/h | |
| 52.2 km/h | -0.40 km/h | |
| 52 km/h | -0.60 km/h | |
| 51.9 km/h | -0.70 km/h | |
| 51.7 km/h | -0.90 km/h | |
| 51.6 km/h | -1.00 km/h | |
| 51.4 km/h | -1.20 km/h | |
| 51.2 km/h | -1.40 km/h | |
| 51.1 km/h | -1.50 km/h | |
| 50.9 km/h | -1.70 km/h | |
| 50.9 km/h | -1.70 km/h | |
| 50.9 km/h | -1.70 km/h | |
| 50.7 km/h | -1.90 km/h | |
| 50.6 km/h | -2.00 km/h | |
| 50.4 km/h | -2.20 km/h | |
| 50.2 km/h | -2.40 km/h | |
| 50 km/h | -2.60 km/h | |
| 49.7 km/h | -2.90 km/h |
The difference between best and worst was 5.5% (2.9 Km/H).
Cost
Difference between value and wear is an important distinction. Wear simply shows the projected mileage of the tyre, based on Auto Bild's testing. Value looks at the projected mileage divided by the price Auto Bild paid for the set, giving you a "euro per 1,000 km" figure. While Michelin offered the best value of the premium tyres on test, Nexen scored best in value thanks to excellent wear and a low purchase price.
Value
Euros/1000km based on cost/wear
Lower is better ↓| Position / Tyre | Result | Gap to best | cost per 1,000 km |
|---|---|---|---|
| 7.55 Price/1000 | Best | €16.32 | |
| 7.57 Price/1000 | +0.02 Price/1000 | €11.87 | |
| 9.13 Price/1000 | +1.58 Price/1000 | €13.76 | |
| 9.2 Price/1000 | +1.65 Price/1000 | €13.86 | |
| 9.33 Price/1000 | +1.78 Price/1000 | €12.80 | |
| 9.87 Price/1000 | +2.32 Price/1000 | €14.27 | |
| 11.47 Price/1000 | +3.92 Price/1000 | €13.82 | |
| 11.55 Price/1000 | +4.00 Price/1000 | €17.94 | |
| 12.3 Price/1000 | +4.75 Price/1000 | €18.02 | |
| 12.43 Price/1000 | +4.88 Price/1000 | €19.29 | |
| 12.47 Price/1000 | +4.92 Price/1000 | €18.60 | |
| 12.62 Price/1000 | +5.07 Price/1000 | €20.28 | |
| 12.71 Price/1000 | +5.16 Price/1000 | €18.54 | |
| 12.72 Price/1000 | +5.17 Price/1000 | €20.33 | |
| 13.78 Price/1000 | +6.23 Price/1000 | €18.78 | |
| 15.04 Price/1000 | +7.49 Price/1000 | €20.48 | |
| 15.94 Price/1000 | +8.39 Price/1000 | €21.17 | |
| 16.1 Price/1000 | +8.55 Price/1000 | €22.50 | |
| 16.59 Price/1000 | +9.04 Price/1000 | €22.29 | |
| 16.88 Price/1000 | +9.33 Price/1000 | €23.52 |
The difference between best and worst was 123.6% (9.33 Price/1000). Over 40,000 km the cheapest tyre to own (Sava Eskimo HP2) works out €466 cheaper than the most expensive (Pirelli Winter Sottozero 3).
How this is calculated
Assumes a typical car using 8 l/100km (with rolling resistance causing 20% of fuel use), fuel at €1.65 per litre and €70 fitting per set of four. Purchase prices are from the time of the 2017 test; financing costs are excluded.
Wear
Predicted tread life in KM
Higher is better ↑| Position / Tyre | Result | Gap to best |
|---|---|---|
| 48,375 KM | Best | |
| 47,625 KM | -750 KM | |
| 44,250 KM | -4,125 KM | |
| 44,250 KM | -4,125 KM | |
| 42,375 KM | -6,000 KM | |
| 40,125 KM | -8,250 KM | |
| 38,625 KM | -9,750 KM | |
| 37,500 KM | -10,875 KM | |
| 37,500 KM | -10,875 KM | |
| 37,500 KM | -10,875 KM | |
| 36,375 KM | -12,000 KM | |
| 35,250 KM | -13,125 KM | |
| 34,875 KM | -13,500 KM | |
| 34,875 KM | -13,500 KM | |
| 34,500 KM | -13,875 KM | |
| 33,375 KM | -15,000 KM | |
| 32,625 KM | -15,750 KM | |
| 32,250 KM | -16,125 KM | |
| 29,625 KM | -18,750 KM | |
| 28,875 KM | -19,500 KM |
The difference between best and worst was 40.3% (19,500 KM).
While none of the winter tyres could beat the summer tyre during the rolling resistance testing, a number of tyres were close. Ironically, the best value tyre on test had the worst rolling resistance, which will offset some of the savings made over the tyres tread life.
Rolling Resistance
Rolling resistance in kg t
Lower is better ↓| Position / Tyre | Result | Gap to best | Extra fuel / year |
|---|---|---|---|
RefReference Summer |
7.1 kg/t | -0.13 kg/t | £0 |
| 7.23 kg/t | Best | £0 | |
| 7.53 kg/t | +0.30 kg/t | £18 | |
| 7.78 kg/t | +0.55 kg/t | £34 | |
| 7.83 kg/t | +0.60 kg/t | £37 | |
| 7.88 kg/t | +0.65 kg/t | £40 | |
| 7.91 kg/t | +0.68 kg/t | £41 | |
| 7.95 kg/t | +0.72 kg/t | £44 | |
| 7.96 kg/t | +0.73 kg/t | £45 | |
| 8.03 kg/t | +0.80 kg/t | £49 | |
| 8.05 kg/t | +0.82 kg/t | £50 | |
| 8.15 kg/t | +0.92 kg/t | £56 | |
| 8.17 kg/t | +0.94 kg/t | £57 | |
| 8.2 kg/t | +0.97 kg/t | £59 | |
| 8.21 kg/t | +0.98 kg/t | £60 | |
| 8.25 kg/t | +1.02 kg/t | £62 | |
| 8.3 kg/t | +1.07 kg/t | £65 | |
| 8.52 kg/t | +1.29 kg/t | £79 | |
| 8.57 kg/t | +1.34 kg/t | £82 | |
| 8.62 kg/t | +1.39 kg/t | £85 | |
| 9.07 kg/t | +1.84 kg/t | £112 |
The difference between best and worst was 27.7% (1.97 kg / t). Over 19,000 km a year at £1.45/L, the Nexen WinGuard Sport 2 uses about 77 L (£112) more fuel than the Uniroyal MS Plus 77.
Adjust the assumptions
Calculated estimates, not additional measurements. Use the controls to explore the assumptions.
Results
The full results are below, and have Auto Bild's usual confusing weighting attached to each of the criteria. For more information, be sure to check out the Auto Bild website (German).
Continental WinterContact TS 860
225/50 R17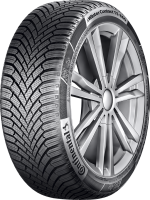
All discipline results (8)
| Test | Result |
|---|---|
| Dry | 7 |
| Wet | 7 |
| Snow | 7 |
| Comfort | 6 |
| Rolling Resistance | 6 |
| Noise | 6 |
| Wear | 5 |
| Cost | 4 |
Total: 48
Michelin Alpin 5
225/50 R17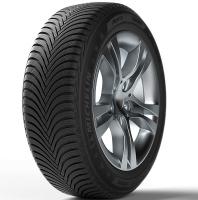
All discipline results (8)
| Test | Result |
|---|---|
| Dry | 6 |
| Wet | 7 |
| Snow | 6 |
| Comfort | 7 |
| Rolling Resistance | 4 |
| Noise | 7 |
| Wear | 8 |
| Cost | 6 |
Total: 51
Dunlop Winter Sport 5
225/50 R17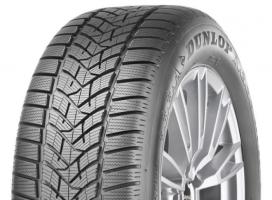
All discipline results (8)
| Test | Result |
|---|---|
| Dry | 6 |
| Wet | 7 |
| Snow | 6 |
| Comfort | 6 |
| Rolling Resistance | 6 |
| Noise | 6 |
| Wear | 5 |
| Cost | 5 |
Total: 47
Goodyear UltraGrip Performance Gen 1
225/50 R17
All discipline results (8)
| Test | Result |
|---|---|
| Dry | 6 |
| Wet | 7 |
| Snow | 7 |
| Comfort | 6 |
| Rolling Resistance | 6 |
| Noise | 7 |
| Wear | 4 |
| Cost | 3 |
Total: 46
Semperit Speed Grip 3
225/50 R17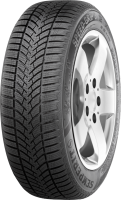
All discipline results (8)
| Test | Result |
|---|---|
| Dry | 6 |
| Wet | 6 |
| Snow | 7 |
| Comfort | 7 |
| Rolling Resistance | 6 |
| Noise | 7 |
| Wear | 4 |
| Cost | 5 |
Total: 48
BFGoodrich gForce Winter 2
225/50 R17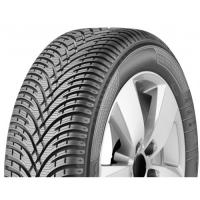
All discipline results (8)
| Test | Result |
|---|---|
| Dry | 5 |
| Wet | 6 |
| Snow | 9 |
| Comfort | 7 |
| Rolling Resistance | 6 |
| Noise | 8 |
| Wear | 6 |
| Cost | 6 |
Total: 53
Fulda Kristall Control HP2
225/50 R17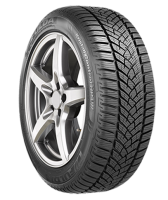
All discipline results (8)
| Test | Result |
|---|---|
| Dry | 6 |
| Wet | 6 |
| Snow | 7 |
| Comfort | 6 |
| Rolling Resistance | 6 |
| Noise | 5 |
| Wear | 9 |
| Cost | 8 |
Total: 53
Bridgestone Blizzak LM001 EVO
225/50 R17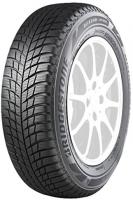
All discipline results (8)
| Test | Result |
|---|---|
| Dry | 5 |
| Wet | 8 |
| Snow | 6 |
| Comfort | 4 |
| Rolling Resistance | 6 |
| Noise | 9 |
| Wear | 7 |
| Cost | 6 |
Total: 51
Kleber Krisalp HP3
225/50 R17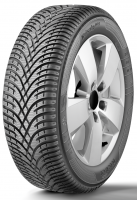
All discipline results (8)
| Test | Result |
|---|---|
| Dry | 5 |
| Wet | 6 |
| Snow | 8 |
| Comfort | 6 |
| Rolling Resistance | 5 |
| Noise | 8 |
| Wear | 6 |
| Cost | 7 |
Total: 51
Nexen WinGuard Sport 2
225/50 R17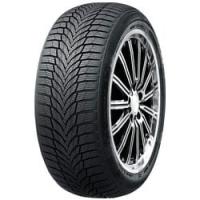
All discipline results (8)
| Test | Result |
|---|---|
| Dry | 6 |
| Wet | 5 |
| Snow | 6 |
| Comfort | 5 |
| Rolling Resistance | 3 |
| Noise | 8 |
| Wear | 9 |
| Cost | 9 |
Total: 51
Gislaved EuroFrost 5
225/50 R17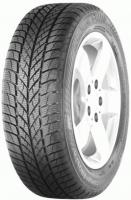
All discipline results (8)
| Test | Result |
|---|---|
| Dry | 6 |
| Wet | 5 |
| Snow | 6 |
| Comfort | 5 |
| Rolling Resistance | 6 |
| Noise | 5 |
| Wear | 6 |
| Cost | 8 |
Total: 47
Kumho WinterCraft WP71
225/50 R17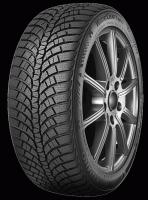
All discipline results (8)
| Test | Result |
|---|---|
| Dry | 5 |
| Wet | 5 |
| Snow | 6 |
| Comfort | 4 |
| Rolling Resistance | 6 |
| Noise | 7 |
| Wear | 7 |
| Cost | 8 |
Total: 48
Uniroyal MS+ 77
225/50 R17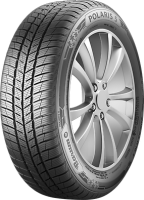
All discipline results (8)
| Test | Result |
|---|---|
| Dry | 5 |
| Wet | 5 |
| Snow | 6 |
| Comfort | 6 |
| Rolling Resistance | 8 |
| Noise | 6 |
| Wear | 6 |
| Cost | 7 |
Total: 49
Nokian WR D4
225/50 R17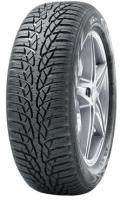
All discipline results (8)
| Test | Result |
|---|---|
| Dry | 5 |
| Wet | 6 |
| Snow | 6 |
| Comfort | 5 |
| Rolling Resistance | 6 |
| Noise | 7 |
| Wear | 3 |
| Cost | 4 |
Total: 42
Yokohama W drive V905
225/50 R17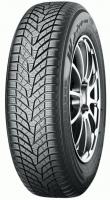
All discipline results (8)
| Test | Result |
|---|---|
| Dry | 5 |
| Wet | 5 |
| Snow | 6 |
| Comfort | 4 |
| Rolling Resistance | 4 |
| Noise | 6 |
| Wear | 4 |
| Cost | 6 |
Total: 40
Barum Polaris 3
225/50 R17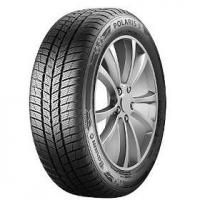
All discipline results (8)
| Test | Result |
|---|---|
| Dry | 6 |
| Wet | 4 |
| Snow | 8 |
| Comfort | 5 |
| Rolling Resistance | 7 |
| Noise | 6 |
| Wear | 6 |
| Cost | 8 |
Total: 50
Sava Eskimo HP2
225/50 R17
All discipline results (8)
| Test | Result |
|---|---|
| Dry | 5 |
| Wet | 4 |
| Snow | 6 |
| Comfort | 3 |
| Rolling Resistance | 6 |
| Noise | 6 |
| Wear | 8 |
| Cost | 9 |
Total: 47
Pirelli Winter Sottozero 3
225/50 R17
All discipline results (8)
| Test | Result |
|---|---|
| Dry | 6 |
| Wet | 8 |
| Snow | 4 |
| Comfort | 4 |
| Rolling Resistance | 5 |
| Noise | 6 |
| Wear | 3 |
| Cost | 3 |
Total: 39
Firestone Winterhawk 3
225/50 R17
All discipline results (8)
| Test | Result |
|---|---|
| Dry | 6 |
| Wet | 4 |
| Snow | 6 |
| Comfort | 5 |
| Rolling Resistance | 4 |
| Noise | 7 |
| Wear | 5 |
| Cost | 6 |
Total: 43
Hankook Winter i cept evo2
225/50 R17
All discipline results (8)
| Test | Result |
|---|---|
| Dry | 6 |
| Wet | 5 |
| Snow | 4 |
| Comfort | 3 |
| Rolling Resistance | 6 |
| Noise | 6 |
| Wear | 5 |
| Cost | 6 |
Total: 41
If you ditch the handling tests because the difference in speed is close to irrelevant, you can see that there is no way that Continental can be the best, mainly because high price and poor wear. Be sure on what surface you drive the most, it may be snowing but if the road is clear it is wet surface etc. I would suggest that you redo the results of the tes without the speed tests because they don't matter, safety comes first on winter tyres !
But the speed measurement is a direct metric on how safe the tyre is. For example the higher the aquaplaning speed is the safer it is to drive in a wet condition if the speed is below that measurement.
Hi Jonathan, I cannot understand the meaning of Dry and Wet Braking for Reference Summer. Shouldn't it be the other way around? Shouldn't summer tires stop after winter tires during the bad season? Thanks for the clarification.
Do you mean in the dry and wet? A good summer tyre will always beat a winter tyre in the dry, and the wet braking can be very close between the best summer and winter tyres.
The summer tyre behaves as you would expect in the snow!
So what is the utility of winter tires if the summer ones stop first in the wet???
I am talking about my climate, very rainy but almost never snowy in Fall/Winter...
The winter tyre works in lower / freezing temperatures, and obviously works on snow and ice. But I agree, a winter tyre isn't always the best choice.
https://www.youtube.com/wat...
Anyway, one morning of the last week my Goodyear Ultragrip Performance Gen-1 saved me from a crash. It was cold and it was raining, so they did their job very well...
Unable to find Nokian WRD4 on their website. Is this an old model ?
Also cannot find anywhere in this test a statement as to whether any of these tires are studded or non-studded.
Best current studded tire I know of is Nokian Hakkapeliitta 9
The Nokian WRD4 is a European winter, which are studless by default. It's their current leading central european product:
https://www.nokiantyres.com...
The Bridgestone Blizzak LM 001 has class C for wet braking
How is possible in your test to be no 3 before Continental, Michelin, etc, which has B class?
Thank you for your answer
As with the Nokian question below, it might be this test used an newer version of the tyre with better label scores, or that the Bridgestone tyre is more sensitive to this braking test scenario - things such as temperature, vehicle used and Mu of the road surface all make a difference.
Thank you for answer.
May you recommend me a tire model for a weather more wet than snow ?
Also ice from time to time.
Thank you
The winner of this test would be a good place to start your research :)
If you look at the EU label, Nokian has A grade wet braking performance; however, in this test, it sits behind the tyres who has B grade wet braking performance in EU label.
How is this possible? Which one is wrong: EU label or the test :)
Another question: 205/55 R17 95V Goodyear winter tire tyre has C grade wet braking performace in its EU label, while same tyre has B grade performance in 215/55 R17 98V. Is it normal to have that difference? To be honest, I would expact better performance in 205 than 215, since width is smaller (only in wet and snow, in dry roads it's vice versa)
It's normal to have a difference between sizes in the brands, you can even sometimes find the same tyre / size on sale with different label scores if a more recent manufacturer date has had a compound update to improve the label score.
As for the Nokian being an A, there's no way a company like Nokian would lie on the EU label test. It might be this test used an older version of the tyre with worse label scores, or that the Nokian tyre was more sensitive to this braking test scenario - things such as temperature, vehicle used and Mu of the road surface all make a difference.
So basically the almost last tire in this test(am looking at you Pirelli),is actually the best "winter" tire for our mild(less snowy) winters?
It certainly wouldn't be that low in a UK based test, though if you're more concerned about dry and wet performance (which is good for the UK) I'd suggest something like the Michelin CrossClimate.
Good suggestion,but in my size(205/50 r17) they are prohibitively expensive.
And the all-season test only confirm that there isn't much else to choose from.So I guess my old(2010) wintersport 3d will have to hold on for a one more winter trough.