

Understand & maintain
Are Cheap Tyres Worth It?
Compare published test evidence across tyre brand price tiers.
Use this tool

- tests analysed
- 208
- tyre entries
- 2,998
- Updated
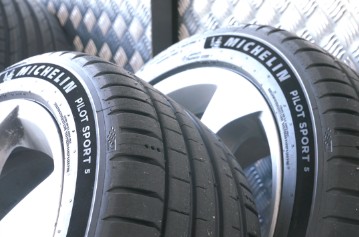 We analysed 208 independent tyre tests covering 2,998 individual results to answer one of the most common questions drivers ask: are cheap tyres worth the saving? Every test in our dataset compares Premium, Mid-Range, Economy and Budget tyres under identical conditions: same car, same day, same track.
Premium tyres win 91% of all tests and finish in the top three 84% of the time. Across 41 head-to-head wet braking comparisons, budget tyres needed an average of 6.7m more to stop.
Below are the figures for braking, handling, aquaplaning, fuel efficiency, comfort and owner ratings.
Wet Braking by Speed
Move the speed slider to see the average measured wet braking gap scaled to different speeds.
Emergency stop on a wet road.
Model assumption: braking distance scales with speed squared, while preserving the measured Premium vs Budget ratio.
When premium tyres have already stopped, budget tyres are still carrying:
Budget tyres are still moving at 30.3 km/h (18.8 mph).
At 80 km/h in the wet, premium tyres stop in about 40.1m while budget tyres need 46.8m. That is roughly 6.7m (1.5 car lengths) of extra travel.
Derived from 41 head-to-head Premium vs Budget wet-braking comparisons in this dataset.
How Do Cheap Tyres Rank in Tests?
Premium tyres average position 4.3 and win 90.9% of all tests. Budget tyres average position 30.4, accounting for just 0% of test wins. Mid-range tyres sit at position 11.3 with 14.4% of all top-3 finishes.
In this dataset, Premium is 4.3 versus Budget at 30.4, a 26.1 advantage for Premium.
In this dataset, Premium is 90.9% versus Budget at 0.0%, a 90.9 percentage points advantage for Premium.
In this dataset, Premium is 84.3% versus Budget at 0.1%, a 84.2 percentage points advantage for Premium.
Safety
Across 41 direct comparisons, budget tyres needed 6.7m more to stop in the wet, roughly 1.5 car lengths at motorway speed. In wet handling, premium tyres score 54 percentile points higher on average.
In 41 head-to-head tests, premium tyres stopped in an average of 40.1m while budget tyres needed 46.8m, a difference of 6.7m.
Braking distance is measured from a set speed until the car stops completely. In the wet, the compound, tread pattern and siping all affect how well water is cleared, so results vary far more than in the dry. In this dataset, premium tyres average 40.1m in wet braking versus 46.8m for budget, a 6.7m difference.
Dry braking distances are usually closer across price tiers because total available grip is higher on dry tarmac. Even so, small gaps still matter in emergency stops. Here, premium averages 41.9m and budget 42.0m in dry braking, a 0.1m difference. As expected, the dry gap (0.1m) is tighter than the wet gap (6.7m).
Wet handling measures how predictable and controllable a tyre is through corners on a wet track. Higher-scoring tyres give the driver more warning before losing grip, making emergency manoeuvres safer. This is one of the categories where premium compounds show the largest advantage. In this dataset, Premium is 72.1/100 versus Budget at 18.1/100, a 54.0 points advantage for Premium.
Aquaplaning occurs when a layer of water builds up between the tyre and road surface, causing total loss of grip. The speed shown is the point at which the tyre begins to aquaplane - higher is safer. Good tread design channels water away faster, keeping rubber in contact with tarmac at higher speeds. In this dataset, Premium is 78.3 km/h versus Budget at 72.3 km/h, a 6.0 km/h advantage for Premium.
Curved aquaplaning tests how much lateral grip a tyre keeps while cornering through standing water, as when water lies across a bend. In this dataset, premium scores 67.4/100 versus 11.9/100 for budget, a 55.5-point advantage.
Winter Performance: Snow & Ice Grip
Compound flexibility, siping density and tread design all affect grip on snow and ice, and budget tyres typically use harder compounds that struggle below 7°C.
Snow and ice braking tests measure stopping distance on packed snow and ice surfaces. Budget tyres often use harder rubber compounds that lose flexibility below 7°C, resulting in significantly longer stopping distances when temperatures drop. In this dataset, Premium is 24.4m versus Budget at 24.2m, a 0.2m advantage for Budget.
Ice braking is one of the harshest safety tests because available grip is extremely low, so differences in compound and tread bite show up quickly. In this dataset, Premium (19.6m) and Budget (19.6m) are effectively tied.
Snow handling tests measure how controllable and predictable a tyre is on snow-covered roads. Professional drivers assess lateral grip, steering response, and stability through corners. Premium tyres typically use softer winter compounds with more siping, giving them a significant advantage in these conditions. In this dataset, Premium is 69.9/100 versus Budget at 31.8/100, a 38.1 points advantage for Premium.
Snow traction measures a tyre’s ability to accelerate and maintain grip on packed snow. This is critical for hill starts, junctions, and overtaking on winter roads. Tyres with deeper sipes and softer rubber compounds disperse snow more effectively, maintaining contact with the road surface. In this dataset, Premium is 70.2/100 versus Budget at 38.3/100, a 31.9 points advantage for Premium.
Ice handling measures how stable and predictable the tyre feels when steering and cornering on frozen surfaces. In this dataset, Premium is 66.8/100 versus Budget at 28.3/100, a 38.5 points advantage for Premium.
Ice traction captures straight-line grip when accelerating on ice, where compound flexibility and siping design are critical. In this dataset, Premium is 71.1/100 versus Budget at 54.2/100, a 16.9 points advantage for Premium.
Winter and all-season tyres use silica-rich compounds that stay flexible in cold temperatures, while summer and budget tyres often harden below 7°C. This loss of flexibility directly reduces grip on snow and ice. The scores shown are normalised percentiles - each tyre is scored within its own test, then averaged across all tests, accounting for the different measurement units used by different test organisations.
Do Cheap Tyres Cost More Long-Term?
Premium tyres score 13 points higher for rolling resistance, which translates to lower fuel consumption over the life of the tyre. Premium tyres also tend to last longer, scoring 59 vs 37 on wear performance.
Tyre wear tests measure how many kilometres a tyre lasts under standardised conditions. Premium tyres average 44,440 km before replacement compared to 41,522 km for budget, a difference of 2,918 km. Once cost per kilometre is factored in, a premium tyre that lasts much longer can work out cheaper. In this dataset, Premium is 44,440 km versus Budget at 41,522 km, a 2,918 km advantage for Premium.
The cost-per-1000km figure combines purchase price with wear test data to show what each kilometre actually costs, so a more expensive tyre that lasts twice as long can be the cheaper one to run. In this dataset, Premium is 11.50 €/1000km versus Budget at 5.50 €/1000km, a 6.00 €/1000km advantage for Budget.
In 1 of 7 tests, budget tyres were more expensive per kilometre than premium, because their lower purchase price couldn't offset much faster wear.
Environmental Impact
Tyre wear particles account for up to 28% of the microplastics entering waterways, and rolling resistance directly affects fuel consumption and CO₂ emissions.
Abrasion tests measure how much material a tyre sheds as it wears. Different test organisations use different units (g/1000km, mg/km/t, mm/1000km), so we show normalised percentile scores rather than raw values. Lower abrasion means fewer tyre-wear particles entering the environment. ADAC and AutoBild are among the test organisations that now routinely measure tyre particulate emissions. In this dataset, Premium is 66.4/100 versus Budget at 56.1/100, a 10.3 points advantage for Premium.
Rolling resistance directly affects fuel consumption and CO₂ emissions. A tyre at 8.1 kg/t uses measurably less fuel than one at 8.3 kg/t, and over 20,000 km the difference adds up to several tanks of fuel. In this dataset, Premium is 8.1 kg/t versus Budget at 8.3 kg/t, a 0.2 kg/t advantage for Premium.
Comfort & Noise
Road noise, ride comfort and vibration also differ between price tiers, and you notice them on every drive.
Pass-by noise is measured in decibels (dB) under standardised conditions. The differences here are small, 71.5 dB for premium vs 72 dB for budget, but the decibel scale is logarithmic, so even 1 dB is noticeable inside the cabin. The bigger comfort gap shows up in the subjective scores below. In this dataset, Premium is 71.5 dB versus Budget at 72.0 dB, a 0.5 dB advantage for Premium.
Subjective scores are awarded by professional test drivers who assess real-world ride quality - how the tyre absorbs bumps, filters vibrations, and how quiet it feels inside the car. In this dataset, Premium is 65.9/100 versus Budget at 29.4/100, a 36.5 points advantage for Premium.
Subjective noise ratings are judged by professional drivers and capture how intrusive the sound feels inside the cabin, including pitch and tone. A tyre with lower measured dB can still feel harsher if it has a high-frequency whine. Here, premium scores 52.5/100 vs budget at 50.0/100 on subjective noise, while measured pass-by noise is relatively close at 71.5 dB vs 72.0 dB.
Owner Ratings
Based on 4,271 owner reviews, premium tyres score 8.3/10 on the \"would buy again\" question vs budget tyres at 6.2/10. The biggest gap reported by drivers is in wet grip: premium owners rate it 8.6/10 compared to 6.3/10 for budget. Mid-range tyres score well across all categories, with owners rating them 8.2/10 for buy-again satisfaction from 1,654 reviews.
In this dataset, Premium is 8.3/10 versus Budget at 6.2/10, a 2.1 points advantage for Premium.
In owner reviews, Premium is 8.6/10 versus Budget at 6.3/10, a 2.3 points advantage for Premium.
In owner reviews, Premium is 8.4/10 versus Budget at 7.1/10, a 1.3 points advantage for Premium.
In owner reviews, Premium is 8.3/10 versus Budget at 6.9/10, a 1.4 points advantage for Premium.
In owner reviews, Premium is 8.2/10 versus Budget at 7.1/10, a 1.1 points advantage for Premium.
The Verdict
Premium tyres lead on safety, mid-range tyres offer the best overall value, and the cheapest budget tyres are a false economy for most drivers.
Safety
Premium tyres stop 6.7m shorter in the wet on average. Wet handling shows a similar pattern, with premium tyres scoring 54 percentile points higher. In winter tests the gap is wider still: budget compounds lose significant grip below 7°C.
The Bottom Line
Premium tyres take 90.9% of all test wins vs budget’s 0%. If safety is your priority, avoid the cheapest options. If you’re on a budget, mid-range tyres offer the best balance of safety and value. If you’re on a tight budget, look at mid-range tyres rather than the very cheapest options. This analysis is based on 208 independent tests covering 2,998 tyre results.
How We Analysed the Data
Show methodology details
This analysis is based on 208 independent tyre tests covering 2,998 individual tyre results. Every test included at least two different brand categories (Premium, Mid-Range, Economy, or Budget) to allow direct, fair comparisons under identical conditions.
Test Selection
We only include tests where tyres from multiple price categories were tested together on the same vehicle, on the same day, at the same facility. This eliminates variables like weather, road surface, and vehicle condition that would make cross-test comparisons unreliable.
How Scores Are Calculated
For each metric, we average the raw measured values across all tests for each brand category. For example, the wet braking figure shown is the mean stopping distance of all Premium tyres across every included test, compared to the mean for Budget tyres. The figures stay in real units (metres, km/h, kg/t and decibels) rather than abstract scores.
Brand Categories
Each tyre brand is classified as Premium, Mid-Range, Economy, or Budget based on the manufacturer’s market positioning and typical price point. These classifications are consistent across all tests and are assigned independently of test results.
Continuous Updates
This page is automatically regenerated whenever new test results are published. As more data is added, the averages become increasingly reliable. Seasonal filters allow you to view results specifically for summer, winter, or all-season tyres, since performance characteristics differ significantly between tyre types.
Frequently Asked Questions
Are cheap tyres safe?
Budget tyres are legal and meet minimum safety standards, but our data from 41 tests shows they consistently underperform premium tyres in safety tests. Budget tyres need an average of 6.7m more to stop in wet conditions. For urban driving at low speeds the difference may be acceptable, but at motorway speeds it matters much more.
Do premium tyres last longer?
Our data shows premium tyres generally score higher on wear tests, but the difference varies. Some mid-range and economy tyres offer competitive longevity. The real long-term cost depends on combining wear life with fuel efficiency, where premium tyres typically excel thanks to lower rolling resistance.
What is the best value tyre category?
Mid-range tyres offer the best overall value. They finish in the top 3 in 14.4% of tests, come close to premium safety performance and cost much less. Economy tyres can also be good value for lower-mileage drivers who do mostly urban driving.
How much difference do tyres really make?
Premium tyres win 90.9% of all tests, compared with 0% for budget tyres. In wet braking alone, the average gap is 6.7m.
Are mid-range tyres worth it?
For most drivers, yes. They deliver most of the safety performance of premium tyres at a lower price, and finish in the top 3 in 14.4% of tests. Unless you drive a high-performance car or do very high mileage, mid-range is usually the better buy.

Next step