

Vredestein Ultrac vs Goodride SA57

In the 2 independent tests that ran both tyres, the Vredestein Ultrac finished ahead 2 times and the SA57 not once. The Ultrac was stronger in dry, wet and value, the SA57 in comfort.
Performance profile
10 measurements from the 2 shared tests, each tyre shown as its share of the better figure in every test.
Where each is furthest ahead
Ultrac
SA57
Point at or tap any spoke for both tyres' figures.
In each test the better of the two figures counts as 100% and the other as its share of it, so a 36 m stop against 34.2 m is 95%; each spoke averages the shared tests that recorded it.
Where each scores higher
Ultrac
SA57
Point at or tap any spoke for both tyres' figures.
Category scores are percentiles among tyres of the same season and class: 90 means this tyre out-performs 90% of them, measured across every test we hold, not only the ones it appeared in.
Where owners rate each higher
Ultrac
SA57
Point at or tap any spoke for both tyres' figures.
Owners rate the Ultrac 78% from 24 reviews and the SA57 76% from 3. Each spoke is one question owners answer out of 10; reviews are vetted by hand before publication.

Every measurement, side by side
Averages of the figures both tyres posted in the same tests. The gap is the average of each test's own gap, so figures from different cars and years are never mixed. Wins count the tests in which each tyre did better.
| Measurement | Ultrac | Gap | SA57 | Wins |
|---|---|---|---|---|
| Dry Ultrac ahead | ||||
| Dry Braking m | 36.1 | 3.2% | 37.3 | 2-0 |
| Dry Handling km/h | 95 | 0.3% | 94.7 | 1-0 |
| Wet Ultrac ahead | ||||
| Wet Braking m | 36.1 | 10% | 40.1 | 2-0 |
| Wet Handling km/h | 74.3 | 3.1% | 72.1 | 1-0 |
| Wet Circle m/s | 6.43 | 7% | 6.01 | 1-0 |
| Straight Aqua km/h | 86.4 | 7.5% | 80.4 | 1-0 |
| Curved Aquaplaning m/sec2 | 4.59 | 7.2% | 4.28 | 1-0 |
| Comfort SA57 ahead | ||||
| Noise dB | 70.1 | 1.3 dB | 68.8 | 0-1 |
| Value Ultrac ahead | ||||
| Wear km | 27,200 | 1.3% | 26,860 | 1-0 |
| Rolling Resistance kg / t | 8.42 | 6.2% | 8.98 | 1-0 |
Braking distances and lap times are better when lower; speeds, wear and grip figures when higher. A test's figures are its own: sizes, cars, surfaces and temperatures differ from one to the next, which is why the averages here are only ever of tests the two tyres shared.
Head to head in 2 tests in 2022
Each row is one published test in which both tyres ran on the same car, in the same size, on the same day. The line is the whole field, winner on the left.
| Test | Ultrac | Field | SA57 |
|---|---|---|---|
| 2022 Auto Bild Summer Tyre Test | P14 of 21 | P18 of 21 | |
| 2022 Summer Tyre Market Overview | P3 of 50 | P20 of 50 |
Ultrac vs SA57: your questions
Is the Vredestein Ultrac or the Goodride SA57 the better tyre?
In the 2 independent tests that ran both tyres, the Vredestein Ultrac finished ahead 2 times and the SA57 not once. On the Tyre Reviews Score, which weighs every test and review we hold, the Ultrac scores 8.7 and the SA57 7.3 out of 10.
Which is better in the wet, the Ultrac or the SA57?
The Ultrac led 6 of the 6 wet measurements the shared tests recorded. On average it stopped 10% shorter in the wet across 2 tests.
Which is better in the dry?
The Ultrac led 3 of the 3 dry measurements the shared tests recorded. On average it stopped 3.2% shorter in the dry across 2 tests.
Which is quieter and more comfortable?
Owners rate comfort 8/10 for the Ultrac and 7.7/10 for the SA57.
What do owners say?
Owners rate the Ultrac 78% from 24 reviews and the SA57 76% from 3.
Are they available in the same sizes?
The Ultrac is made in 65 sizes (15 to 21 inch) and the SA57 in 2 (17 to 19 inch). 1 sizes are available in both. On the EU label the Ultrac is graded A for wet grip and C for rolling resistance in most sizes; the SA57 B and D.
More comparisons with these tyres
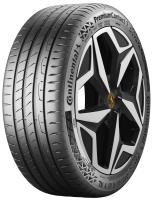 vs
 Continental PremiumContact 7 vs Vredestein Ultrac
10-1 in 11 shared tests
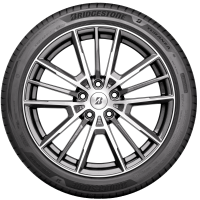 vs
Bridgestone Turanza 6 vs Vredestein Ultrac
3-4 in 7 shared tests
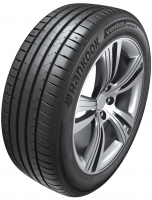 vs
Hankook Ventus Prime 4 vs Vredestein Ultrac
7-2 in 9 shared tests
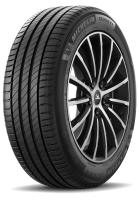 vs
Michelin Primacy 4+ vs Vredestein Ultrac
5-4 in 9 shared tests
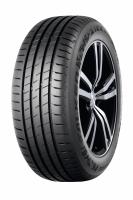 vs
Falken ZIEX ZE320 vs Vredestein Ultrac
0-1 in 2 shared tests
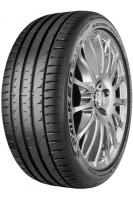 vs
Falken Azenis FK520 vs Vredestein Ultrac
0-1 in 2 shared tests
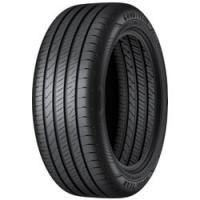 vs
Goodyear EfficientGrip Performance 2 vs Vredestein Ultrac
7-3 in 10 shared tests
 vs
Falken ZIEX ZE310 EcoRun vs Vredestein Ultrac
4-6 in 10 shared tests
Run either of these?
Your review is the part of this page no test can supply: how the tyre wore, how it aged, what it was like in the rain in year three. It takes about five minutes.
Where this data comes from
Finishing positions and measurements are transcribed from each published test. A test only counts here when both tyres ran in it, so every figure was recorded on the same car, size and day as the one it is compared to.
About the TR Score
The Tyre Reviews Score rates each tyre out of 10 from every independent test result and vetted owner review we hold, so two tyres can be compared even before a test has run them together.
Who does the testing
Every test published as a Tyre Reviews test is run by Jonathan Benson, who has been testing tyres independently since 2007.