



Test setup & methodology
The test setting, the conditions recorded and how the results contribute to the score.
Recorded test conditions
Recorded test conditions
- Dry Braking
- 80 → 5 km/h
- Wet Braking
- 80 → 5 km/h
- Snow Braking
- 40 → 5 km/h
- Snow Traction
- 5 → 40 km/h
- Ice Braking
- 30 → 5 km/h
- Ice Traction
- 5 → 30 km/h
If you spend some time analysing the data, you'll see the winner of the test actually might not be the best tyre for you. The test winning tyres are all the best tyres in the snow and ice, the trade off is dry and wet performance, so If you live in a "milder" extreme winter climate, think carefully about what you want from the tyre.
As always, tyres are a trade off, and extreme winter performance nearly always hurts how a tyre grips in the dry, so think about how you use the studded winter tyre before picking the right tyre for you.
Here's the data. Enjoy!
Dry
Dry Braking
Dry braking in meters (80 - 5 km/h)
Lower is better ↓| Position / Tyre | Result | Gap to best | Residual speed |
|---|---|---|---|
| 30.77 m | Best | 0 km/h | |
| 31.3 m | +0.53 m | 17 km/h | |
| 31.86 m | +1.09 m | 24 km/h | |
| 32.57 m | +1.80 m | 31 km/h | |
| 32.79 m | +2.02 m | 32 km/h | |
| 32.86 m | +2.09 m | 33 km/h | |
| 32.91 m | +2.14 m | 33 km/h | |
| 33.65 m | +2.88 m | 38 km/h |
The difference between best and worst was 9.4% (2.88 m ≈ 0.6 Car Lengths). From 130 km/h, the Continental IceContact 3 would still be travelling at 38 km/h when the BFGoodrich G Force Stud had stopped.
Residual speed is calculated from the measured braking distances, assuming constant deceleration; it is not a separate measurement.
Wet
Wet Braking
Wet braking in meters (80 - 5 km/h)
Lower is better ↓| Position / Tyre | Result | Gap to best | Residual speed |
|---|---|---|---|
| 35.86 m | Best | 0 km/h | |
| 36.31 m | +0.45 m | 14 km/h | |
| 36.77 m | +0.91 m | 20 km/h | |
| 37.1 m | +1.24 m | 24 km/h | |
| 37.21 m | +1.35 m | 25 km/h | |
| 37.76 m | +1.90 m | 29 km/h | |
| 38.54 m | +2.68 m | 34 km/h | |
| 38.81 m | +2.95 m | 36 km/h |
The difference between best and worst was 8.2% (2.95 m ≈ 0.7 Car Lengths). From 130 km/h, the Nokian Nordman 8 would still be travelling at 36 km/h when the Goodyear UltraGrip Arctic 2 had stopped.
Residual speed is calculated from the measured braking distances, assuming constant deceleration; it is not a separate measurement.
Wet Handling
Wet handling time in seconds
Lower is better ↓| Position / Tyre | Result | Gap to best |
|---|---|---|
| 41.87 s | Best | |
| 41.89 s | +0.02 s | |
| 42.12 s | +0.25 s | |
| 42.47 s | +0.60 s | |
| 42.57 s | +0.70 s | |
| 42.57 s | +0.70 s | |
| 42.66 s | +0.79 s | |
| 43.11 s | +1.24 s |
All the tyres in the Wet Handling test finished less than 3% apart.
Snow
Snow Traction
Snow acceleration time (5 - 40 km/h)
Lower is better ↓| Position / Tyre | Result | Gap to best |
|---|---|---|
| 4.65 s | Best | |
| 4.77 s | +0.12 s | |
| 4.8 s | +0.15 s | |
| 4.83 s | +0.18 s | |
| 4.88 s | +0.23 s | |
| 4.94 s | +0.29 s | |
| 4.96 s | +0.31 s | |
| 5.08 s | +0.43 s |
The difference between best and worst was 9.2% (0.43 s).
Snow Braking
Snow braking in meters (40 - 5 km/h)
Lower is better ↓| Position / Tyre | Result | Gap to best | Residual speed |
|---|---|---|---|
| 14.89 m | Best | 0 km/h | |
| 15.11 m | +0.22 m | 16 km/h | |
| 15.12 m | +0.23 m | 16 km/h | |
| 15.18 m | +0.29 m | 18 km/h | |
| 15.23 m | +0.34 m | 19 km/h | |
| 15.26 m | +0.37 m | 20 km/h | |
| 15.26 m | +0.37 m | 20 km/h | |
| 15.65 m | +0.76 m | 29 km/h |
The difference between best and worst was 5.1% (0.76 m). From 130 km/h, the Sava Eskimo Stud would still be travelling at 29 km/h when the BFGoodrich G Force Stud had stopped.
Residual speed is calculated from the measured braking distances, assuming constant deceleration; it is not a separate measurement.
Snow Handling
Snow handling time in seconds
Lower is better ↓| Position / Tyre | Result | Gap to best |
|---|---|---|
| 84.6 s | Best | |
| 84.73 s | +0.13 s | |
| 85.23 s | +0.63 s | |
| 85.38 s | +0.78 s | |
| 85.83 s | +1.23 s | |
| 85.86 s | +1.26 s | |
| 86.37 s | +1.77 s | |
| 87.36 s | +2.76 s |
The difference between best and worst was 3.3% (2.76 s).

Ice
Ice Traction
Ice acceleration time (5 - 30 km/h)
Lower is better ↓| Position / Tyre | Result | Gap to best |
|---|---|---|
| 4.17 s | Best | |
| 4.39 s | +0.22 s | |
| 4.78 s | +0.61 s | |
| 5 s | +0.83 s | |
| 5.86 s | +1.69 s | |
| 5.89 s | +1.72 s | |
| 7.02 s | +2.85 s | |
| 7.6 s | +3.43 s |
The difference between best and worst was 82.3% (3.43 s).
Ice Braking
Ice braking in meters (30 - 5 km/h)
Lower is better ↓| Position / Tyre | Result | Gap to best | Residual speed |
|---|---|---|---|
| 12.22 m | Best | 0 km/h | |
| 12.51 m | +0.29 m | 20 km/h | |
| 12.82 m | +0.60 m | 28 km/h | |
| 13.16 m | +0.94 m | 35 km/h | |
| 15.42 m | +3.20 m | 59 km/h | |
| 16.56 m | +4.34 m | 67 km/h | |
| 18.13 m | +5.91 m | 74 km/h | |
| 18.37 m | +6.15 m | 75 km/h |
The difference between best and worst was 50.3% (6.15 m ≈ 1.4 Car Lengths). From 130 km/h, the BFGoodrich G Force Stud would still be travelling at 75 km/h when the Goodyear UltraGrip Arctic 2 had stopped.
Residual speed is calculated from the measured braking distances, assuming constant deceleration; it is not a separate measurement.
Ice Handling
Ice handling time in seconds
Lower is better ↓| Position / Tyre | Result | Gap to best |
|---|---|---|
| 61.54 s | Best | |
| 62.7 s | +1.16 s | |
| 63.73 s | +2.19 s | |
| 66.54 s | +5.00 s | |
| 66.88 s | +5.34 s | |
| 67.51 s | +5.97 s | |
| 68.12 s | +6.58 s | |
| 71.81 s | +10.27 s |
The difference between best and worst was 16.7% (10.27 s).
Environment
Noise
External noise in dB
Lower is better ↓| Position / Tyre | Result | Gap to best |
|---|---|---|
| 67.5 dB | Best | |
| 68.6 dB | +1.10 dB | |
| 68.7 dB | +1.20 dB | |
| 69.6 dB | +2.10 dB | |
| 70.1 dB | +2.60 dB | |
| 70.1 dB | +2.60 dB | |
| 70.2 dB | +2.70 dB | |
| 70.3 dB | +2.80 dB |
The difference between best and worst was 4.1% (2.8 dB).
Results
Nokian Hakkapeliitta 10
205/55 R16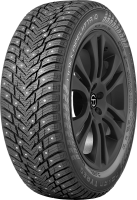
Category scores (% of best)
All discipline results (10)
Discipline positions compare the ranked tyres in this test, not the whole market. These are individual measurements, not weighted overall scores.
| Test | Position in discipline | Result | Gap to best |
|---|---|---|---|
| Dry BrakingLower is better | 4th / 8 | 32.57 m | +1.80 m |
| Wet BrakingLower is better | 5th / 8 | 37.21 m | +1.35 m |
| Wet HandlingLower is better | 5th / 8 | 42.57 s | +0.70 s |
| Snow BrakingLower is better | 6th / 8 | 15.26 m | +0.37 m |
| Snow TractionLower is better | 1st / 8 | 4.65 s | Best in this discipline |
| Snow HandlingLower is better | 1st / 8 | 84.6 s | Best in this discipline |
| Ice BrakingLower is better | 2nd / 8 | 12.51 m | +0.29 m |
| Ice TractionLower is better | 1st / 8 | 4.17 s | Best in this discipline |
| Ice HandlingLower is better | 1st / 8 | 61.54 s | Best in this discipline |
| NoiseLower is better | 5th / 8 | 70.1 dB | +2.60 dB |
Michelin X Ice North 4
205/55 R16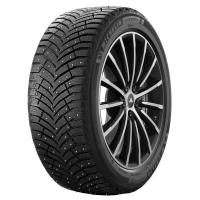
Category scores (% of best)
All discipline results (10)
Discipline positions compare the ranked tyres in this test, not the whole market. These are individual measurements, not weighted overall scores.
| Test | Position in discipline | Result | Gap to best |
|---|---|---|---|
| Dry BrakingLower is better | 5th / 8 | 32.79 m | +2.02 m |
| Wet BrakingLower is better | 7th / 8 | 38.54 m | +2.68 m |
| Wet HandlingLower is better | 8th / 8 | 43.11 s | +1.24 s |
| Snow BrakingLower is better | 2nd / 8 | 15.11 m | +0.22 m |
| Snow TractionLower is better | 2nd / 8 | 4.77 s | +0.12 s |
| Snow HandlingLower is better | 2nd / 8 | 84.73 s | +0.13 s |
| Ice BrakingLower is better | 3rd / 8 | 12.82 m | +0.60 m |
| Ice TractionLower is better | 2nd / 8 | 4.39 s | +0.22 s |
| Ice HandlingLower is better | 2nd / 8 | 62.7 s | +1.16 s |
| NoiseLower is better | 8th / 8 | 70.3 dB | +2.80 dB |
Goodyear UltraGrip Arctic 2
205/55 R16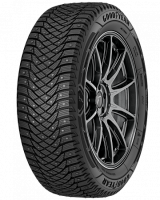
Category scores (% of best)
All discipline results (10)
Discipline positions compare the ranked tyres in this test, not the whole market. These are individual measurements, not weighted overall scores.
| Test | Position in discipline | Result | Gap to best |
|---|---|---|---|
| Dry BrakingLower is better | 7th / 8 | 32.91 m | +2.14 m |
| Wet BrakingLower is better | 1st / 8 | 35.86 m | Best in this discipline |
| Wet HandlingLower is better | 1st / 8 | 41.87 s | Best in this discipline |
| Snow BrakingLower is better | 5th / 8 | 15.23 m | +0.34 m |
| Snow TractionLower is better | 4th / 8 | 4.83 s | +0.18 s |
| Snow HandlingLower is better | 4th / 8 | 85.38 s | +0.78 s |
| Ice BrakingLower is better | 1st / 8 | 12.22 m | Best in this discipline |
| Ice TractionLower is better | 4th / 8 | 5 s | +0.83 s |
| Ice HandlingLower is better | 3rd / 8 | 63.73 s | +2.19 s |
| NoiseLower is better | 4th / 8 | 69.6 dB | +2.10 dB |
Nokian Nordman 8
205/55 R16
Category scores (% of best)
All discipline results (10)
Discipline positions compare the ranked tyres in this test, not the whole market. These are individual measurements, not weighted overall scores.
| Test | Position in discipline | Result | Gap to best |
|---|---|---|---|
| Dry BrakingLower is better | 6th / 8 | 32.86 m | +2.09 m |
| Wet BrakingLower is better | 8th / 8 | 38.81 m | +2.95 m |
| Wet HandlingLower is better | 5th / 8 | 42.57 s | +0.70 s |
| Snow BrakingLower is better | 4th / 8 | 15.18 m | +0.29 m |
| Snow TractionLower is better | 3rd / 8 | 4.8 s | +0.15 s |
| Snow HandlingLower is better | 6th / 8 | 85.86 s | +1.26 s |
| Ice BrakingLower is better | 4th / 8 | 13.16 m | +0.94 m |
| Ice TractionLower is better | 3rd / 8 | 4.78 s | +0.61 s |
| Ice HandlingLower is better | 6th / 8 | 67.51 s | +5.97 s |
| NoiseLower is better | 7th / 8 | 70.2 dB | +2.70 dB |
Continental IceContact 3
205/55 R16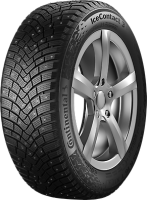
Category scores (% of best)
All discipline results (10)
Discipline positions compare the ranked tyres in this test, not the whole market. These are individual measurements, not weighted overall scores.
| Test | Position in discipline | Result | Gap to best |
|---|---|---|---|
| Dry BrakingLower is better | 8th / 8 | 33.65 m | +2.88 m |
| Wet BrakingLower is better | 4th / 8 | 37.1 m | +1.24 m |
| Wet HandlingLower is better | 2nd / 8 | 41.89 s | +0.02 s |
| Snow BrakingLower is better | 3rd / 8 | 15.12 m | +0.23 m |
| Snow TractionLower is better | 7th / 8 | 4.96 s | +0.31 s |
| Snow HandlingLower is better | 3rd / 8 | 85.23 s | +0.63 s |
| Ice BrakingLower is better | 5th / 8 | 15.42 m | +3.20 m |
| Ice TractionLower is better | 6th / 8 | 5.89 s | +1.72 s |
| Ice HandlingLower is better | 7th / 8 | 68.12 s | +6.58 s |
| NoiseLower is better | 2nd / 8 | 68.6 dB | +1.10 dB |
Gislaved Nord Frost 200
205/55 R16
Category scores (% of best)
All discipline results (10)
Discipline positions compare the ranked tyres in this test, not the whole market. These are individual measurements, not weighted overall scores.
| Test | Position in discipline | Result | Gap to best |
|---|---|---|---|
| Dry BrakingLower is better | 2nd / 8 | 31.3 m | +0.53 m |
| Wet BrakingLower is better | 6th / 8 | 37.76 m | +1.90 m |
| Wet HandlingLower is better | 3rd / 8 | 42.12 s | +0.25 s |
| Snow BrakingLower is better | 6th / 8 | 15.26 m | +0.37 m |
| Snow TractionLower is better | 6th / 8 | 4.94 s | +0.29 s |
| Snow HandlingLower is better | 7th / 8 | 86.37 s | +1.77 s |
| Ice BrakingLower is better | 6th / 8 | 16.56 m | +4.34 m |
| Ice TractionLower is better | 5th / 8 | 5.86 s | +1.69 s |
| Ice HandlingLower is better | 5th / 8 | 66.88 s | +5.34 s |
| NoiseLower is better | 3rd / 8 | 68.7 dB | +1.20 dB |
BFGoodrich G Force Stud
205/55 R16
Category scores (% of best)
All discipline results (10)
Discipline positions compare the ranked tyres in this test, not the whole market. These are individual measurements, not weighted overall scores.
| Test | Position in discipline | Result | Gap to best |
|---|---|---|---|
| Dry BrakingLower is better | 1st / 8 | 30.77 m | Best in this discipline |
| Wet BrakingLower is better | 3rd / 8 | 36.77 m | +0.91 m |
| Wet HandlingLower is better | 4th / 8 | 42.47 s | +0.60 s |
| Snow BrakingLower is better | 1st / 8 | 14.89 m | Best in this discipline |
| Snow TractionLower is better | 5th / 8 | 4.88 s | +0.23 s |
| Snow HandlingLower is better | 5th / 8 | 85.83 s | +1.23 s |
| Ice BrakingLower is better | 8th / 8 | 18.37 m | +6.15 m |
| Ice TractionLower is better | 7th / 8 | 7.02 s | +2.85 s |
| Ice HandlingLower is better | 4th / 8 | 66.54 s | +5.00 s |
| NoiseLower is better | 1st / 8 | 67.5 dB | Best in this discipline |
Sava Eskimo Stud
205/55 R16
Category scores (% of best)
All discipline results (10)
Discipline positions compare the ranked tyres in this test, not the whole market. These are individual measurements, not weighted overall scores.
| Test | Position in discipline | Result | Gap to best |
|---|---|---|---|
| Dry BrakingLower is better | 3rd / 8 | 31.86 m | +1.09 m |
| Wet BrakingLower is better | 2nd / 8 | 36.31 m | +0.45 m |
| Wet HandlingLower is better | 7th / 8 | 42.66 s | +0.79 s |
| Snow BrakingLower is better | 8th / 8 | 15.65 m | +0.76 m |
| Snow TractionLower is better | 8th / 8 | 5.08 s | +0.43 s |
| Snow HandlingLower is better | 8th / 8 | 87.36 s | +2.76 s |
| Ice BrakingLower is better | 7th / 8 | 18.13 m | +5.91 m |
| Ice TractionLower is better | 8th / 8 | 7.6 s | +3.43 s |
| Ice HandlingLower is better | 8th / 8 | 71.81 s | +10.27 s |
| NoiseLower is better | 5th / 8 | 70.1 dB | +2.60 dB |
Discussion