



Vi Bilägare has completed their latest winter tyre test, evaluating seven dedicated Nordic friction tyres and one all-season tyre in size 225/45 R17. The reigning champion, Continental VikingContact 7, has been replaced by the VikingContact 8, which is tested against competitors from Goodyear, Michelin, Nokian, and Hankook. The test also included two budget tyres, Radar and Greenmax.
Test setup & methodology
The test setting, the conditions recorded and how the results contribute to the score.
Recorded test conditions
Recorded test conditions
- Dry Braking
- 80 → 5 km/h · 15–17 °C
- Subj. Dry Handling
- 11–14 °C
- Wet Braking
- 80 → 5 km/h · 13–15 °C
- Wet Handling
- 8–10 °C
- Straight Aqua
- 6–7 °C
- Snow Braking
- 35 → 5 km/h · -9–-6 °C
- Snow Traction
- 5 → 35 km/h · -9–-6 °C
- Snow Handling
- -7–-6 °C
- Ice Braking
- 25 → 5 km/h · -6–-5 °C
- Ice Traction
- 5 → 25 km/h · -6–-5 °C
- Ice Handling
- -11–-9 °C
The inclusion of the Michelin CrossClimate 2 in this winter tyre test provides an interesting insight into the capabilities of modern all-season tyres in winter conditions. While the tyre demonstrated exceptional performance in wet conditions, significantly outperforming all winter tyres in wet braking and handling, its winter limitations were clear. On ice, the CrossClimate 2 showed very poor grip levels with braking distances nearly twice that of the best winter tyres. Snow performance, while better than ice, still fell well behind dedicated winter options.
The tyre's mixed performance led to an interesting result - despite its poor winter characteristics, strong wet and dry performance helped it outperform the budget winter tyres overall. However, the test highlights that while all-season tyres might work for drivers in milder regions who rarely encounter severe winter conditions, they're not a suitable replacement for Nordic winter tyres in areas where ice and snow are common. The CrossClimate 2 also showed the highest noise levels in the test, reflecting its stiffer, more summer-oriented construction.
Even with it's all season design goal, thanks to the huge lead it had in the dry and wet it got enough points to outscore two of the nordic winter tyres overall.
Dry
The Michelin CrossClimate 2 dominated this test with a stopping distance of 25.85m, significantly outperforming all winter tyres. The Greenmax LL Winter Ice I-15 performed worst, needing an additional 6.87m (26.6% longer) to stop.
Dry Braking
Dry braking in meters (80 - 5 km/h) [Average Temperature 16c]
Lower is better ↓| Position / Tyre | Result | Gap to best | Residual speed |
|---|---|---|---|
| 25.85 m | Best | 0 km/h | |
| 31.2 m | +5.35 m | 54 km/h | |
| 31.35 m | +5.50 m | 54 km/h | |
| 31.57 m | +5.72 m | 55 km/h | |
| 32.1 m | +6.25 m | 57 km/h | |
| 32.37 m | +6.52 m | 58 km/h | |
| 32.61 m | +6.76 m | 59 km/h | |
| 32.72 m | +6.87 m | 60 km/h |
The difference between best and worst was 26.6% (6.87 m ≈ 1.5 Car Lengths). From 130 km/h, the Greenmax LL Winter Ice I 15 would still be travelling at 60 km/h when the Michelin CrossClimate 2 had stopped.
Residual speed is calculated from the measured braking distances, assuming constant deceleration; it is not a separate measurement.
The testers didn't provide laptimes for dry handling, instead publishing subjective scores out of five.
Subj. Dry Handling
Subjective Dry Handling Score [Average Temperature 12.5c]
Higher is better ↑| Position / Tyre | Result | Gap to best |
|---|---|---|
| 5 Points | Best | |
| 5 Points | Best | |
| 4 Points | -1.00 Points | |
| 4 Points | -1.00 Points | |
| 4 Points | -1.00 Points | |
| 3 Points | -2.00 Points | |
| 1 Points | -4.00 Points | |
| 1 Points | -4.00 Points |
The difference between best and worst was 80% (4 Points).
Wet
The CrossClimate 2 again led by a substantial margin, stopping in 27.49m. The Radar Dimax Ice performed worst, requiring 42.66m - a concerning 15.17m (55% longer) additional stopping distance.
Wet Braking
Wet braking in meters (80 - 5 km/h) [Average Temperature 14c]
Lower is better ↓| Position / Tyre | Result | Gap to best | Residual speed |
|---|---|---|---|
| 27.49 m | Best | 0 km/h | |
| 37.55 m | +10.06 m | 67 km/h | |
| 39.1 m | +11.61 m | 71 km/h | |
| 40.1 m | +12.61 m | 73 km/h | |
| 40.36 m | +12.87 m | 73 km/h | |
| 41.92 m | +14.43 m | 76 km/h | |
| 42.48 m | +14.99 m | 77 km/h | |
| 42.66 m | +15.17 m | 78 km/h |
The difference between best and worst was 55.2% (15.17 m ≈ 3.4 Car Lengths). From 130 km/h, the Radar Dimax Ice would still be travelling at 78 km/h when the Michelin CrossClimate 2 had stopped.
Residual speed is calculated from the measured braking distances, assuming constant deceleration; it is not a separate measurement.
The CrossClimate 2 continued its wet weather dominance with the fastest lap time of 38.4 seconds. The Greenmax LL Winter Ice I-15 was slowest, taking 44.3 seconds - 5.9 seconds (15.4%) slower.
Wet Handling
Wet handling time in seconds [Average Temperature 9c]
Lower is better ↓| Position / Tyre | Result | Gap to best |
|---|---|---|
| 38.4 s | Best | |
| 40.6 s | +2.20 s | |
| 41.2 s | +2.80 s | |
| 41.7 s | +3.30 s | |
| 41.7 s | +3.30 s | |
| 42.5 s | +4.10 s | |
| 43.9 s | +5.50 s | |
| 44.3 s | +5.90 s |
The difference between best and worst was 15.4% (5.9 s).
The CrossClimate 2 showed exceptional aquaplaning resistance, maintaining grip until 86 km/h. The Radar Dimax Ice lost grip earliest at just 58.2 km/h, showing significantly worse water displacement.
Straight Aqua
Float Speed in Km/H [Average Temperature 6.5c]
Higher is better ↑| Position / Tyre | Result | Gap to best |
|---|---|---|
| 86 km/h | Best | |
| 68.5 km/h | -17.50 km/h | |
| 64.7 km/h | -21.30 km/h | |
| 63.3 km/h | -22.70 km/h | |
| 62.4 km/h | -23.60 km/h | |
| 59.8 km/h | -26.20 km/h | |
| 59.8 km/h | -26.20 km/h | |
| 58.2 km/h | -27.80 km/h |
The difference between best and worst was 32.3% (27.8 Km/H).
Snow
The Goodyear UltraGrip Ice 3 led with 12.43m stopping distance. The CrossClimate 2 struggled, requiring 13.28m - the longest distance of all tested tyres.
Snow Braking
Snow braking in meters (35 - 5 km/h) [Average Temperature -7.5c]
Lower is better ↓| Position / Tyre | Result | Gap to best | Residual speed |
|---|---|---|---|
| 12.43 m | Best | 0 km/h | |
| 12.46 m | +0.03 m | 6 km/h | |
| 12.5 m | +0.07 m | 10 km/h | |
| 12.72 m | +0.29 m | 20 km/h | |
| 12.73 m | +0.30 m | 20 km/h | |
| 12.8 m | +0.37 m | 22 km/h | |
| 12.98 m | +0.55 m | 27 km/h | |
| 13.28 m | +0.85 m | 33 km/h |
The difference between best and worst was 6.8% (0.85 m). From 130 km/h, the Michelin CrossClimate 2 would still be travelling at 33 km/h when the Goodyear UltraGrip Ice 3 had stopped.
Residual speed is calculated from the measured braking distances, assuming constant deceleration; it is not a separate measurement.
The Goodyear UltraGrip Ice 3 demonstrated best acceleration with 4.04 seconds. The Radar Dimax Ice was slowest at 4.46 seconds, while the CrossClimate 2 performed mid-pack.
Snow Traction
Snow acceleration time (5 - 35 km/h) [Average Temperature -7.5c]
Lower is better ↓| Position / Tyre | Result | Gap to best |
|---|---|---|
| 4.04 s | Best | |
| 4.19 s | +0.15 s | |
| 4.2 s | +0.16 s | |
| 4.2 s | +0.16 s | |
| 4.21 s | +0.17 s | |
| 4.23 s | +0.19 s | |
| 4.3 s | +0.26 s | |
| 4.46 s | +0.42 s |
The difference between best and worst was 10.4% (0.42 s).
The Goodyear excelled with a lap time of 79.6 seconds. The CrossClimate 2 was significantly slower at 84.7 seconds - the worst performer.
Snow Handling
Snow handling time in seconds [Average Temperature -6.5c]
Lower is better ↓| Position / Tyre | Result | Gap to best |
|---|---|---|
| 79.6 s | Best | |
| 79.7 s | +0.10 s | |
| 79.7 s | +0.10 s | |
| 81 s | +1.40 s | |
| 81.5 s | +1.90 s | |
| 81.8 s | +2.20 s | |
| 83 s | +3.40 s | |
| 84.7 s | +5.10 s |
The difference between best and worst was 6.4% (5.1 s).

Ice
The Michelin X-Ice Snow led with 10.69m. The CrossClimate 2 performed very poorly, requiring 18.39m - nearly twice the distance.
Ice Braking
Ice braking in meters (25 - 5 km/h) [Average Temperature -5.5c]
Lower is better ↓| Position / Tyre | Result | Gap to best | Residual speed |
|---|---|---|---|
| 10.69 m | Best | 0 km/h | |
| 11.37 m | +0.68 m | 32 km/h | |
| 11.97 m | +1.28 m | 43 km/h | |
| 12.75 m | +2.06 m | 52 km/h | |
| 15.56 m | +4.87 m | 73 km/h | |
| 15.68 m | +4.99 m | 73 km/h | |
| 18.38 m | +7.69 m | 84 km/h | |
| 18.39 m | +7.70 m | 84 km/h |
The difference between best and worst was 72% (7.7 m ≈ 1.7 Car Lengths). From 130 km/h, the Michelin CrossClimate 2 would still be travelling at 84 km/h when the Michelin X Ice Snow had stopped.
Residual speed is calculated from the measured braking distances, assuming constant deceleration; it is not a separate measurement.
The Michelin X-Ice Snow was fastest with 7.53 seconds. The CrossClimate 2 tied with Greenmax for worst performance at 13 seconds - 72% slower than the best.
Ice Traction
Ice acceleration time (5 - 25 km/h) [Average Temperature -5.5c]
Lower is better ↓| Position / Tyre | Result | Gap to best |
|---|---|---|
| 7.53 s | Best | |
| 8.01 s | +0.48 s | |
| 8.44 s | +0.91 s | |
| 8.99 s | +1.46 s | |
| 11 s | +3.47 s | |
| 11 s | +3.47 s | |
| 13 s | +5.47 s | |
| 13 s | +5.47 s |
The difference between best and worst was 72.6% (5.47 s).
The Continental VikingContact 8 was quickest with 64.6 seconds. The CrossClimate 2 was slowest at 72.8 seconds - 12.7% behind the leader.
Ice Handling
Ice handling time in seconds [Average Temperature -10c]
Lower is better ↓| Position / Tyre | Result | Gap to best |
|---|---|---|
| 64.6 s | Best | |
| 65 s | +0.40 s | |
| 66.4 s | +1.80 s | |
| 67 s | +2.40 s | |
| 67.8 s | +3.20 s | |
| 69.3 s | +4.70 s | |
| 69.7 s | +5.10 s | |
| 72.8 s | +8.20 s |
The difference between best and worst was 12.7% (8.2 s).
Comfort
The Goodyear UltraGrip Ice 3 was quietest at 71.5 dB. The CrossClimate 2 was loudest at 72.9 dB, reflecting its stiffer construction.
Noise
External noise in dB
Lower is better ↓| Position / Tyre | Result | Gap to best |
|---|---|---|
| 71.5 dB | Best | |
| 71.7 dB | +0.20 dB | |
| 71.7 dB | +0.20 dB | |
| 71.8 dB | +0.30 dB | |
| 71.9 dB | +0.40 dB | |
| 72 dB | +0.50 dB | |
| 72.1 dB | +0.60 dB | |
| 72.9 dB | +1.40 dB |
All the tyres in the Noise test finished less than 3% apart.
Value
The Goodyear UltraGrip Ice 3 was most efficient at 5.25 L/100km. The Greenmax was worst at 5.6 L/100km, while the CrossClimate 2 tied with the Michelin X-Ice Snow at 5.45 L/100km.
Fuel Consumption
Fuel consumption in Litres per 100 km
Lower is better ↓| Position / Tyre | Result | Gap to best | Extra fuel / year |
|---|---|---|---|
| 5.25 l/100km | Best | £0 | |
| 5.3 l/100km | +0.05 l/100km | £14 | |
| 5.3 l/100km | +0.05 l/100km | £14 | |
| 5.4 l/100km | +0.15 l/100km | £41 | |
| 5.45 l/100km | +0.20 l/100km | £55 | |
| 5.45 l/100km | +0.20 l/100km | £55 | |
| 5.55 l/100km | +0.30 l/100km | £83 | |
| 5.6 l/100km | +0.35 l/100km | £96 |
The difference between best and worst was 6.7% (0.35 l/100km). Over 19,000 km a year at £1.45/L, the Greenmax LL Winter Ice I 15 uses about 66 L (£96) more fuel than the Goodyear UltraGrip Ice 3.
Adjust the assumptions
Calculated estimates, not additional measurements. Use the controls to explore the assumptions.
Results
Goodyear UltraGrip Ice 3
225/45 R17 94T XL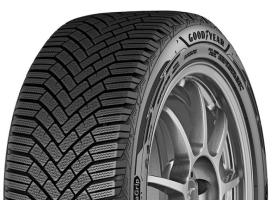
Category scores (% of best)
All discipline results (13)
Discipline positions compare the ranked tyres in this test, not the whole market. These are individual measurements, not weighted overall scores.
| Test | Position in discipline | Result | Gap to best |
|---|---|---|---|
| Dry BrakingLower is better | 5th / 8 | 32.1 m | +6.25 m |
| Subj. Dry HandlingHigher is better | 1st / 8 | 5 Points | Best in this discipline |
| Wet BrakingLower is better | 2nd / 8 | 37.55 m | +10.06 m |
| Wet HandlingLower is better | 2nd / 8 | 40.6 s | +2.20 s |
| Straight AquaHigher is better | 2nd / 8 | 68.5 km/h | -17.50 km/h |
| Snow BrakingLower is better | 1st / 8 | 12.43 m | Best in this discipline |
| Snow TractionLower is better | 1st / 8 | 4.04 s | Best in this discipline |
| Snow HandlingLower is better | 1st / 8 | 79.6 s | Best in this discipline |
| Ice BrakingLower is better | 4th / 8 | 12.75 m | +2.06 m |
| Ice TractionLower is better | 4th / 8 | 8.99 s | +1.46 s |
| Ice HandlingLower is better | 3rd / 8 | 66.4 s | +1.80 s |
| NoiseLower is better | 1st / 8 | 71.5 dB | Best in this discipline |
| Fuel ConsumptionLower is better | 1st / 8 | 5.25 l/100km | Best in this discipline |
- 3PMSF
- Yes
- Weight
- 9.5 kgs
- Tread
- 7.5 mm
- Price
- 2183.00
Continental VikingContact 8
225/45 R17 94T XL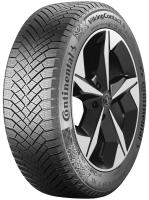
Category scores (% of best)
All discipline results (13)
Discipline positions compare the ranked tyres in this test, not the whole market. These are individual measurements, not weighted overall scores.
| Test | Position in discipline | Result | Gap to best |
|---|---|---|---|
| Dry BrakingLower is better | 2nd / 8 | 31.2 m | +5.35 m |
| Subj. Dry HandlingHigher is better | 3rd / 8 | 4 Points | -1.00 Points |
| Wet BrakingLower is better | 4th / 8 | 40.1 m | +12.61 m |
| Wet HandlingLower is better | 3rd / 8 | 41.2 s | +2.80 s |
| Straight AquaHigher is better | 6th / 8 | 59.8 km/h | -26.20 km/h |
| Snow BrakingLower is better | 4th / 8 | 12.72 m | +0.29 m |
| Snow TractionLower is better | 2nd / 8 | 4.19 s | +0.15 s |
| Snow HandlingLower is better | 2nd / 8 | 79.7 s | +0.10 s |
| Ice BrakingLower is better | 3rd / 8 | 11.97 m | +1.28 m |
| Ice TractionLower is better | 3rd / 8 | 8.44 s | +0.91 s |
| Ice HandlingLower is better | 1st / 8 | 64.6 s | Best in this discipline |
| NoiseLower is better | 4th / 8 | 71.8 dB | +0.30 dB |
| Fuel ConsumptionLower is better | 2nd / 8 | 5.3 l/100km | +0.05 l/100km |
- 3PMSF
- Yes
- Weight
- 9.9 kgs
- Tread
- 7.9 mm
- Price
- 2549.00
Nokian Hakkapeliitta R5
225/45 R17 94T XL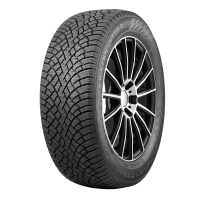
Category scores (% of best)
All discipline results (13)
Discipline positions compare the ranked tyres in this test, not the whole market. These are individual measurements, not weighted overall scores.
| Test | Position in discipline | Result | Gap to best |
|---|---|---|---|
| Dry BrakingLower is better | 3rd / 8 | 31.35 m | +5.50 m |
| Subj. Dry HandlingHigher is better | 6th / 8 | 3 Points | -2.00 Points |
| Wet BrakingLower is better | 6th / 8 | 41.92 m | +14.43 m |
| Wet HandlingLower is better | 4th / 8 | 41.7 s | +3.30 s |
| Straight AquaHigher is better | 6th / 8 | 59.8 km/h | -26.20 km/h |
| Snow BrakingLower is better | 2nd / 8 | 12.46 m | +0.03 m |
| Snow TractionLower is better | 3rd / 8 | 4.2 s | +0.16 s |
| Snow HandlingLower is better | 2nd / 8 | 79.7 s | +0.10 s |
| Ice BrakingLower is better | 2nd / 8 | 11.37 m | +0.68 m |
| Ice TractionLower is better | 2nd / 8 | 8.01 s | +0.48 s |
| Ice HandlingLower is better | 2nd / 8 | 65 s | +0.40 s |
| NoiseLower is better | 5th / 8 | 71.9 dB | +0.40 dB |
| Fuel ConsumptionLower is better | 2nd / 8 | 5.3 l/100km | +0.05 l/100km |
- 3PMSF
- Yes
- Weight
- 9.6 kgs
- Tread
- 8.2 mm
- Price
- 2332.00
Michelin X Ice Snow
225/45 R17 94H XL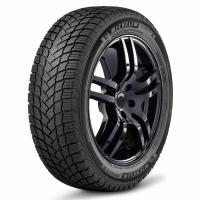
Category scores (% of best)
All discipline results (13)
Discipline positions compare the ranked tyres in this test, not the whole market. These are individual measurements, not weighted overall scores.
| Test | Position in discipline | Result | Gap to best |
|---|---|---|---|
| Dry BrakingLower is better | 4th / 8 | 31.57 m | +5.72 m |
| Subj. Dry HandlingHigher is better | 3rd / 8 | 4 Points | -1.00 Points |
| Wet BrakingLower is better | 3rd / 8 | 39.1 m | +11.61 m |
| Wet HandlingLower is better | 4th / 8 | 41.7 s | +3.30 s |
| Straight AquaHigher is better | 3rd / 8 | 64.7 km/h | -21.30 km/h |
| Snow BrakingLower is better | 3rd / 8 | 12.5 m | +0.07 m |
| Snow TractionLower is better | 6th / 8 | 4.23 s | +0.19 s |
| Snow HandlingLower is better | 4th / 8 | 81 s | +1.40 s |
| Ice BrakingLower is better | 1st / 8 | 10.69 m | Best in this discipline |
| Ice TractionLower is better | 1st / 8 | 7.53 s | Best in this discipline |
| Ice HandlingLower is better | 5th / 8 | 67.8 s | +3.20 s |
| NoiseLower is better | 7th / 8 | 72.1 dB | +0.60 dB |
| Fuel ConsumptionLower is better | 5th / 8 | 5.45 l/100km | +0.20 l/100km |
- 3PMSF
- Yes
- Weight
- 10 kgs
- Tread
- 8 mm
- Price
- 2573.00
Hankook Winter I cept iZ2 W616
225/45 R17 94T XL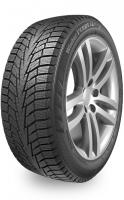
Category scores (% of best)
All discipline results (13)
Discipline positions compare the ranked tyres in this test, not the whole market. These are individual measurements, not weighted overall scores.
| Test | Position in discipline | Result | Gap to best |
|---|---|---|---|
| Dry BrakingLower is better | 6th / 8 | 32.37 m | +6.52 m |
| Subj. Dry HandlingHigher is better | 3rd / 8 | 4 Points | -1.00 Points |
| Wet BrakingLower is better | 5th / 8 | 40.36 m | +12.87 m |
| Wet HandlingLower is better | 6th / 8 | 42.5 s | +4.10 s |
| Straight AquaHigher is better | 5th / 8 | 62.4 km/h | -23.60 km/h |
| Snow BrakingLower is better | 5th / 8 | 12.73 m | +0.30 m |
| Snow TractionLower is better | 3rd / 8 | 4.2 s | +0.16 s |
| Snow HandlingLower is better | 5th / 8 | 81.5 s | +1.90 s |
| Ice BrakingLower is better | 6th / 8 | 15.68 m | +4.99 m |
| Ice TractionLower is better | 5th / 8 | 11 s | +3.47 s |
| Ice HandlingLower is better | 6th / 8 | 69.3 s | +4.70 s |
| NoiseLower is better | 2nd / 8 | 71.7 dB | +0.20 dB |
| Fuel ConsumptionLower is better | 4th / 8 | 5.4 l/100km | +0.15 l/100km |
- 3PMSF
- Yes
- Weight
- 9.6 kgs
- Tread
- 8.3 mm
- Price
- 1717.00
Michelin CrossClimate 2
225/45 R17 94V XL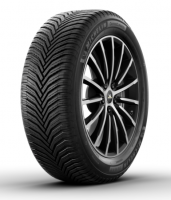
Category scores (% of best)
All discipline results (13)
Discipline positions compare the ranked tyres in this test, not the whole market. These are individual measurements, not weighted overall scores.
| Test | Position in discipline | Result | Gap to best |
|---|---|---|---|
| Dry BrakingLower is better | 1st / 8 | 25.85 m | Best in this discipline |
| Subj. Dry HandlingHigher is better | 1st / 8 | 5 Points | Best in this discipline |
| Wet BrakingLower is better | 1st / 8 | 27.49 m | Best in this discipline |
| Wet HandlingLower is better | 1st / 8 | 38.4 s | Best in this discipline |
| Straight AquaHigher is better | 1st / 8 | 86 km/h | Best in this discipline |
| Snow BrakingLower is better | 8th / 8 | 13.28 m | +0.85 m |
| Snow TractionLower is better | 5th / 8 | 4.21 s | +0.17 s |
| Snow HandlingLower is better | 8th / 8 | 84.7 s | +5.10 s |
| Ice BrakingLower is better | 8th / 8 | 18.39 m | +7.70 m |
| Ice TractionLower is better | 7th / 8 | 13 s | +5.47 s |
| Ice HandlingLower is better | 8th / 8 | 72.8 s | +8.20 s |
| NoiseLower is better | 8th / 8 | 72.9 dB | +1.40 dB |
| Fuel ConsumptionLower is better | 5th / 8 | 5.45 l/100km | +0.20 l/100km |
- 3PMSF
- Yes
- Weight
- 8.9 kgs
- Tread
- 6.3 mm
- Price
- 1567.00
Radar Dimax Ice
225/45 R17 94T XL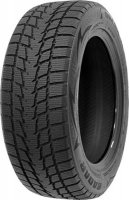
Category scores (% of best)
All discipline results (13)
Discipline positions compare the ranked tyres in this test, not the whole market. These are individual measurements, not weighted overall scores.
| Test | Position in discipline | Result | Gap to best |
|---|---|---|---|
| Dry BrakingLower is better | 7th / 8 | 32.61 m | +6.76 m |
| Subj. Dry HandlingHigher is better | 7th / 8 | 1 Points | -4.00 Points |
| Wet BrakingLower is better | 8th / 8 | 42.66 m | +15.17 m |
| Wet HandlingLower is better | 7th / 8 | 43.9 s | +5.50 s |
| Straight AquaHigher is better | 8th / 8 | 58.2 km/h | -27.80 km/h |
| Snow BrakingLower is better | 6th / 8 | 12.8 m | +0.37 m |
| Snow TractionLower is better | 8th / 8 | 4.46 s | +0.42 s |
| Snow HandlingLower is better | 6th / 8 | 81.8 s | +2.20 s |
| Ice BrakingLower is better | 5th / 8 | 15.56 m | +4.87 m |
| Ice TractionLower is better | 5th / 8 | 11 s | +3.47 s |
| Ice HandlingLower is better | 4th / 8 | 67 s | +2.40 s |
| NoiseLower is better | 6th / 8 | 72 dB | +0.50 dB |
| Fuel ConsumptionLower is better | 7th / 8 | 5.55 l/100km | +0.30 l/100km |
- 3PMSF
- Yes
- Weight
- 9.9 kgs
- Tread
- 8 mm
- Price
- 1129.00
Greenmax LL Winter Ice I 15
225/45 R17 94T XL
Category scores (% of best)
All discipline results (13)
Discipline positions compare the ranked tyres in this test, not the whole market. These are individual measurements, not weighted overall scores.
| Test | Position in discipline | Result | Gap to best |
|---|---|---|---|
| Dry BrakingLower is better | 8th / 8 | 32.72 m | +6.87 m |
| Subj. Dry HandlingHigher is better | 7th / 8 | 1 Points | -4.00 Points |
| Wet BrakingLower is better | 7th / 8 | 42.48 m | +14.99 m |
| Wet HandlingLower is better | 8th / 8 | 44.3 s | +5.90 s |
| Straight AquaHigher is better | 4th / 8 | 63.3 km/h | -22.70 km/h |
| Snow BrakingLower is better | 7th / 8 | 12.98 m | +0.55 m |
| Snow TractionLower is better | 7th / 8 | 4.3 s | +0.26 s |
| Snow HandlingLower is better | 7th / 8 | 83 s | +3.40 s |
| Ice BrakingLower is better | 7th / 8 | 18.38 m | +7.69 m |
| Ice TractionLower is better | 7th / 8 | 13 s | +5.47 s |
| Ice HandlingLower is better | 7th / 8 | 69.7 s | +5.10 s |
| NoiseLower is better | 2nd / 8 | 71.7 dB | +0.20 dB |
| Fuel ConsumptionLower is better | 8th / 8 | 5.6 l/100km | +0.35 l/100km |
- 3PMSF
- Yes
- Weight
- 9.8 kgs
- Tread
- 8.9 mm
- Price
- 1047.00
Discussion