
Seven Michelin road tyres, from the CrossClimate 3 up to the Pilot Sport Cup 2 R, tested back to back on the same car in the wet, in the dry, on snow, and for rolling resistance. Michelin's winter range is covered in a separate test.
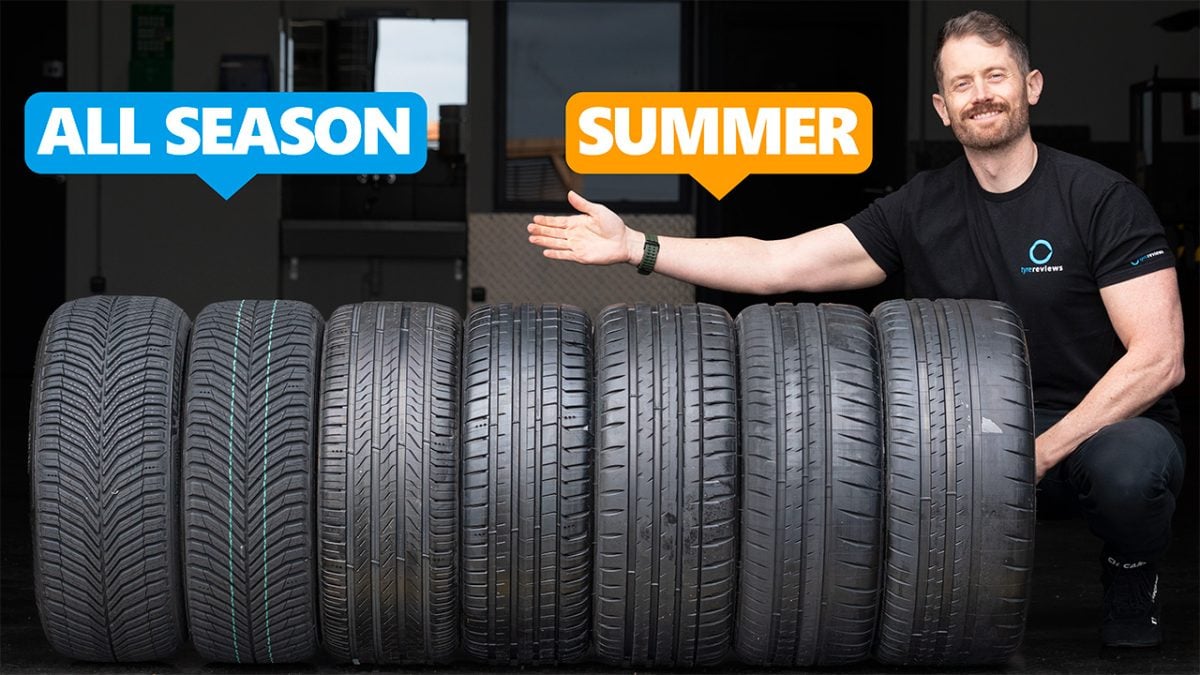
This is not a comparison test and there is no winner. What running them together does give you is a measured picture of the gaps between the categories, from one car, one set of surfaces and one set of conditions.
Test setup & methodology
The test setting, the conditions recorded and how the results contribute to the score.
- Tyre Pressures (as recorded)
- 2.5
- Test Driver
- Jonathan Benson
Show full testing methodology
Recorded test conditions
- Dry Braking
- 100 → 5 km/h · 15–16 °C
- Dry Handling
- 11–15 °C
- Wet Braking
- 10–14 °C
- Wet Handling
- 10–15 °C
Score Weighting
Weights express the scoring priorities, not how much each discipline actually changed the finishing order. The size of the performance gaps matters too. Category weights contribute to the overall score. Within each category, discipline weights divide that category’s share. Published finishing positions also need to be read alongside the editorial verdict.
| Test | Within category | Share of overall score |
|---|---|---|
| Dry · 37% | ||
| Dry Braking | 50% | 18.5% |
| Dry Handling | 50% | 18.5% |
| Wet · 53% | ||
| Wet Braking | 35% | 18.55% |
| Wet Handling | 35% | 18.55% |
| Straight Aqua | 15% | 7.95% |
| Curved Aquaplaning | 15% | 7.95% |
| Value · 10% | ||
| Rolling Resistance | 100% | 10% |
Our standard methods
The conditions above are recorded for this test. The descriptions below explain our standard procedures; measurement windows and run counts can vary by test.
Dry Braking
For dry braking, I drive the test vehicle at an entry speed of 110 km/h and apply full braking effort to a standstill with ABS active on clean, dry asphalt. I typically use an 100–5 km/h measurement window. My standard programme is five runs per tyre set where possible, although the sequence can extend to as many as fifteen runs if conditions and tyre category justify it. I analyse the full set of runs and discard statistical outliers before averaging. Reference tyres are run repeatedly throughout the session to correct for changing conditions.
Dry Handling
For dry handling, I drive at the limit of adhesion around a dedicated handling circuit with ESC disabled where possible so I can assess the tyre's natural balance, transient response, and limit behaviour without electronic intervention masking the result. I usually complete between two and five timed laps per tyre set, depending on the circuit, tyre type, and consistency of conditions. I exclude laps affected by clear driver error or obvious environmental inconsistency. Control runs are carried out frequently throughout the session, and I often use multiple sets of control tyres so that wear on the references does not become a meaningful variable. For more track-focused products, I also do endurance testing, which is a set number of laps at race pace to determine tire wear patterns and heat resistance over longer driving.
Wet Braking
For wet braking, I drive the test vehicle at an entry speed of 88 km/h and apply full braking effort to a standstill with ABS active on an asphalt surface with a controlled water film. I typically use an 80–5 km/h measurement window to isolate tyre performance from variability in the initial brake application. My standard programme is eight runs per tyre set where possible, although the sequence can extend to as many as fifteen runs if conditions and tyre category justify it. I analyse the full set of runs and discard statistical outliers before averaging. To correct for changing conditions, I run reference tyres repeatedly throughout the session — in wet testing, typically every three candidate test sets.
Wet Handling
For wet handling, I drive at the limit of adhesion around a dedicated handling circuit. I generally use specialist wet circuits with kerb-watering systems designed to maintain a consistent surface condition. ESC is disabled where possible so I can assess the tyre's natural balance, transient response, and limit behaviour without electronic intervention masking the result. I usually complete between two and five timed laps per tyre set, depending on the circuit, tyre type, and consistency of conditions. I exclude laps affected by clear driver error or obvious environmental inconsistency. Control runs are carried out frequently throughout the session, and I often use multiple sets of control tyres so that wear on the references does not become a meaningful variable.
Straight Aqua
To measure straight-line aquaplaning resistance, I drive one side of the vehicle through a water trough of controlled depth, typically around 7 mm, while the opposite side remains on dry pavement. I enter at a fixed speed and then accelerate progressively. I define aquaplaning onset as the point at which the wheel travelling through the water exceeds a specified slip threshold relative to the dry-side reference wheel. I usually perform four runs per tyre set and average the valid results.
Curved Aquaplaning
For curved aquaplaning, I use a circular track, typically around 100 metres in diameter, with a flooded arc of controlled water depth, usually about 7 mm. The vehicle is instrumented with GPS telemetry and a tri-axial accelerometer. I drive through the flooded section at progressively increasing speed, typically in 5 km/h increments, and record the minimum sustained lateral acceleration at each step. The test continues until lateral acceleration collapses, indicating complete aquaplaning. The result is expressed as remaining lateral acceleration in m/s² as speed rises.
Snow Braking
For snow braking, I drive the test vehicle at an entry speed of 50 km/h and apply full braking effort to a standstill with ABS active on a groomed, compacted snow surface, measuring 45-5 km/h. I generally use a wide VDA (vehicle dynamic area) and progressively move across the surface between runs so that no tyre ever brakes on the same piece of snow twice. My standard programme is twelve runs per tyre set, although the sequence can extend further if the data justify it. I analyse the full set of runs and discard statistical outliers before averaging. The surface is regularly groomed throughout the session. To correct for changing snow surface conditions, I run reference tyres repeatedly — typically every two candidate test sets.
Snow Traction
For snow traction, I accelerate the vehicle from rest on a groomed snow surface with traction control active and measure speed and time using GPS telemetry. I typically use a 5–35 km/h measurement window to reduce the influence of launch transients and powertrain irregularities. I use a wide VDA (vehicle dynamic area) and progressively move across the surface between runs so that no tyre ever accelerates on the same piece of snow twice. The surface is regularly groomed throughout the session. I complete multiple runs per tyre set and average the valid results. Reference tyres are run typically every two candidate test sets to correct for changing snow surface conditions.
Snow Handling
For snow handling, I drive at the limit of adhesion around a dedicated snow handling circuit with ESC disabled where possible. The circuit is groomed and prepared after every run while tyres are being changed, so each set runs on a consistently prepared surface. I usually complete between two and five timed laps per tyre set, excluding laps affected by clear driver error or obvious environmental inconsistency. Because snow surfaces degrade more rapidly than asphalt, control runs are carried out more frequently — typically every two candidate test sets.
Rolling Resistance
Rolling resistance is measured under controlled laboratory conditions in accordance with ISO 28580 and UNECE Regulation 117 Annex 6. The tyre is mounted on a test wheel and loaded against a large-diameter steel drum. After thermal stabilisation at the prescribed test speed, rolling resistance force is measured at the spindle and corrected according to the relevant procedure. The result is expressed as rolling resistance coefficient, typically in kg/tonne.
The questions behind this test are ones I get asked constantly. Does the CrossClimate 3 Sport match the Pilot Sport 5? Is a CrossClimate 3 or a Primacy 5 the better choice? Could you run a Cup 2 all year? Those are easier to answer from one test than from seven separate ones.
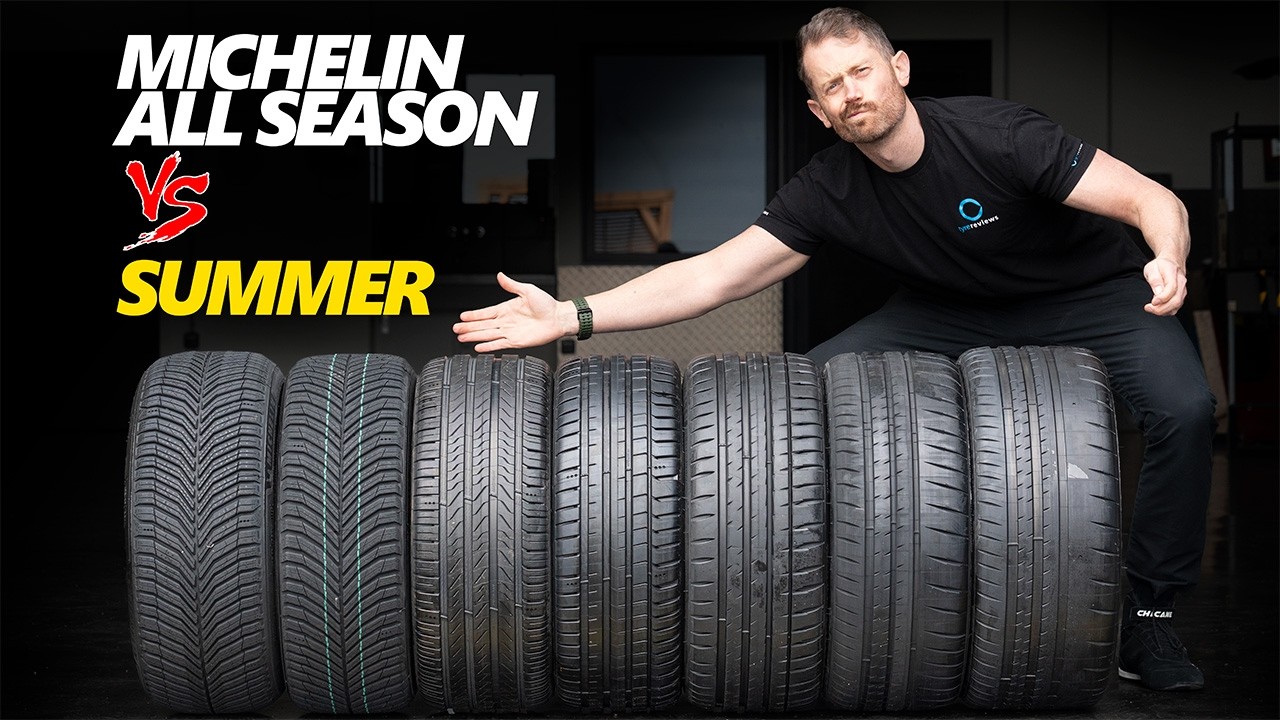
Here is the line up, ordered from the most winter capable to the most track focused:
- Michelin CrossClimate 3 - the premium all season tyre
- Michelin CrossClimate 3 Sport - the sportier all season
- Michelin Primacy 5 - premium touring summer, built for comfort and long life
- Michelin Pilot Sport 5 - the ultra high performance summer tyre
- Michelin Pilot Sport 4 S - the max performance summer tyre
- Michelin Pilot Sport Cup 2 - track focused semi slick
- Michelin Pilot Sport Cup 2 R - even more track focused again
All seven ran in 225/40 R18 with the exception of the Cup 2 R, which was tested in 235/35 R19. That size difference matters in a couple of places and I will flag it where it does. The Pilot Sport 5 was used as the control tyre and was re-run every three sets to track how the circuits were evolving through the day.
Wet
Wet handling
I am deliberately not walking through this in order of slowest to fastest, because that would imply best and worst. What the wet handling lap actually shows is how much lap time each design brief costs you.
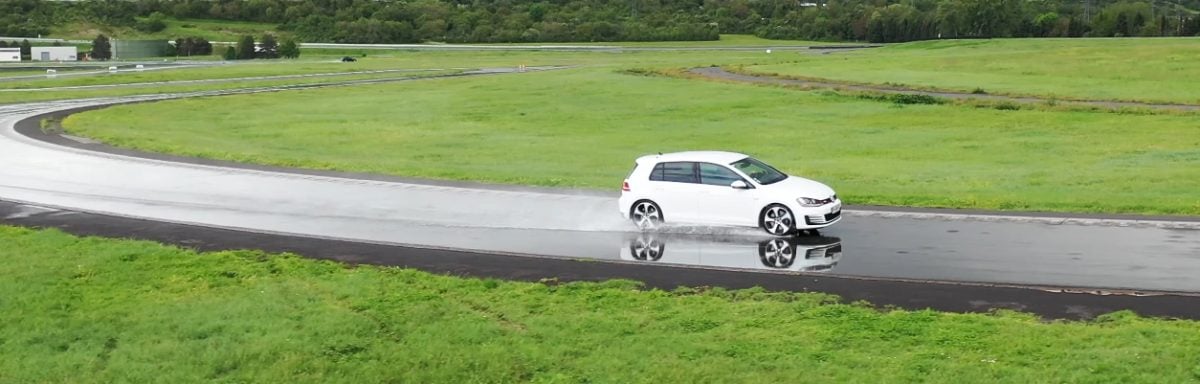
The CrossClimate 3 was the slowest of the road tyres here, and that is exactly what you would expect. Wet grip and snow grip pull a tread pattern and a compound in opposite directions, so the tyre that is best on snow has the lowest ceiling in the wet. It is a lovely thing to drive though. There is almost no way to destabilise the rear axle, it is understeer led and completely predictable, and it is genuinely one of the easiest tyres in this group to drive quickly in the wet. It just does not feel dynamic, and it does not really suit a GTI.
The CrossClimate 3 Sport was a clear step on, taking around three and a half percent out of the CrossClimate 3's lap. Even on the drive out to the wet circuit the steering was different, with a proper ramp up in effort once you were off centre. On the track you get feedback and granularity that the standard CrossClimate 3 simply does not have, and crucially you get the ability to change what the car is doing mid-corner. You can tuck the nose in a little more, and the tyre reacts once it is loaded up. That is the thing a non-sporty tyre will not give you.
The Primacy 5 was faster again, which is the summer versus all season gap doing its work. It does not have to function in snow, so it does not have to compromise. What is interesting is that subjectively it felt more like the CrossClimate 3 than the CrossClimate 3 Sport. If you are wondering how the CrossClimate 3 Sport stacks up against a premium touring summer tyre, it feels sportier, even though the touring summer tyre is quicker over a lap. The Primacy 5 is also just an extremely easy, safe, predictable thing to drive below the limit, which is a category Michelin are as good at as anyone in the industry.
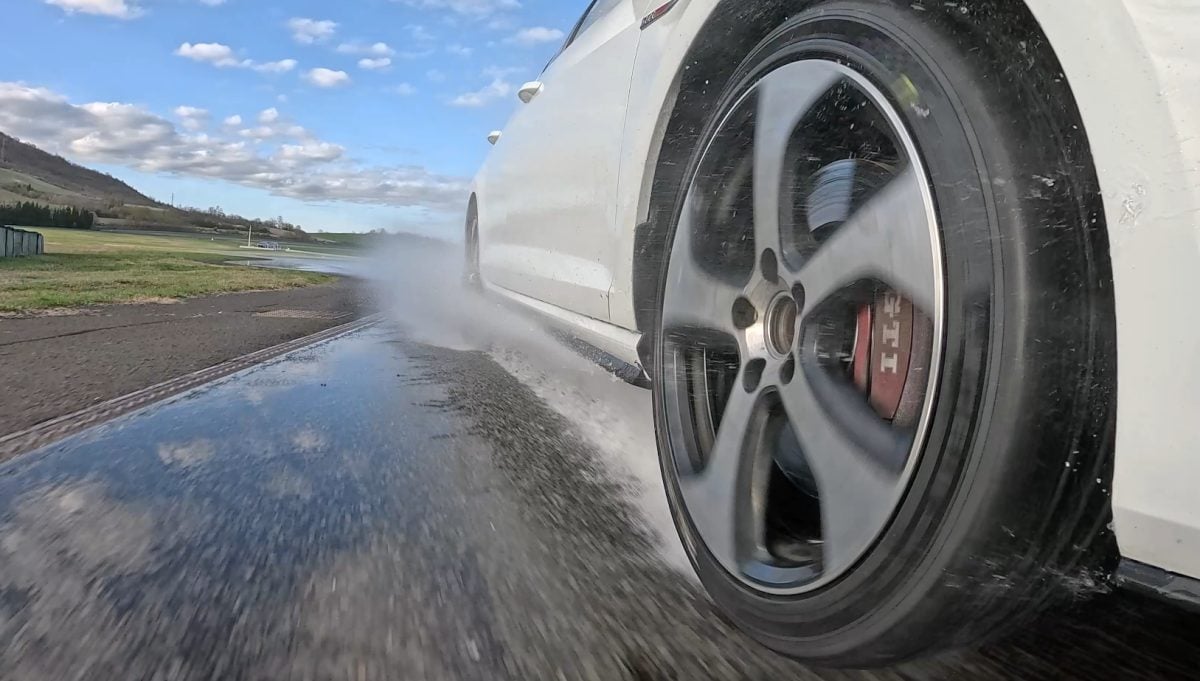
The Pilot Sport 5 and Pilot Sport 4 S were on another level. The Pilot Sport 5 was my control, so I drove it every three sets, and every single time I got out thinking it was fantastic. It felt like a CrossClimate 3 Sport with more grip and more bite, you could get some rear axle movement if you wanted it, and the braking felt razor sharp after a run of all season tyres. Then the Pilot Sport 4 S went one better. There was no single thing it did dramatically better, but a lot of small subjective gains stacked up into a meaningful difference, and it was the fastest tyre here in the wet.
Wet Handling
Wet handling time in seconds [Average Temperature 12.5c]
Lower is better ↓Summer Tyres
| Tyre | Result | Gap to best |
|---|---|---|
| 91.07 s | Best | |
| 92.68 s | +1.61 s | |
| 95 s | +3.93 s | |
| 98.49 s | +7.42 s | |
| 104.74 s | +13.67 s |
All Season Tyres
| Tyre | Result | Gap to best |
|---|---|---|
| 96.14 s | Best | |
| 99.69 s | +3.55 s |
The difference between best and worst was 15% (13.67 s).
The two semi slicks are the ones worth dwelling on. The Cup 2 was actually quicker around the wet lap than the CrossClimate 3, which is remarkable for a tyre with that little tread, and the Cup 2 R was comfortably the slowest tyre in the test. On the Cup 2 R the end of the straight, at around 140 km/h, was a genuinely tense place to be. If you had put any real steering input in there it would have felt like pulling the handbrake, because you are skipping along the surface of the water rather than cutting through it.
That Cup 2 lap time needs a caveat. Read off the chart alone it suggests a Cup 2 and a CrossClimate 3 are about equally safe in the wet on the road, and they are not. Testing was done on a 15 to 16 degree day, which is warm for wet work, with a lot of energy going into the tyres lap after lap. At five degrees on a winter morning that compound will not be working. The conditions here flatter the semi slicks in the wet relative to normal road use.
Wet braking
Wet braking reorders things, and it reorders them in a way that makes the point of this whole test rather well.
The Pilot Sport 5 stopped shortest, just ahead of the Pilot Sport 4 S, with the Primacy 5 third. The CrossClimate 3 Sport was next, around seven percent shorter than the standard CrossClimate 3. Then comes the important inversion: the CrossClimate 3 out-brakes the Cup 2 in the wet, despite losing to it on the wet handling lap. Braking is where tread void and water evacuation matter most, and it is where a road tyre's advantage over a semi slick shows up most starkly.
The Cup 2 R needed 47.9 percent more distance than the Pilot Sport 5 to stop from the same speed. That is not a small number. It is very largely down to aquaplaning at the start of the braking run, before the tyre ever gets a chance to generate friction.
Wet Braking
Wet braking in meters [Average Temperature 12c]
Lower is better ↓Summer Tyres
| Tyre | Result | Gap to best |
|---|---|---|
| 26.2 m | Best | |
| 26.95 m | +0.75 m | |
| 27.63 m | +1.43 m | |
| 32.44 m | +6.24 m | |
| 38.74 m | +12.54 m |
All Season Tyres
| Tyre | Result | Gap to best |
|---|---|---|
| 29.06 m | Best | |
| 31.33 m | +2.27 m |
The difference between best and worst was 47.9% (12.54 m ≈ 2.8 Car Lengths).
Aquaplaning
Straight line aquaplaning resistance is the clearest illustration in this test of what tread depth and pattern buy you. The Pilot Sport 4 S and Pilot Sport 5 led, but the third best tyre here was the CrossClimate 3 Sport, ahead of both the Primacy 5 and the CrossClimate 3. An all season tyre beating a premium touring summer tyre at resisting standing water is not an upset if you think about it for a second, because the sipes and the open pattern that make it work in snow also give the water somewhere to go.
Straight Aqua
Float Speed in Km/H
Higher is better ↑Summer Tyres
| Tyre | Result | Gap to best |
|---|---|---|
| 80.77 km/h | Best | |
| 80 km/h | -0.77 km/h | |
| 78.18 km/h | -2.59 km/h | |
| 75.69 km/h | -5.08 km/h | |
| 74.27 km/h | -6.50 km/h |
All Season Tyres
| Tyre | Result | Gap to best |
|---|---|---|
| 79.33 km/h | Best | |
| 77.42 km/h | -1.91 km/h |
The difference between best and worst was 8% (6.5 Km/H).
The Cup 2 R was 8 percent down on the best in straight aquaplaning and 8.2 percent down in the curved test. What is worth noticing in the curved data is that once you get past the two Pilot Sports, which are clear of everything else, the remaining five tyres are separated by less than two percent. The two semi slicks sit at the bottom of that group, but only just: the Cup 2 R is 1.6 percent behind the Primacy 5 here, where in the straight test it was 5 percent behind it. Curved aquaplaning is the one wet test in this group where category barely predicts the answer.
Curved Aquaplaning
Remaining lateral acceleration
Higher is better ↑Summer Tyres
| Tyre | Result | Gap to best |
|---|---|---|
| 3.91 m/sec2 | Best | |
| 3.9 m/sec2 | -0.01 m/sec2 | |
| 3.65 m/sec2 | -0.26 m/sec2 | |
| 3.64 m/sec2 | -0.27 m/sec2 | |
| 3.59 m/sec2 | -0.32 m/sec2 |
All Season Tyres
| Tyre | Result | Gap to best |
|---|---|---|
| 3.63 m/sec2 | Best | |
| 3.6 m/sec2 | -0.03 m/sec2 |
The difference between best and worst was 8.2% (0.32 m/sec2).

Dry
Dry handling
A dry handling session covering everything from a semi slick to an all season produces a very wide spread of lap times, and the size of that spread is the point. The Cup 2 R was designed for this kind of circuit. The CrossClimate 3 was not.
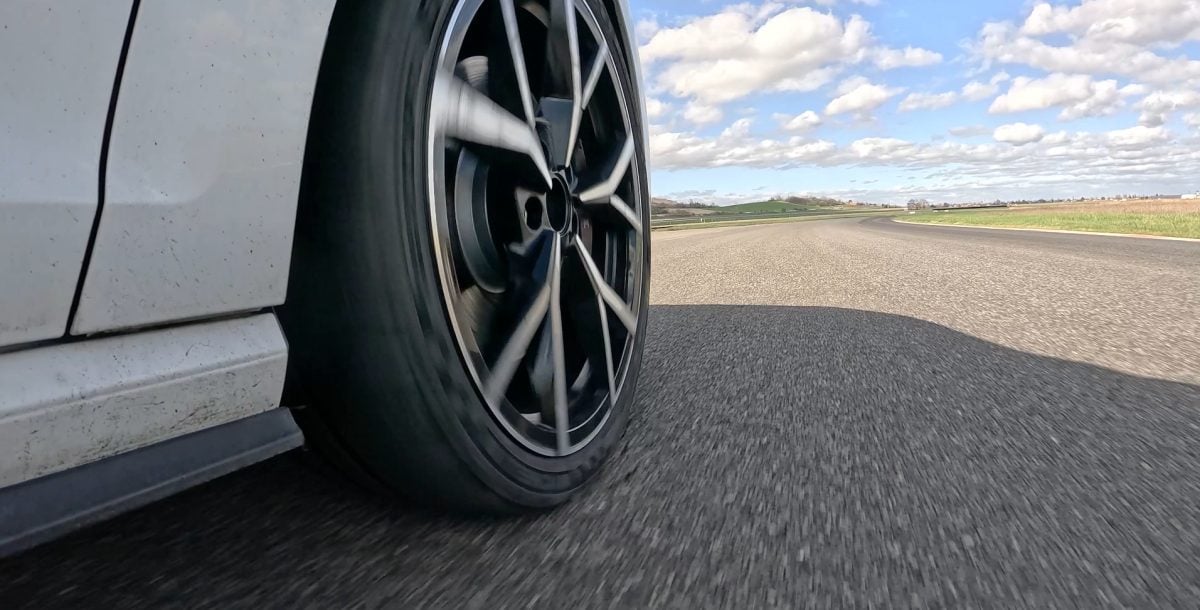
I actually started this day on a set of winter tyres for the winter half of this programme, so coming to the CrossClimate 3 it felt like a big step towards a summer tyre. More mid-corner stability, better steering reaction, more connection under braking and turning. It is still a tyre that likes understeer, but it is entirely predictable.
The Primacy 5 felt like a CrossClimate 3 with a stiffer tread pattern and more mid-corner grip, which makes sense given the bigger blocks and the extra rubber on the road. Soft on initial steering response, slightly bouncy, but stable and safe in the way Michelin touring tyres always are.
Then the case worth testing properly. Can a sporty all season tyre out-run a premium touring summer tyre on a dry circuit? Yes it can. The CrossClimate 3 Sport was half a second a lap quicker than the Primacy 5. It has what I have started calling Michelin's mid-corner magic, which sounds awful but is the best description I have got: as the tyre compresses and loads up you get more connection and more ability to steer, you get more tuck on lift off, and you feel more in control of where the car is going.
Dry Handling
Dry handling time in seconds [Average Temperature 13c]
Lower is better ↓Summer Tyres
| Tyre | Result | Gap to best |
|---|---|---|
| 72.12 s | Best | |
| 73.15 s | +1.03 s | |
| 74.69 s | +2.57 s | |
| 75.56 s | +3.44 s | |
| 76.72 s | +4.60 s |
All Season Tyres
| Tyre | Result | Gap to best |
|---|---|---|
| 76.18 s | Best | |
| 77.68 s | +1.50 s |
The difference between best and worst was 7.7% (5.56 s).
The Pilot Sport 5 was quicker still, but not by as much as I expected, at around six tenths. You can clearly hear the shared DNA in these products. The CrossClimate 3 and Primacy 5 belong to one family, and the CrossClimate 3 Sport and Pilot Sport 5 belong to another, and the family resemblance is stronger than the season split.
The Pilot Sport 4 S added another nine tenths, again through lots of small increments rather than one big change. It turns in a little quicker, tucks a little better, and that finally lets the rear axle of this Mk7.5 GTI join in, which is enjoyable.
The Cup 2 was a big jump, and the step from the Pilot Sport 4 S to the Cup 2 is roughly the same order as the step from the Primacy 5 to the Pilot Sport 4 S, a second and a half against two seconds. More steering response, more cornering grip, brakes that bite and pull you forward, and lap times that are both fast and consistent. If you have made a mess of the entry you can tap the brakes, lift, or add steering angle and the tyre will bail you out. It makes the Golf feel completely alive.
The Cup 2 R was faster again, and pulled more G both under braking and laterally, but the car started to complain. Out of the highest load right hander I was getting what I assume was fuel surge even on half a tank. I am not going to say the Cup 2 R is too much tyre for a Golf GTI, but the Golf said it for me. If you are tracking one of these, the Cup 2 is the sweet spot, and the Pilot Sport 4 S is a lot of tyre too when you consider how far ahead of both of them it is in the wet.
Dry braking
Two things move in dry braking compared to dry handling.
First, the Cup 2 jumps the Cup 2 R, by just under two percent. I think that is largely warm up. It was not a hot day and there is a long drive between braking runs, so neither semi slick ever really got into temperature. The Pilot Sport 4 S is effectively tied with the Cup 2 R here, which tells you how much of a semi slick's advantage is about sustained cornering load rather than a single stop.
Second, the Primacy 5 jumps the CrossClimate 3 Sport. This one is easy to explain. The CrossClimate 3 Sport is an outstanding all season tyre in the dry, one of the best, but it is difficult to control the load of a hard stop on a tread pattern and compound that also have to work in winter conditions. A summer tyre will win dry braking against its all season equivalent at pretty much any temperature you like.
Dry Braking
Dry braking in meters (100 - 5 km/h) [Average Temperature 15.5c]
Lower is better ↓Summer Tyres
| Tyre | Result | Gap to best | Residual speed |
|---|---|---|---|
| 32.18 m | Best | 0 km/h | |
| 32.82 m | +0.64 m | 18 km/h | |
| 32.86 m | +0.68 m | 19 km/h | |
| 34.09 m | +1.91 m | 31 km/h | |
| 35.31 m | +3.13 m | 39 km/h |
All Season Tyres
| Tyre | Result | Gap to best | Residual speed |
|---|---|---|---|
| 36.99 m | Best | 0 km/h | |
| 38.15 m | +1.16 m | 23 km/h |
The difference between best and worst was 18.6% (5.97 m ≈ 1.3 Car Lengths). From 130 km/h, the Michelin CrossClimate 3 would still be travelling at 51 km/h when the Michelin Pilot Sport Cup 2 had stopped.
Residual speed is calculated from the measured braking distances, assuming constant deceleration; it is not a separate measurement.
Snow
There is a dedicated winter video coming that compares all of Michelin's winter tyres, including the Alpins and the new X-Ice Snow Plus, so this is the short version.
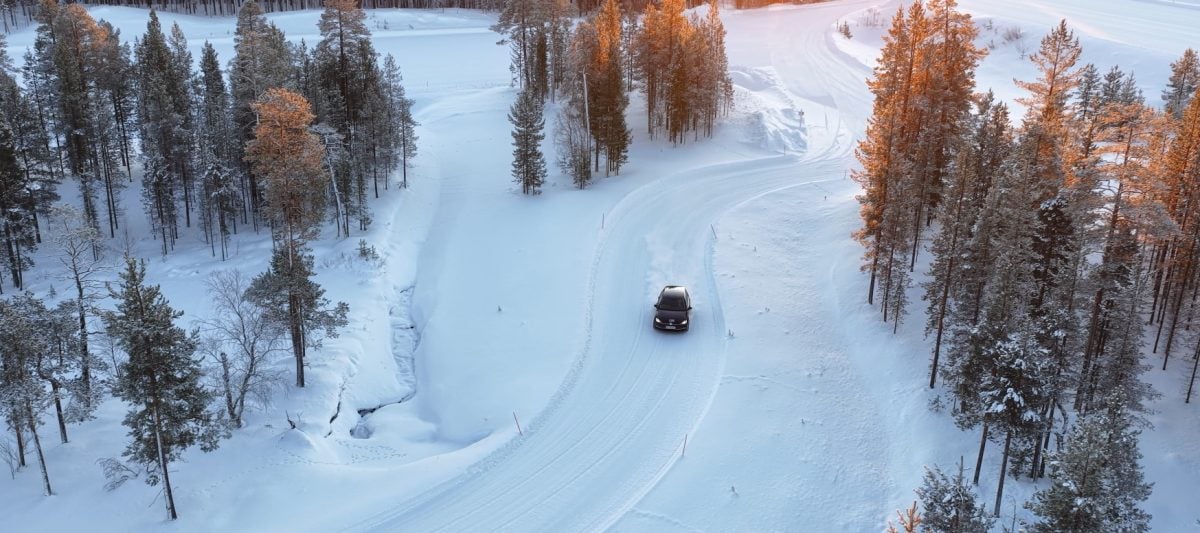
I only took one summer tyre to the snow, because there was no point shipping more than one. They were all going to behave the same way. The Primacy 5 went, and for a summer tyre it was actually not bad in the conditions, which is not the same as saying it was any good.
In snow braking the Primacy 5 needed over 30 metres where the CrossClimate 3 needed 16.5. That is 85 percent further. In snow traction it was more than twice as slow. Please do not use summer tyres in the snow.
Snow Braking
Snow braking in meters
Lower is better ↓Summer Tyres
| Tyre | Result | Gap to best |
|---|---|---|
| 30.54 m | — |
All Season Tyres
| Tyre | Result | Gap to best |
|---|---|---|
| 16.5 m | Best | |
| 17.63 m | +1.13 m |
The difference between best and worst was 85.1% (14.04 m ≈ 3.1 Car Lengths).
Snow Traction
Snow acceleration time
Lower is better ↓Summer Tyres
| Tyre | Result | Gap to best |
|---|---|---|
| 10.84 s | — |
All Season Tyres
| Tyre | Result | Gap to best |
|---|---|---|
| 5.08 s | Best | |
| 5.49 s | +0.41 s |
The difference between best and worst was 113.4% (5.76 s).
Snow handling is where the gap looks smaller on paper, at around 27 percent, but the number does not capture the experience. The 139 second lap on the Primacy 5 was treacherous, alarming and genuinely unpleasant. The CrossClimate 3 and CrossClimate 3 Sport were separated by just 1.6 seconds, which is a very good result for the sportier all season.
Snow Handling
Snow handling time in seconds
Lower is better ↓Summer Tyres
| Tyre | Result | Gap to best |
|---|---|---|
| 139.63 s | — |
All Season Tyres
| Tyre | Result | Gap to best |
|---|---|---|
| 110.17 s | Best | |
| 111.79 s | +1.62 s |
The difference between best and worst was 26.7% (29.46 s).
This is the reason the snow numbers belong in the same article as the dry and wet ones. The all season tyres are much further ahead of the summer tyre in winter conditions than the summer tyre is ahead of them in summer conditions. The CrossClimate 3 stops in 46 percent less distance than the Primacy 5 on snow. The Primacy 5 stops in around 7 percent less distance than the CrossClimate 3 in the dry, and around 12 percent less in the wet. The penalty for being on the wrong tyre in winter is an order of magnitude larger than the penalty for being on an all season tyre in summer. That is worth keeping in mind when you are shopping.
Rolling resistance
The efficiency data is fascinating, at least to me.
The Primacy 5 had the lowest rolling resistance by a clear margin, which is no surprise at all. It is the thing Michelin focused on with that tyre, and it is meant to be efficient and long lasting.
The CrossClimate 3 Sport was second, slightly ahead of the CrossClimate 3, which is partly down to the Sport having a lower starting tread depth. The two are close enough that you will not notice a difference between them in any real use.
Rolling Resistance
Rolling resistance in kg t
Lower is better ↓Summer Tyres
| Tyre | Result | Gap to best | Extra fuel / year |
|---|---|---|---|
| 7.14 kg/t | Best | £0 | |
| 8.57 kg/t | +1.43 kg/t | £88 | |
| 8.86 kg/t | +1.72 kg/t | £106 | |
| 9.31 kg/t | +2.17 kg/t | £134 | |
| 9.57 kg/t | +2.43 kg/t | £150 |
All Season Tyres
| Tyre | Result | Gap to best | Extra fuel / year |
|---|---|---|---|
| 7.68 kg/t | Best | £33 | |
| 8.09 kg/t | +0.41 kg/t | £59 |
The difference between best and worst was 34% (2.43 kg / t). Over 19,000 km a year at £1.45/L, the Michelin Pilot Sport Cup 2 R uses about 103 L (£150) more fuel than the Michelin Primacy 5.
Adjust the assumptions
Calculated estimates, not additional measurements. Use the controls to explore the assumptions.
After that it goes exactly as you would expect, with every step up in sportiness costing efficiency. The Cup 2 R having the highest rolling resistance of all did surprise me at first glance, given how little tread pattern it has, until I remembered it is the 19 inch tyre in this test and it is slightly wider, both of which matter a lot. And it is a Cup 2 R. Nobody buying that tyre is trading grip for economy.
Comfort and noise
I did not run an instrumented comfort test here, so there is no chart for this, but I was assessing comfort and noise constantly while driving around the proving ground and I do not think the results will shock anyone.
The Primacy 5 and the CrossClimate 3 were the most comfortable and the quietest, and importantly they are very comparable to each other. You are not giving up meaningful comfort or noise when you switch from the premium touring summer tyre to the premium all season tyre. The Pilot Sport 5 was not far behind and had the best steering feel on the road of anything here. The Cup 2 and Cup 2 R were clearly the worst, with the Cup 2 R noticeably harsh over impacts, which is exactly what you sign up for.
So can the CrossClimate 3 Sport replace the Pilot Sport 5?
The short answer is yes, but no. Probably.
If you are an enthusiast driver, I would not swap your Pilot Sport 4 S or your Pilot Sport 5 for a CrossClimate 3 Sport. Even the best sporty all season tyres cannot yet match the feel you get from a summer tyre, and honestly I do not think they ever will. It is a design limitation of having to work in winter. The data backs that up: the Pilot Sport 5 brakes around 10 percent shorter in the wet, around 8 percent shorter in the dry, and is quicker on both handling laps.
But if you are an enthusiast driver, I would absolutely recommend the CrossClimate 3 Sport as your winter tyre across a lot of Europe. It is a lot of fun for an all season, though the Pilot Alpin 5 is also excellent and there will be more on that in the winter video.
And if you are someone who enjoys driving a performance car without regularly pushing the limit, and you do not want to change tyres twice a year, the CrossClimate 3 Sport does a very good job of giving back some of the fizz you normally lose when you move to an all season tyre. I can see a lot of people being genuinely happy running one on something like a 340i or an S4 all year round, and valuing the convenience a great deal.
If you have questions about any other combination in this range, ask in the comments on the video and I will answer them there.
Summer Tyres
Michelin Primacy 5
225/40 R18 92Y XL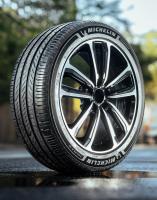
All discipline results (10)
Discipline positions compare the ranked tyres in this test, not the whole market. These are individual measurements, not weighted overall scores.
| Test | Result |
|---|---|
| Dry BrakingLower is better | 35.31 m |
| Dry HandlingLower is better | 76.72 s |
| Wet BrakingLower is better | 27.63 m |
| Wet HandlingLower is better | 95 s |
| Straight AquaHigher is better | 78.18 km/h |
| Curved AquaplaningHigher is better | 3.65 m/sec2 |
| Snow BrakingLower is better | 30.54 m |
| Snow TractionLower is better | 10.84 s |
| Snow HandlingLower is better | 139.63 s |
| Rolling ResistanceLower is better | 7.14 kg/t |
Michelin Pilot Sport 4 S
225/40 R18 92Y XL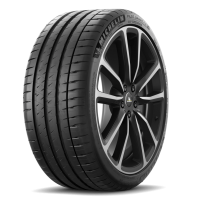
All discipline results (7)
Discipline positions compare the ranked tyres in this test, not the whole market. These are individual measurements, not weighted overall scores.
| Test | Result |
|---|---|
| Dry BrakingLower is better | 32.86 m |
| Dry HandlingLower is better | 74.69 s |
| Wet BrakingLower is better | 26.95 m |
| Wet HandlingLower is better | 91.07 s |
| Straight AquaHigher is better | 80.77 km/h |
| Curved AquaplaningHigher is better | 3.91 m/sec2 |
| Rolling ResistanceLower is better | 8.86 kg/t |
Michelin Pilot Sport Cup 2
225/40 R18 92Y XL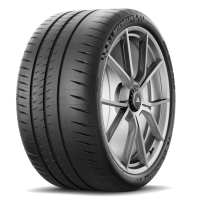
All discipline results (7)
Discipline positions compare the ranked tyres in this test, not the whole market. These are individual measurements, not weighted overall scores.
| Test | Result |
|---|---|
| Dry BrakingLower is better | 32.18 m |
| Dry HandlingLower is better | 73.15 s |
| Wet BrakingLower is better | 32.44 m |
| Wet HandlingLower is better | 98.49 s |
| Straight AquaHigher is better | 75.69 km/h |
| Curved AquaplaningHigher is better | 3.64 m/sec2 |
| Rolling ResistanceLower is better | 9.31 kg/t |
Michelin Pilot Sport Cup 2 R
225/40 R18 92Y XL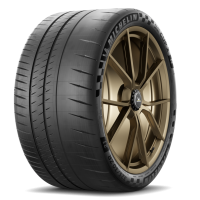
All discipline results (7)
Discipline positions compare the ranked tyres in this test, not the whole market. These are individual measurements, not weighted overall scores.
| Test | Result |
|---|---|
| Dry BrakingLower is better | 32.82 m |
| Dry HandlingLower is better | 72.12 s |
| Wet BrakingLower is better | 38.74 m |
| Wet HandlingLower is better | 104.74 s |
| Straight AquaHigher is better | 74.27 km/h |
| Curved AquaplaningHigher is better | 3.59 m/sec2 |
| Rolling ResistanceLower is better | 9.57 kg/t |
Michelin Pilot Sport 5
225/40 R18 92Y XL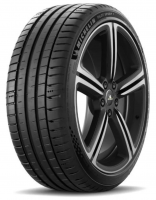
All discipline results (7)
Discipline positions compare the ranked tyres in this test, not the whole market. These are individual measurements, not weighted overall scores.
| Test | Result |
|---|---|
| Dry BrakingLower is better | 34.09 m |
| Dry HandlingLower is better | 75.56 s |
| Wet BrakingLower is better | 26.2 m |
| Wet HandlingLower is better | 92.68 s |
| Straight AquaHigher is better | 80 km/h |
| Curved AquaplaningHigher is better | 3.9 m/sec2 |
| Rolling ResistanceLower is better | 8.57 kg/t |
All Season Tyres
Michelin CrossClimate 3
225/40 R18 92W XL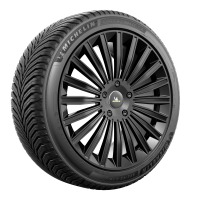
All discipline results (10)
Discipline positions compare the ranked tyres in this test, not the whole market. These are individual measurements, not weighted overall scores.
| Test | Result |
|---|---|
| Dry BrakingLower is better | 38.15 m |
| Dry HandlingLower is better | 77.68 s |
| Wet BrakingLower is better | 31.33 m |
| Wet HandlingLower is better | 99.69 s |
| Straight AquaHigher is better | 77.42 km/h |
| Curved AquaplaningHigher is better | 3.6 m/sec2 |
| Snow BrakingLower is better | 16.5 m |
| Snow TractionLower is better | 5.08 s |
| Snow HandlingLower is better | 110.17 s |
| Rolling ResistanceLower is better | 8.09 kg/t |
- 3PMSF
- Yes
Michelin CrossClimate 3 Sport
225/40 R18 92Y XL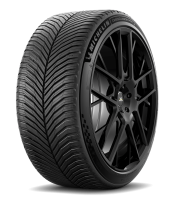
All discipline results (10)
Discipline positions compare the ranked tyres in this test, not the whole market. These are individual measurements, not weighted overall scores.
| Test | Result |
|---|---|
| Dry BrakingLower is better | 36.99 m |
| Dry HandlingLower is better | 76.18 s |
| Wet BrakingLower is better | 29.06 m |
| Wet HandlingLower is better | 96.14 s |
| Straight AquaHigher is better | 79.33 km/h |
| Curved AquaplaningHigher is better | 3.63 m/sec2 |
| Snow BrakingLower is better | 17.63 m |
| Snow TractionLower is better | 5.49 s |
| Snow HandlingLower is better | 111.79 s |
| Rolling ResistanceLower is better | 7.68 kg/t |
- 3PMSF
- Yes
He is to far behind in dry and wet. How to ignore the safety issues? It’s not about sporty feeling but pure safety he lacks.
The cc 3 sport is nearly perfect - but not available in many important sizes.
I will buy Conti or Goodyear over the cc3. I wish I had a real
Choice.