



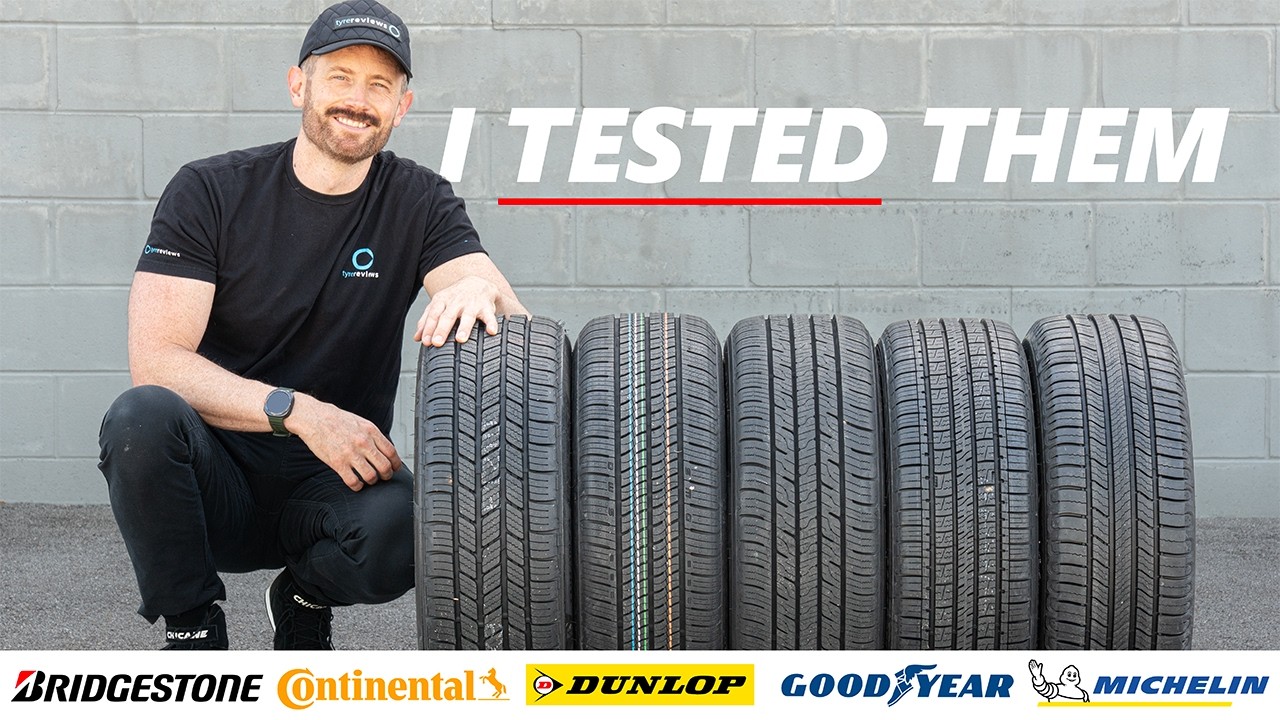
These are five premium all season tyres built for the North American touring market, and with warranties running from 70,000 to 85,000 miles in this size they are all asking you to fit a set and forget about them for years. The question I wanted to answer is whether any of them have quietly given something up to make that number work.
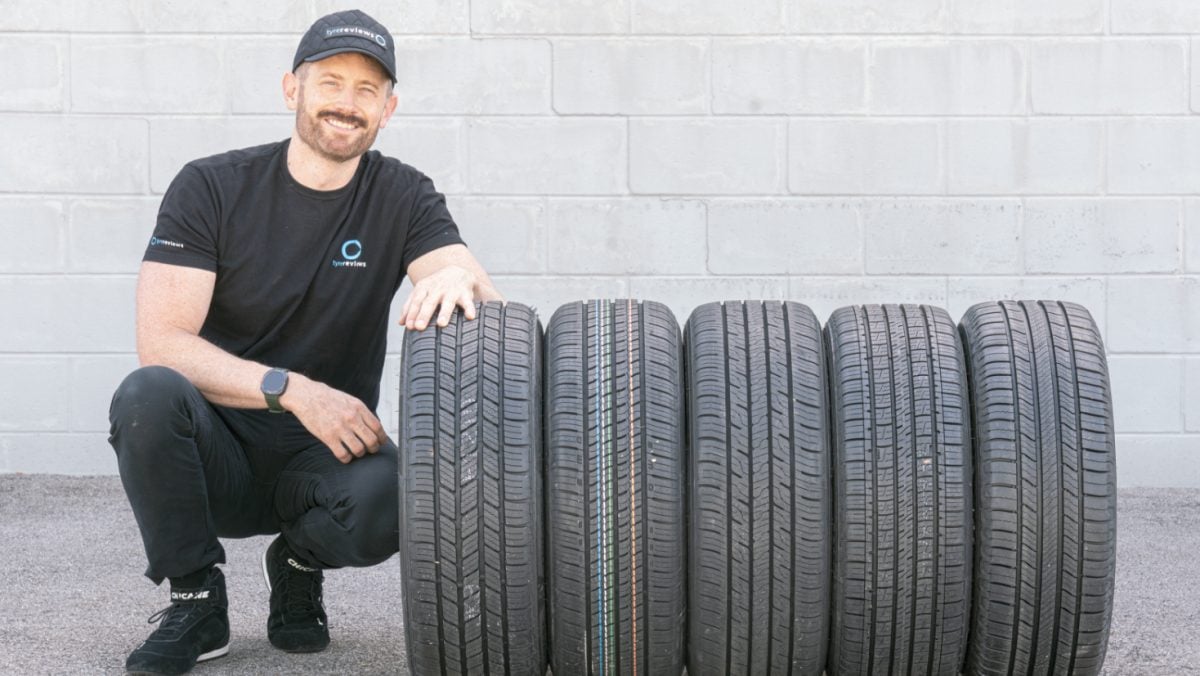
The five are the Bridgestone Turanza EverDrive, the Continental TrueContact Tour 54, the new Dunlop Blue Response A/S, the Goodyear Assurance MaxLife 2 and the Michelin Defender 2, all in 215/55 R17 and all fitted to a Toyota Camry. Dry and wet testing was run at the proving ground in Alabama, and every tyre was scored on dry braking, dry handling, wet braking, wet handling, straight aquaplaning, snow braking, snow traction, comfort, noise, rolling resistance and cost per 1,000 warranted miles.
Test setup & methodology
The test setting, the conditions recorded and how the results contribute to the score.
- Tyre Pressures (as recorded)
- 35
- Test Driver
- Jonathan Benson
Show full testing methodology
Recorded test conditions
- Dry Braking
- 96 → 0 km/h
- Dry Handling
- 22–26 °C
- Wet Braking
- 96 → 0 km/h · 22–23 °C
- Wet Handling
- 26–28 °C
- Snow Braking
- 40 → 20 km/h
Score Weighting
Weights express the scoring priorities, not how much each discipline actually changed the finishing order. The size of the performance gaps matters too. Category weights contribute to the overall score. Within each category, discipline weights divide that category’s share. Published finishing positions also need to be read alongside the editorial verdict.
| Test | Within category | Share of overall score |
|---|---|---|
| Dry · 35% | ||
| Dry Braking | 50% | 17.5% |
| Dry Handling | 40% | 14% |
| Subj. Dry Handling | 10% | 3.5% |
| Wet · 40% | ||
| Wet Braking | 50% | 20% |
| Wet Handling | 40% | 16% |
| Subj. Wet Handling | 5% | 2% |
| Straight Aqua | 5% | 2% |
| Snow · 10% | ||
| Snow Braking | 50% | 5% |
| Snow Traction | 50% | 5% |
| Comfort · 10% | ||
| Subj. Comfort | 50% | 5% |
| Noise | 50% | 5% |
| Value · 5% | ||
| Value | 100% | 5% |
Our standard methods
The conditions above are recorded for this test. The descriptions below explain our standard procedures; measurement windows and run counts can vary by test.
Dry Braking
For dry braking, I drive the test vehicle at an entry speed of 110 km/h and apply full braking effort to a standstill with ABS active on clean, dry asphalt. I typically use an 100–5 km/h measurement window. My standard programme is five runs per tyre set where possible, although the sequence can extend to as many as fifteen runs if conditions and tyre category justify it. I analyse the full set of runs and discard statistical outliers before averaging. Reference tyres are run repeatedly throughout the session to correct for changing conditions.
Dry Handling
For dry handling, I drive at the limit of adhesion around a dedicated handling circuit with ESC disabled where possible so I can assess the tyre's natural balance, transient response, and limit behaviour without electronic intervention masking the result. I usually complete between two and five timed laps per tyre set, depending on the circuit, tyre type, and consistency of conditions. I exclude laps affected by clear driver error or obvious environmental inconsistency. Control runs are carried out frequently throughout the session, and I often use multiple sets of control tyres so that wear on the references does not become a meaningful variable. For more track-focused products, I also do endurance testing, which is a set number of laps at race pace to determine tire wear patterns and heat resistance over longer driving.
Subj. Dry Handling
I also carry out a structured subjective handling assessment at the limit of adhesion on a dedicated dry handling circuit. I score steering precision, steering response, turn-in behaviour, mid-corner balance, corner-exit traction, breakaway characteristics, and overall confidence using a standardised 1–10 scale used consistently across my testing. The final assessment combines numeric scoring with written technical commentary. I complete familiarisation laps on the control tyre before evaluating each candidate.
Wet Braking
For wet braking, I drive the test vehicle at an entry speed of 88 km/h and apply full braking effort to a standstill with ABS active on an asphalt surface with a controlled water film. I typically use an 80–5 km/h measurement window to isolate tyre performance from variability in the initial brake application. My standard programme is eight runs per tyre set where possible, although the sequence can extend to as many as fifteen runs if conditions and tyre category justify it. I analyse the full set of runs and discard statistical outliers before averaging. To correct for changing conditions, I run reference tyres repeatedly throughout the session — in wet testing, typically every three candidate test sets.
Wet Handling
For wet handling, I drive at the limit of adhesion around a dedicated handling circuit. I generally use specialist wet circuits with kerb-watering systems designed to maintain a consistent surface condition. ESC is disabled where possible so I can assess the tyre's natural balance, transient response, and limit behaviour without electronic intervention masking the result. I usually complete between two and five timed laps per tyre set, depending on the circuit, tyre type, and consistency of conditions. I exclude laps affected by clear driver error or obvious environmental inconsistency. Control runs are carried out frequently throughout the session, and I often use multiple sets of control tyres so that wear on the references does not become a meaningful variable.
Subj. Wet Handling
I also carry out a structured subjective handling assessment at the limit of adhesion on a dedicated wet handling circuit. I score steering precision, steering response, turn-in behaviour, mid-corner balance, aquaplaning resistance, breakaway characteristics, and overall confidence using a standardised 1–10 scale used consistently across my testing. The final assessment combines numeric scoring with written technical commentary. I complete familiarisation laps on the control tyre before evaluating each candidate.
Straight Aqua
To measure straight-line aquaplaning resistance, I drive one side of the vehicle through a water trough of controlled depth, typically around 7 mm, while the opposite side remains on dry pavement. I enter at a fixed speed and then accelerate progressively. I define aquaplaning onset as the point at which the wheel travelling through the water exceeds a specified slip threshold relative to the dry-side reference wheel. I usually perform four runs per tyre set and average the valid results.
Snow Braking
For snow braking, I drive the test vehicle at an entry speed of 50 km/h and apply full braking effort to a standstill with ABS active on a groomed, compacted snow surface, measuring 45-5 km/h. I generally use a wide VDA (vehicle dynamic area) and progressively move across the surface between runs so that no tyre ever brakes on the same piece of snow twice. My standard programme is twelve runs per tyre set, although the sequence can extend further if the data justify it. I analyse the full set of runs and discard statistical outliers before averaging. The surface is regularly groomed throughout the session. To correct for changing snow surface conditions, I run reference tyres repeatedly — typically every two candidate test sets.
Snow Traction
For snow traction, I accelerate the vehicle from rest on a groomed snow surface with traction control active and measure speed and time using GPS telemetry. I typically use a 5–35 km/h measurement window to reduce the influence of launch transients and powertrain irregularities. I use a wide VDA (vehicle dynamic area) and progressively move across the surface between runs so that no tyre ever accelerates on the same piece of snow twice. The surface is regularly groomed throughout the session. I complete multiple runs per tyre set and average the valid results. Reference tyres are run typically every two candidate test sets to correct for changing snow surface conditions.
Subj. Comfort
To assess comfort, I drive on a wide range of road surfaces (often dedicated comfort tracks at test facilities) at speeds from 50 to 120 km/h, including smooth motorway, coarse surfaces, expansion joints, broken pavement, and sharp-edged obstacles. I evaluate primary ride quality, secondary ride quality, impact harshness, seat-transmitted vibration, and the tyre's ability to absorb sharp inputs. Ratings are assigned on a 1–10 scale relative to the reference tyre.
Noise
For cabin noise assessment, I drive at controlled speeds, typically 50, 80, 100, and 120 km/h, on NVH test surfaces with defined texture characteristics. Calibrated microphones are positioned at ear height within the cabin. Measurements are taken using A-weighting, with one-third octave analysis where required to identify tonal features such as cavity resonance. Windows remain closed, ventilation is off, and ambient conditions are controlled so the data reflects the tyre rather than external interference.
Rolling Resistance
Rolling resistance is measured under controlled laboratory conditions in accordance with ISO 28580 and UNECE Regulation 117 Annex 6. The tyre is mounted on a test wheel and loaded against a large-diameter steel drum. After thermal stabilisation at the prescribed test speed, rolling resistance force is measured at the spindle and corrected according to the relevant procedure. The result is expressed as rolling resistance coefficient, typically in kg/tonne.
One important note on the snow data before we start. I did not generate it. It comes from Dunlop's own internal benchmarking, run last year, well before this test was discussed with me. I have included it because it is the only snow data that exists for these five tyres together, but it is not my data and you are free to treat it accordingly. If you would rather it played no part in the outcome, set the snow weighting to zero in the results table. My default weighting prioritises dry and wet performance over snow.
Dry Braking
The Dunlop Blue Response A/S was the standout in dry braking at 38.1 metres, roughly 5% shorter than the Goodyear and Continental, which were all but inseparable. The Bridgestone Turanza EverDrive was last and not by a small margin, needing 42.9 metres, around 12% more than the Dunlop. Scaled up to a motorway stop from 130 km/h, you would still be carrying about 43 km/h on the Bridgestone at the moment the car on the Dunlop had come to a complete stop.
Dry Braking
Dry braking in meters (96 - 0 km/h)
Lower is better ↓| Position / Tyre | Result | Gap to best | Residual speed |
|---|---|---|---|
| 38.1 m | Best | 0 km/h | |
| 40.1 m | +2.00 m | 29 km/h | |
| 40.2 m | +2.10 m | 30 km/h | |
| 40.4 m | +2.30 m | 31 km/h | |
| 42.9 m | +4.80 m | 43 km/h |
The difference between best and worst was 12.6% (4.8 m ≈ 1.1 Car Lengths). From 130 km/h, the Bridgestone Turanza EverDrive would still be travelling at 43 km/h when the Dunlop Blue Response AS had stopped.
Residual speed is calculated from the measured braking distances, assuming constant deceleration; it is not a separate measurement.
Dry Handling
The Continental TrueContact Tour 54 set the fastest dry lap at 44.04 seconds, with the Goodyear a tenth behind and the entire field covered by 0.73 seconds. I will be straight with you: this is the least relevant test in the programme for a high mileage all season tyre, which is why it carries very little weight in the scoring. If you want to be the quickest driver at your local track day on a set of touring tyres, the answer is the Continental and then the Goodyear, but that is not what anybody buys these for.
Dry Handling
Dry handling time in seconds [Average Temperature 24c]
Lower is better ↓| Position / Tyre | Result | Gap to best |
|---|---|---|
| 44.04 s | Best | |
| 44.15 s | +0.11 s | |
| 44.53 s | +0.49 s | |
| 44.66 s | +0.62 s | |
| 44.77 s | +0.73 s |
All the tyres in the Dry Handling test finished less than 3% apart.
Subjective Dry Handling
What matters far more in this category is how a tyre behaves in the small inputs and in the emergency ones, which is what the subjective scoring covers. The Continental was the best of the five: neutral, predictable turn-in, strong lateral grip and the least drama from the rear axle when I provoked it with a high effort lane change. The Dunlop was very close behind with the same calm character.
The Michelin Defender 2 has the sharpest, crispest steering here, and that is genuinely enjoyable, but the extra front end response is exactly what costs it in this test: ask a lot of the front axle in an avoidance manoeuvre and the rear comes round more than it does on the Continental or Dunlop. The Goodyear sits at the other end of that trade. It is the softest off centre and the slowest to build turning force, which I am not especially fond of, but once the steering angle is in it is stable and unflustered. The Bridgestone was last of the five, lacking a little cornering stability and taking longer to recover once it had let go.
Subj. Dry Handling
Subjective Dry Handling Score
Higher is better ↑| Position / Tyre | Result | Gap to best |
|---|---|---|
| 8.5 Points | Best | |
| 8.4 Points | -0.10 Points | |
| 8.3 Points | -0.20 Points | |
| 8.2 Points | -0.30 Points | |
| 8.1 Points | -0.40 Points |
The difference between best and worst was 4.7% (0.4 Points).
Wet Braking
The Continental was the best in test again at 48.1 metres, with the Goodyear just under 1 metre behind it. The Dunlop was third, and then the Michelin Defender 2 climbed above the Bridgestone, which finished last at 53.7 metres - 5.6 metres, or more than a car length, adrift of the Continental. That result is not a surprise given how the Bridgestone felt on the wet handling course: it never had the outright compound grip of the tyres in front of it.
Wet Braking
Wet braking in meters (96 - 0 km/h) [Average Temperature 22.5c]
Lower is better ↓| Position / Tyre | Result | Gap to best | Residual speed |
|---|---|---|---|
| 48.1 m | Best | 0 km/h | |
| 49 m | +0.90 m | 18 km/h | |
| 50.5 m | +2.40 m | 28 km/h | |
| 51.6 m | +3.50 m | 34 km/h | |
| 53.7 m | +5.60 m | 42 km/h |
The difference between best and worst was 11.6% (5.6 m ≈ 1.2 Car Lengths). From 130 km/h, the Bridgestone Turanza EverDrive would still be travelling at 42 km/h when the Continental TrueContact Tour 54 had stopped.
Residual speed is calculated from the measured braking distances, assuming constant deceleration; it is not a separate measurement.
Wet Handling
I run wet handling twice whenever conditions allow, and I did here. The Continental TrueContact Tour 54 was the quickest tyre both times at 50.32 seconds and it was also the one I enjoyed most. It is not a difficult tyre to drive and it never surprises you. Whether you are accelerating, braking or turning, or asking for all three at once, it simply does what you asked without fuss and with real grip behind it.
The Goodyear Assurance MaxLife 2 was second, and it got there in a completely different way. It is the least sporty tyre in the test, slower to react and slower to build turning forces, but its mid-corner grip and stability were excellent. Where other tyres were lifting and skating through the deeper standing water on the course, the Goodyear just carried on. It gave me no surprises anywhere and I liked it a lot for that.
The Dunlop and Bridgestone were separated by a couple of tenths and traded places between the two sessions, with the Dunlop a fraction ahead on average. They arrived at almost the same lap time from opposite directions: the Dunlop had the better compound grip but weaker resistance to standing water, while the Bridgestone was the reverse, happier in the deeper puddles but without the same bite on wet asphalt.
The Michelin was the slowest here, though only by a tenth from the Bridgestone. Its steering is direct and crisp and that flatters it initially, but it does not have the lateral grip to back that up. Push into a corner and it understeers, and it takes a long time for the front to come back as you lift. There is also a little more oversteer than the rest of this field will give you, which is close to a miracle in a Camry, and it arrives slightly more quickly than I would like.
Wet Handling
Wet handling time in seconds [Average Temperature 27c]
Lower is better ↓| Position / Tyre | Result | Gap to best |
|---|---|---|
| 50.32 s | Best | |
| 50.77 s | +0.45 s | |
| 51.87 s | +1.55 s | |
| 52.07 s | +1.75 s | |
| 52.17 s | +1.85 s |
The difference between best and worst was 3.7% (1.85 s).
Straight Aquaplaning
A complete flip of the wet handling order. The Michelin Defender 2 was the best in test here by more than 2 km/h, floating at 66.65 km/h, with the Bridgestone second and the Continental third. The Dunlop was last and it was not close, nearly 6.3 km/h behind the Michelin - the single clearest weakness of an otherwise very well rounded tyre, and worth knowing about if your commute involves standing water.
Straight Aqua
Float Speed in Km/H
Higher is better ↑| Position / Tyre | Result | Gap to best |
|---|---|---|
| 66.65 km/h | Best | |
| 64.52 km/h | -2.13 km/h | |
| 63.48 km/h | -3.17 km/h | |
| 63.05 km/h | -3.60 km/h | |
| 60.39 km/h | -6.26 km/h |
The difference between best and worst was 9.4% (6.26 Km/H).

Snow Braking
As above, this data is Dunlop's, not mine. The Bridgestone Turanza EverDrive was comfortably the best of the five at 14.7 metres, around 9% shorter than the Dunlop in second. The Continental was third, and the Michelin and Goodyear were the two weakest, with the Goodyear last.
Snow Braking
Snow braking in meters (40 - 20 km/h)
Lower is better ↓| Position / Tyre | Result | Gap to best | Residual speed |
|---|---|---|---|
| 14.7 m | Best | 0 km/h | |
| 16 m | +1.30 m | 37 km/h | |
| 16.6 m | +1.90 m | 44 km/h | |
| 17.7 m | +3.00 m | 54 km/h | |
| 18 m | +3.30 m | 56 km/h |
The difference between best and worst was 22.4% (3.3 m ≈ 0.7 Car Lengths). From 130 km/h, the Goodyear Assurance MaxLife 2 would still be travelling at 56 km/h when the Bridgestone Turanza EverDrive had stopped.
Residual speed is calculated from the measured braking distances, assuming constant deceleration; it is not a separate measurement.
Snow Traction
The Bridgestone's advantage is even bigger in traction, where it was nearly 18% quicker than the Dunlop in second. That is not a small gap between two tyres in the same category, it is close to being a different category of tyre altogether. Bridgestone have arguably over engineered the snow performance of the EverDrive, and North American Bridgestone products have leaned this way before, but the result speaks for itself: if you run all season tyres in a genuinely snowy climate, this is the logical choice of the five. If you really need to drive in snow, buy a winter tyre.
The Goodyear was last, about 26% behind the Bridgestone. That headline number makes it look worse than it is, because the Bridgestone is such an outlier - the gap back to the Continental and Michelin is far smaller. Snow is still the Goodyear's clear weakness and it does need improving, but it is not the disaster the top-to-bottom spread implies.
Snow Traction
Snow acceleration time
Lower is better ↓| Position / Tyre | Result | Gap to best |
|---|---|---|
| 3.55 s | Best | |
| 4.32 s | +0.77 s | |
| 4.54 s | +0.99 s | |
| 4.66 s | +1.11 s | |
| 4.82 s | +1.27 s |
The difference between best and worst was 35.8% (1.27 s).
Comfort
The Continental and Goodyear shared the highest comfort score, with the Dunlop just behind and the Michelin and Bridgestone tied at the back. Over the sharper impact strips the Goodyear was the one I would choose, and if you have been paying attention to the handling sections that will make sense: the same softness that blunts its steering response is what lets it absorb a harsh edge better than anything else here. The Bridgestone was the firmest of the five.
Subj. Comfort
Subjective Comfort Score
Higher is better ↑| Position / Tyre | Result | Gap to best |
|---|---|---|
| 10 Points | Best | |
| 10 Points | Best | |
| 9.5 Points | -0.50 Points | |
| 9 Points | -1.00 Points | |
| 9 Points | -1.00 Points |
The difference between best and worst was 10% (1 Points).
Noise
Measured noise was effectively a dead heat. The Dunlop was quietest at 63.5 dB and the Michelin loudest at 64.0 dB, a spread of half a decibel that no driver is going to identify from the seat. Subjective noise is harder to judge than a meter reading because it is about pitch as much as volume, and on that basis the Goodyear was my pick across the various surfaces I drove, with the Continental and Dunlop close behind, the Michelin a small step back and the Bridgestone last. None of them are loud tyres. It is just that if a serene, smooth cabin is your priority, the Goodyear delivers it more completely than the rest.
Noise
Internal noise in dB
Lower is better ↓| Position / Tyre | Result | Gap to best |
|---|---|---|
| 63.5 dB | Best | |
| 63.8 dB | +0.30 dB | |
| 63.9 dB | +0.40 dB | |
| 63.9 dB | +0.40 dB | |
| 64 dB | +0.50 dB |
All the tyres in the Noise test finished less than 3% apart.
Value
Value here is the cost per 1,000 warranted miles, using current pricing from Tire Rack and each tyre's actual treadwear warranty in this size. The Dunlop comes out best at $2.24, with the Goodyear second on the strength of the longest warranty in the test at 85,000 miles. The Michelin Defender 2 is last, simply because it is the most expensive tyre here to buy. The Continental is fourth despite being, alongside the Dunlop, the cheapest of the five, because this 215/55 R17 is V rated and carries a 70,000 mile warranty rather than the 80,000 miles Continental warrant on the T and H rated sizes. Best to worst covers about 17%, so this is a metric worth knowing about but not one that should override how a tyre actually performs. If you watched the video, those figures were run on a flat 80,000 mile warranty for all five, which flattered the Continental, and on the prices at the time; the numbers here use current pricing and each tyre's real warranty in this size.
Value
Dollars/1000 miles based on mileage warranty
Lower is better ↓| Position / Tyre | Result | Gap to best | cost per 1,000 miles |
|---|---|---|---|
| 2.24 Price/1000 | Best | $10.97 | |
| 2.27 Price/1000 | +0.03 Price/1000 | $12.27 | |
| 2.47 Price/1000 | +0.23 Price/1000 | $11.11 | |
| 2.56 Price/1000 | +0.32 Price/1000 | $11.37 | |
| 2.62 Price/1000 | +0.38 Price/1000 | $13.08 |
The difference between best and worst was 17% (0.38 Price/1000). Over 25,000 miles the cheapest tyre to own (Dunlop Blue Response AS) works out $53 cheaper than the most expensive (Michelin Defender 2).
How this is calculated
Tyre life here is the manufacturer's treadwear warranty, NOT measured wear - treat it as the maker's promise, not a test result.
Tyre life is the manufacturer's treadwear warranty, not measured wear. Assumes a typical car using 8 l/100km (rolling resistance causing 20% of fuel use), fuel at $0.95 per litre and $80 fitting per set of four. US prices are from the time of the 2026 test; financing costs are excluded.
Rolling Resistance
The Continental TrueContact Tour 54 has the lowest rolling resistance of the five at 8.18 kg/t, with the Bridgestone Turanza EverDrive close enough behind on 8.25 to call it a tie. Then come the Dunlop on 8.52 and the Michelin Defender 2 on 8.71, and the Goodyear Assurance MaxLife 2 is last at 8.93, roughly 9% more than the Continental. This deserves more attention than usual here, because the value figures above only count what you hand over at the counter, and on a tyre you are being asked to keep for 70,000 miles or more the fuel bill is the other half of the running cost.
Rolling Resistance
Rolling resistance in kg t
Lower is better ↓| Position / Tyre | Result | Gap to best | Extra fuel / year |
|---|---|---|---|
| 8.18 kg/t | Best | £0 | |
| 8.25 kg/t | +0.07 kg/t | £4 | |
| 8.52 kg/t | +0.34 kg/t | £18 | |
| 8.71 kg/t | +0.53 kg/t | £29 | |
| 8.93 kg/t | +0.75 kg/t | £40 |
The difference between best and worst was 9.2% (0.75 kg / t). Over 19,000 km a year at £1.45/L, the Goodyear Assurance MaxLife 2 uses about 28 L (£40) more fuel than the Continental TrueContact Tour 54.
Adjust the assumptions
Calculated estimates, not additional measurements. Use the controls to explore the assumptions.
Results
The Continental TrueContact Tour 54 wins this test, and it wins it in classic Continental fashion: best in test in wet braking, wet handling and subjective wet handling, fastest around the dry handling lap, and joint best for comfort. It could not match the Bridgestone in the snow, but it was third of five in both snow tests, and while the short warranty on this size drops it to fourth on cost per warranted mile, it is as cheap as anything here to buy in the first place. If you want one tyre that is excellent at everything that happens on a road, this is it.
The Dunlop Blue Response A/S is second and it is a very impressive first all season touring tyre from Dunlop under Sumitomo. It was best in test for dry braking, the quietest tyre on the meter, strong subjectively in both wet and dry, and the best of the rest in the snow behind the Bridgestone. Its only real weakness is straight aquaplaning, where it was last. I have no hesitation recommending it.
The Goodyear Assurance MaxLife 2 takes third with some of the best wet braking, wet handling and dry handling here, plus joint best comfort and the best subjective noise. It is also the only tyre I would actively steer people away from if they live somewhere snowy, because it was last in both snow tests. Not planning on a track day and not planning on a blizzard? It is an excellent tyre.
The Bridgestone Turanza EverDrive finishes fourth, and it is very nearly the exact mirror image of the Goodyear. It was last in both wet and dry braking and it never had the grip of the leaders on either handling course, but its snow performance is in a different league to everything else in this test. Buy it for the climate, not for the lap time.
Last place goes to the Michelin Defender 2, and it is worth remembering what last place means in a test of five premium tyres: I still recommend it. It was best in test for straight aquaplaning, competitive in dry handling, and it has the crispest, most enjoyable steering of the group. It simply gives up a fraction of grip in every condition, which I suspect is a deliberate design choice, because Michelin have a long record of over engineering longevity. It is also the most expensive tyre in the test to buy, which puts it last on cost per warranted mile. Every tyre here is warranted to at least 70,000 miles, but the Defender 2 is the one people report taking well past 100,000.
Five good tyres, then, each with a distinct personality. Change the score weighting below to match where you actually drive and the order will change with it.
Continental TrueContact Tour 54
215/55 R17 94V
Category scores (% of best)
All discipline results (13)
Discipline positions compare the ranked tyres in this test, not the whole market. These are individual measurements, not weighted overall scores.
| Test | Position in discipline | Result | Gap to best |
|---|---|---|---|
| Dry BrakingLower is better | 3rd / 5 | 40.2 m | +2.10 m |
| Dry HandlingLower is better | 1st / 5 | 44.04 s | Best in this discipline |
| Subj. Dry HandlingHigher is better | 1st / 5 | 8.5 Points | Best in this discipline |
| Wet BrakingLower is better | 1st / 5 | 48.1 m | Best in this discipline |
| Wet HandlingLower is better | 1st / 5 | 50.32 s | Best in this discipline |
| Subj. Wet HandlingHigher is better | 1st / 5 | 8.4 Points | Best in this discipline |
| Straight AquaHigher is better | 3rd / 5 | 63.48 km/h | -3.17 km/h |
| Snow BrakingLower is better | 3rd / 5 | 16.6 m | +1.90 m |
| Snow TractionLower is better | 3rd / 5 | 4.54 s | +0.99 s |
| Subj. ComfortHigher is better | 1st / 5 | 10 Points | Best in this discipline |
| NoiseLower is better | 3rd / 5 | 63.9 dB | +0.40 dB |
| ValueLower is better | 4th / 5 | 2.56 Price/1000 | +0.32 Price/1000 |
| Rolling ResistanceLower is better | 1st / 5 | 8.18 kg/t | Best in this discipline |
- UTQG
- 840 A A
- Rim Protection
- Large
- Weight
- 10.83 kgs
- Tread
- 8.73 mm
- Price
- 178.99
Dunlop Blue Response AS
215/55 R17 94V
Category scores (% of best)
All discipline results (13)
Discipline positions compare the ranked tyres in this test, not the whole market. These are individual measurements, not weighted overall scores.
| Test | Position in discipline | Result | Gap to best |
|---|---|---|---|
| Dry BrakingLower is better | 1st / 5 | 38.1 m | Best in this discipline |
| Dry HandlingLower is better | 3rd / 5 | 44.53 s | +0.49 s |
| Subj. Dry HandlingHigher is better | 2nd / 5 | 8.4 Points | -0.10 Points |
| Wet BrakingLower is better | 3rd / 5 | 50.5 m | +2.40 m |
| Wet HandlingLower is better | 3rd / 5 | 51.87 s | +1.55 s |
| Subj. Wet HandlingHigher is better | 2nd / 5 | 8.3 Points | -0.10 Points |
| Straight AquaHigher is better | 5th / 5 | 60.39 km/h | -6.26 km/h |
| Snow BrakingLower is better | 2nd / 5 | 16 m | +1.30 m |
| Snow TractionLower is better | 2nd / 5 | 4.32 s | +0.77 s |
| Subj. ComfortHigher is better | 3rd / 5 | 9.5 Points | -0.50 Points |
| NoiseLower is better | 1st / 5 | 63.5 dB | Best in this discipline |
| ValueLower is better | 1st / 5 | 2.24 Price/1000 | Best in this discipline |
| Rolling ResistanceLower is better | 3rd / 5 | 8.52 kg/t | +0.34 kg/t |
- UTQG
- 820 A A
- Weight
- 10.63 kgs
- Tread
- 8.73 mm
- Price
- 179.00
Goodyear Assurance MaxLife 2
215/55 R17 94V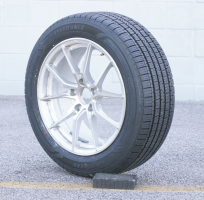
Category scores (% of best)
All discipline results (13)
Discipline positions compare the ranked tyres in this test, not the whole market. These are individual measurements, not weighted overall scores.
| Test | Position in discipline | Result | Gap to best |
|---|---|---|---|
| Dry BrakingLower is better | 2nd / 5 | 40.1 m | +2.00 m |
| Dry HandlingLower is better | 2nd / 5 | 44.15 s | +0.11 s |
| Subj. Dry HandlingHigher is better | 4th / 5 | 8.2 Points | -0.30 Points |
| Wet BrakingLower is better | 2nd / 5 | 49 m | +0.90 m |
| Wet HandlingLower is better | 2nd / 5 | 50.77 s | +0.45 s |
| Subj. Wet HandlingHigher is better | 2nd / 5 | 8.3 Points | -0.10 Points |
| Straight AquaHigher is better | 4th / 5 | 63.05 km/h | -3.60 km/h |
| Snow BrakingLower is better | 5th / 5 | 18 m | +3.30 m |
| Snow TractionLower is better | 5th / 5 | 4.82 s | +1.27 s |
| Subj. ComfortHigher is better | 1st / 5 | 10 Points | Best in this discipline |
| NoiseLower is better | 2nd / 5 | 63.8 dB | +0.30 dB |
| ValueLower is better | 2nd / 5 | 2.27 Price/1000 | +0.03 Price/1000 |
| Rolling ResistanceLower is better | 5th / 5 | 8.93 kg/t | +0.75 kg/t |
- UTQG
- 820 A B
- Weight
- 10.89 kgs
- Tread
- 8.73 mm
- Price
- 192.99
Bridgestone Turanza EverDrive
215/55 R17 94V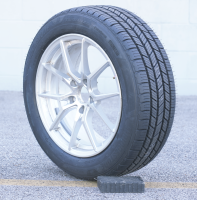
Category scores (% of best)
All discipline results (13)
Discipline positions compare the ranked tyres in this test, not the whole market. These are individual measurements, not weighted overall scores.
| Test | Position in discipline | Result | Gap to best |
|---|---|---|---|
| Dry BrakingLower is better | 5th / 5 | 42.9 m | +4.80 m |
| Dry HandlingLower is better | 5th / 5 | 44.77 s | +0.73 s |
| Subj. Dry HandlingHigher is better | 5th / 5 | 8.1 Points | -0.40 Points |
| Wet BrakingLower is better | 5th / 5 | 53.7 m | +5.60 m |
| Wet HandlingLower is better | 4th / 5 | 52.07 s | +1.75 s |
| Subj. Wet HandlingHigher is better | 5th / 5 | 7.9 Points | -0.50 Points |
| Straight AquaHigher is better | 2nd / 5 | 64.52 km/h | -2.13 km/h |
| Snow BrakingLower is better | 1st / 5 | 14.7 m | Best in this discipline |
| Snow TractionLower is better | 1st / 5 | 3.55 s | Best in this discipline |
| Subj. ComfortHigher is better | 4th / 5 | 9 Points | -1.00 Points |
| NoiseLower is better | 3rd / 5 | 63.9 dB | +0.40 dB |
| ValueLower is better | 3rd / 5 | 2.47 Price/1000 | +0.23 Price/1000 |
| Rolling ResistanceLower is better | 2nd / 5 | 8.25 kg/t | +0.07 kg/t |
- UTQG
- 800 B B
- Rim Protection
- Small
- Weight
- 10.45 kgs
- Tread
- 8.73 mm
- Price
- 197.99
Michelin Defender 2
215/55 R17 98V XL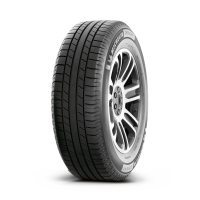
Category scores (% of best)
All discipline results (13)
Discipline positions compare the ranked tyres in this test, not the whole market. These are individual measurements, not weighted overall scores.
| Test | Position in discipline | Result | Gap to best |
|---|---|---|---|
| Dry BrakingLower is better | 4th / 5 | 40.4 m | +2.30 m |
| Dry HandlingLower is better | 4th / 5 | 44.66 s | +0.62 s |
| Subj. Dry HandlingHigher is better | 3rd / 5 | 8.3 Points | -0.20 Points |
| Wet BrakingLower is better | 4th / 5 | 51.6 m | +3.50 m |
| Wet HandlingLower is better | 5th / 5 | 52.17 s | +1.85 s |
| Subj. Wet HandlingHigher is better | 4th / 5 | 8.1 Points | -0.30 Points |
| Straight AquaHigher is better | 1st / 5 | 66.65 km/h | Best in this discipline |
| Snow BrakingLower is better | 4th / 5 | 17.7 m | +3.00 m |
| Snow TractionLower is better | 4th / 5 | 4.66 s | +1.11 s |
| Subj. ComfortHigher is better | 4th / 5 | 9 Points | -1.00 Points |
| NoiseLower is better | 5th / 5 | 64 dB | +0.50 dB |
| ValueLower is better | 5th / 5 | 2.62 Price/1000 | +0.38 Price/1000 |
| Rolling ResistanceLower is better | 4th / 5 | 8.71 kg/t | +0.53 kg/t |
- UTQG
- 840 B B
- Weight
- 11.11 kgs
- Tread
- 8.43 mm
- Price
- 209.99

Discussion