


Tire Rack has opened its 2026 test programme with a direct answer to one of the most persistent questions in winter tyre buying: how much do you actually give up by running a set of all-weather tyres through the cold months instead of fitting dedicated winter tyres? Ten tyres were run in 215/55 R17 on a 2025 Toyota Camry, covering five dedicated winter tyres, three all-weather tyres carrying the three-peak mountain snowflake marking, and two conventional all-season tyres without it.
The answer is unambiguous, and it is largest exactly where it matters most. On ice the best winter tyre stopped in a little under twelve metres while the weakest all-season tyre needed almost eighteen, and the snow braking spread ran from just over seventeen metres to just under twenty-five. Turn to the dry and the order inverts, but by far less: the spread between best and worst dry braking was around six metres, and in the wet about eleven. Credit to Tire Rack for running a structured, repeatable test methodology, and for testing in near-freezing temperatures so that every tyre was measured in the conditions these products are actually driven in.
Test setup & methodology
The test setting, the conditions recorded and how the results contribute to the score.
Recorded test conditions
Recorded test conditions
- Dry Braking
- 80 → 0 km/h
- Wet Braking
- 80 → 0 km/h
- Snow Braking
- 40 → 0 km/h
- Ice Braking
- 19 → 0 km/h
One note on the numbers before the results. Tire Rack publishes in imperial and brakes from different speeds on each surface: 50 mph on dry and wet tarmac, 25 mph on snow and 12 mph on ice. We have converted every distance to metres and every speed to km/h, so the braking charts below are labelled 80 to 0 km/h for dry and wet, 40 to 0 km/h for snow and 19 to 0 km/h for ice. Because the surfaces differ, distances should only be compared within a chart, never across them.
Dry
The all-season and all-weather tyres owned the dry braking chart. The Michelin CrossClimate2 stopped shortest, with the Primacy Tour A/S, the Vredestein Quatrac and the Michelin Defender 2 filling out the top four, while three of the winter tyres took the last three places and the Michelin X-Ice Snow needed around six metres more than the CrossClimate2 to stop.
Dry Braking
Dry braking in meters (80 - 0 km/h)
Lower is better ↓All Season Tyres
| Position / Tyre | Result | Gap to best | Residual speed |
|---|---|---|---|
| 25.51 m | Best | 0 km/h | |
| 26.27 m | +0.76 m | 22 km/h |
All Weather Tyres
| Position / Tyre | Result | Gap to best | Residual speed |
|---|---|---|---|
| 25.33 m | Best | 0 km/h | |
| 25.79 m | +0.46 m | 17 km/h | |
| 29.44 m | +4.11 m | 49 km/h |
Winter Tyres
| Position / Tyre | Result | Gap to best | Residual speed |
|---|---|---|---|
| 28.07 m | Best | 0 km/h | |
| 28.19 m | +0.12 m | 8 km/h | |
| 30.15 m | +2.08 m | 34 km/h | |
| 31.3 m | +3.23 m | 42 km/h | |
| 31.39 m | +3.32 m | 42 km/h |
The difference between best and worst was 23.9% (6.06 m ≈ 1.3 Car Lengths). From 130 km/h, the Michelin X Ice Snow would still be travelling at 57 km/h when the Michelin CrossClimate 2 AW had stopped.
Residual speed is calculated from the measured braking distances, assuming constant deceleration; it is not a separate measurement.

Peak dry cornering grip followed the same pattern, with the Primacy Tour A/S and Defender 2 tied at the top and the Blizzak WS90, Altimax Arctic 12 and X-Ice Snow tied at the bottom, though the spread here is narrower than the braking chart suggests.
Dry Circle
Average cornering G force in the dry
Higher is better ↓All Season Tyres
| Position / Tyre | Result | Gap to best |
|---|---|---|
| 0.86 g | Best | |
| 0.86 g | Best |
All Weather Tyres
| Position / Tyre | Result | Gap to best |
|---|---|---|
| 0.85 g | Best | |
| 0.84 g | -0.01 g | |
| 0.83 g | -0.02 g |
Winter Tyres
| Position / Tyre | Result | Gap to best |
|---|---|---|
| 0.83 g | Best | |
| 0.81 g | -0.02 g | |
| 0.78 g | -0.05 g | |
| 0.78 g | -0.05 g | |
| 0.78 g | -0.05 g |
The difference between best and worst was 9.3% (0.08 g).
The subjective steering and road handling scores are more interesting than the outright grip. The CrossClimate2 was rated best in the test, which is no surprise, but the X-Ice Snow finished second, ahead of every non-winter tyre bar the CrossClimate2. That is unusual for a studless ice tyre and worth knowing if vague steering is what has put you off winter tyres in the past. The Altimax Arctic 12 was the weakest here, criticised for a poor sense of returning to centre.
Subj. Road Score
Subjective Real World Driving Score
Higher is better ↑All Season Tyres
| Position / Tyre | Result | Gap to best |
|---|---|---|
| 7 Points | Best | |
| 7 Points | Best |
All Weather Tyres
| Position / Tyre | Result | Gap to best |
|---|---|---|
| 8.25 Points | Best | |
| 7.5 Points | -0.75 Points | |
| 7 Points | -1.25 Points |
Winter Tyres
| Position / Tyre | Result | Gap to best |
|---|---|---|
| 8 Points | Best | |
| 7.5 Points | -0.50 Points | |
| 7 Points | -1.00 Points | |
| 6.5 Points | -1.50 Points | |
| 6.25 Points | -1.75 Points |
The difference between best and worst was 24.2% (2 Points).
Wet
The Vredestein Quatrac was the wet-weather standout, taking both the shortest wet braking distance and the highest wet cornering grip in the test. The winter tyres struggled, with the X-Ice Snow stopping around eleven metres longer than the Quatrac, although the Vredestein Wintrac Pro+ was a clear exception and braked better in the wet than two of the non-winter tyres.
Wet Braking
Wet braking in meters (80 - 0 km/h)
Lower is better ↓All Season Tyres
| Position / Tyre | Result | Gap to best | Residual speed |
|---|---|---|---|
| 30.27 m | Best | 0 km/h | |
| 33.62 m | +3.35 m | 41 km/h |
All Weather Tyres
| Position / Tyre | Result | Gap to best | Residual speed |
|---|---|---|---|
| 28.35 m | Best | 0 km/h | |
| 30.36 m | +2.01 m | 33 km/h | |
| 33.74 m | +5.39 m | 52 km/h |
Winter Tyres
| Position / Tyre | Result | Gap to best | Residual speed |
|---|---|---|---|
| 30.54 m | Best | 0 km/h | |
| 35.84 m | +5.30 m | 50 km/h | |
| 35.91 m | +5.37 m | 50 km/h | |
| 37.31 m | +6.77 m | 55 km/h | |
| 39.32 m | +8.78 m | 61 km/h |
The difference between best and worst was 38.7% (10.97 m ≈ 2.4 Car Lengths). From 130 km/h, the Michelin X Ice Snow would still be travelling at 69 km/h when the Vredestein Quatrac had stopped.
Residual speed is calculated from the measured braking distances, assuming constant deceleration; it is not a separate measurement.
Wet cornering told the same story, with the Quatrac and Primacy Tour A/S at the top and the two studless ice tyres, the Blizzak WS90 and X-Ice Snow, tied at the bottom.
Wet Circle
Average cornering G force in the wet
Higher is better ↑All Season Tyres
| Position / Tyre | Result | Gap to best |
|---|---|---|
| 0.72 g | Best | |
| 0.7 g | -0.02 g |
All Weather Tyres
| Position / Tyre | Result | Gap to best |
|---|---|---|
| 0.74 g | Best | |
| 0.69 g | -0.05 g | |
| 0.67 g | -0.07 g |
Winter Tyres
| Position / Tyre | Result | Gap to best |
|---|---|---|
| 0.71 g | Best | |
| 0.65 g | -0.06 g | |
| 0.63 g | -0.08 g | |
| 0.6 g | -0.11 g | |
| 0.6 g | -0.11 g |
The difference between best and worst was 18.9% (0.14 g).

Snow
Snow braking is where the categories separate, but not quite as cleanly as expected. Five of the top six places went to dedicated winter tyres, yet the Bridgestone WeatherPeak split them, stopping third and beating three winter tyres including the Continental VikingContact 8 and the Vredestein Wintrac Pro+. Below that group the drop is sharp: the next tyre, the CrossClimate2, needed nearly three metres more than the last of that leading group, and the two tyres without the snowflake marking propped up the chart.
Snow Braking
Snow braking in meters (40 - 0 km/h)
Lower is better ↓All Season Tyres
| Position / Tyre | Result | Gap to best | Residual speed |
|---|---|---|---|
| 24.72 m | Best | 0 km/h | |
| 24.95 m | +0.23 m | 12 km/h |
All Weather Tyres
| Position / Tyre | Result | Gap to best | Residual speed |
|---|---|---|---|
| 17.87 m | Best | 0 km/h | |
| 22.06 m | +4.19 m | 57 km/h | |
| 22.24 m | +4.37 m | 58 km/h |
Winter Tyres
| Position / Tyre | Result | Gap to best | Residual speed |
|---|---|---|---|
| 17.1 m | Best | 0 km/h | |
| 17.47 m | +0.37 m | 19 km/h | |
| 18.08 m | +0.98 m | 30 km/h | |
| 18.62 m | +1.52 m | 37 km/h | |
| 19.23 m | +2.13 m | 43 km/h |
The difference between best and worst was 45.9% (7.85 m ≈ 1.7 Car Lengths). From 130 km/h, the Michelin Defender 2 would still be travelling at 73 km/h when the Michelin X Ice Snow had stopped.
Residual speed is calculated from the measured braking distances, assuming constant deceleration; it is not a separate measurement.
Around the snow handling course the winter tyres reasserted themselves. The Blizzak WS90 set the fastest lap, over nine seconds clear of the slowest tyre in the test, and the five winter tyres locked out the top five places, with the WeatherPeak dropping to seventh.
Snow Handling
Snow handling time in seconds
Lower is better ↓All Season Tyres
| Position / Tyre | Result | Gap to best |
|---|---|---|
| 61.17 s | Best | |
| 62.84 s | +1.67 s |
All Weather Tyres
| Position / Tyre | Result | Gap to best |
|---|---|---|
| 57.95 s | Best | |
| 58.04 s | +0.09 s | |
| 58.37 s | +0.42 s |
Winter Tyres
| Position / Tyre | Result | Gap to best |
|---|---|---|
| 53.66 s | Best | |
| 54.19 s | +0.53 s | |
| 54.31 s | +0.65 s | |
| 56.31 s | +2.65 s | |
| 57.07 s | +3.41 s |
The difference between best and worst was 17.1% (9.18 s).
The subjective snow scores match the stopwatch. The Blizzak WS90 was rated highest, with testers noting they could brake later and accelerate earlier than on anything else, while the Defender 2 and Primacy Tour A/S shared the lowest score, both marked down for giving almost no warning before letting go.
Subj. Snow Handling
Subjective Snow Handling Score
Higher is better ↑All Season Tyres
| Position / Tyre | Result | Gap to best |
|---|---|---|
| 4.5 Points | Best | |
| 4.5 Points | Best |
All Weather Tyres
| Position / Tyre | Result | Gap to best |
|---|---|---|
| 6.5 Points | Best | |
| 6.25 Points | -0.25 Points | |
| 5.25 Points | -1.25 Points |
Winter Tyres
| Position / Tyre | Result | Gap to best |
|---|---|---|
| 8.25 Points | Best | |
| 8 Points | -0.25 Points | |
| 8 Points | -0.25 Points | |
| 7.75 Points | -0.50 Points | |
| 7 Points | -1.25 Points |
The difference between best and worst was 45.5% (3.75 Points).
Ice
Ice produced the widest margins in the test. The Blizzak WS90 stopped shortest, with the X-Ice Snow close behind, and four of the winter tyres took the top four places. The Primacy Tour A/S needed roughly half as far again as the Blizzak to stop from the same speed.
Ice Braking
Ice braking in meters (19 - 0 km/h)
Lower is better ↓All Season Tyres
| Position / Tyre | Result | Gap to best | Residual speed |
|---|---|---|---|
| 16.76 m | Best | 0 km/h | |
| 17.59 m | +0.83 m | 28 km/h |
All Weather Tyres
| Position / Tyre | Result | Gap to best | Residual speed |
|---|---|---|---|
| 15.42 m | Best | 0 km/h | |
| 16.15 m | +0.73 m | 28 km/h | |
| 16.49 m | +1.07 m | 33 km/h |
Winter Tyres
| Position / Tyre | Result | Gap to best | Residual speed |
|---|---|---|---|
| 11.8 m | Best | 0 km/h | |
| 12.01 m | +0.21 m | 17 km/h | |
| 13.2 m | +1.40 m | 42 km/h | |
| 13.99 m | +2.19 m | 51 km/h | |
| 16.22 m | +4.42 m | 68 km/h |
The difference between best and worst was 49.1% (5.79 m ≈ 1.3 Car Lengths). From 130 km/h, the Michelin Primacy Tour AS would still be travelling at 75 km/h when the Bridgestone Blizzak WS90 had stopped.
Residual speed is calculated from the measured braking distances, assuming constant deceleration; it is not a separate measurement.
There is one genuine upset here. The Vredestein Wintrac Pro+, a dedicated performance winter tyre, was beaten on ice braking by the Vredestein Quatrac, an all-weather tyre from the same manufacturer, and finished behind it for ice acceleration too. That is not the usual order of things and is a reminder that the performance winter category trades some outright cold-weather traction for speed rating and dry ability.
Ice Traction
Ice acceleration time
Lower is better ↓All Season Tyres
| Position / Tyre | Result | Gap to best |
|---|---|---|
| 6.17 s | Best | |
| 6.24 s | +0.07 s |
All Weather Tyres
| Position / Tyre | Result | Gap to best |
|---|---|---|
| 5.8 s | Best | |
| 6.09 s | +0.29 s | |
| 6.17 s | +0.37 s |
Winter Tyres
| Position / Tyre | Result | Gap to best |
|---|---|---|
| 5.02 s | Best | |
| 5.09 s | +0.07 s | |
| 5.3 s | +0.28 s | |
| 5.51 s | +0.49 s | |
| 6.02 s | +1.00 s |
The difference between best and worst was 24.3% (1.22 s).
Comfort
The Continental VikingContact 8 was rated the most comfortable tyre in the test, which is a strong result for a studless winter tyre, while the WeatherPeak was the firmest. On noise the Defender 2 was clearly the quietest, and the CrossClimate2 shared the lowest score with four others after testers noted a constant growl that turned to a hiss at speed.
Subj. Comfort
Subjective Comfort Score
Higher is better ↑All Season Tyres
| Position / Tyre | Result | Gap to best |
|---|---|---|
| 7.5 Points | Best | |
| 7.5 Points | Best |
All Weather Tyres
| Position / Tyre | Result | Gap to best |
|---|---|---|
| 7.5 Points | Best | |
| 7.25 Points | -0.25 Points | |
| 7 Points | -0.50 Points |
Winter Tyres
| Position / Tyre | Result | Gap to best |
|---|---|---|
| 8 Points | Best | |
| 7.75 Points | -0.25 Points | |
| 7.75 Points | -0.25 Points | |
| 7.5 Points | -0.50 Points | |
| 7.5 Points | -0.50 Points |
The difference between best and worst was 12.5% (1 Points).
Subj. Noise
Subjective in car noise levels
Higher is better ↑All Season Tyres
| Position / Tyre | Result | Gap to best |
|---|---|---|
| 8 Points | Best | |
| 7 Points | -1.00 Points |
All Weather Tyres
| Position / Tyre | Result | Gap to best |
|---|---|---|
| 7.5 Points | Best | |
| 7 Points | -0.50 Points | |
| 7 Points | -0.50 Points |
Winter Tyres
| Position / Tyre | Result | Gap to best |
|---|---|---|
| 7.75 Points | Best | |
| 7.5 Points | -0.25 Points | |
| 7.25 Points | -0.50 Points | |
| 7 Points | -0.75 Points | |
| 7 Points | -0.75 Points |
The difference between best and worst was 12.5% (1 Points).
How this compares with our own testing
The WeatherPeak result is worth checking against other data, because an all-weather tyre out-braking three winter tyres in snow invites scepticism. It holds up. The WeatherPeak finished second of eight for snow braking in our own all-weather tyre test, and second of eleven in Tire Rack's 2025 test. Strong snow braking is a consistent characteristic of this tyre rather than a one-off result.
Results
Tire Rack does not declare an overall winner in this test, and publishes separate road and snow ratings instead. The order below combines those two ratings evenly, which puts the five dedicated winter tyres ahead of the three all-weather tyres, and the two all-season tyres without the snowflake marking last. Read it as a summary of this particular test rather than a buying order, because the right tyre here depends entirely on how much of your year is actually spent on snow and ice. Tire Rack publish the full driver scorecards, their own written conclusions and several measurements we have not reproduced here, all of which is well worth reading in the original test report.
All Season Tyres
Michelin Defender 2
215/55 R17 98H XL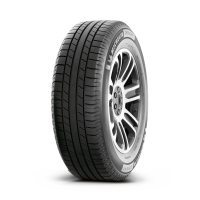
All discipline results (12)
Discipline positions compare the ranked tyres in this test, not the whole market. These are individual measurements, not weighted overall scores.
| Test | Result |
|---|---|
| Dry BrakingLower is better | 26.274 m |
| Dry CircleHigher is better | 0.86 g |
| Subj. Road ScoreHigher is better | 7 Points |
| Wet BrakingLower is better | 33.619 m |
| Wet CircleHigher is better | 0.7 g |
| Snow BrakingLower is better | 24.951 m |
| Snow HandlingLower is better | 62.84 s |
| Subj. Snow HandlingHigher is better | 4.5 Points |
| Ice BrakingLower is better | 16.764 m |
| Ice TractionLower is better | 6.17 s |
| Subj. ComfortHigher is better | 7.5 Points |
| Subj. NoiseHigher is better | 8 Points |
Michelin Primacy Tour AS
215/55 R17 94V
All discipline results (12)
Discipline positions compare the ranked tyres in this test, not the whole market. These are individual measurements, not weighted overall scores.
| Test | Result |
|---|---|
| Dry BrakingLower is better | 25.512 m |
| Dry CircleHigher is better | 0.86 g |
| Subj. Road ScoreHigher is better | 7 Points |
| Wet BrakingLower is better | 30.267 m |
| Wet CircleHigher is better | 0.72 g |
| Snow BrakingLower is better | 24.719 m |
| Snow HandlingLower is better | 61.17 s |
| Subj. Snow HandlingHigher is better | 4.5 Points |
| Ice BrakingLower is better | 17.587 m |
| Ice TractionLower is better | 6.24 s |
| Subj. ComfortHigher is better | 7.5 Points |
| Subj. NoiseHigher is better | 7 Points |
All Weather Tyres
Bridgestone WeatherPeak
215/55 R17 94V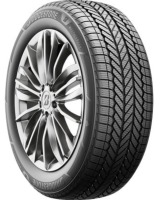
All discipline results (12)
Discipline positions compare the ranked tyres in this test, not the whole market. These are individual measurements, not weighted overall scores.
| Test | Result |
|---|---|
| Dry BrakingLower is better | 29.444 m |
| Dry CircleHigher is better | 0.84 g |
| Subj. Road ScoreHigher is better | 7 Points |
| Wet BrakingLower is better | 33.741 m |
| Wet CircleHigher is better | 0.67 g |
| Snow BrakingLower is better | 17.87 m |
| Snow HandlingLower is better | 58.04 s |
| Subj. Snow HandlingHigher is better | 6.5 Points |
| Ice BrakingLower is better | 16.49 m |
| Ice TractionLower is better | 6.17 s |
| Subj. ComfortHigher is better | 7 Points |
| Subj. NoiseHigher is better | 7.5 Points |
Michelin CrossClimate 2 AW
215/55 R17 94V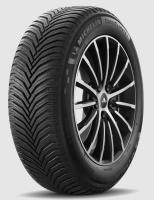
All discipline results (12)
Discipline positions compare the ranked tyres in this test, not the whole market. These are individual measurements, not weighted overall scores.
| Test | Result |
|---|---|
| Dry BrakingLower is better | 25.329 m |
| Dry CircleHigher is better | 0.83 g |
| Subj. Road ScoreHigher is better | 8.25 Points |
| Wet BrakingLower is better | 30.358 m |
| Wet CircleHigher is better | 0.69 g |
| Snow BrakingLower is better | 22.061 m |
| Snow HandlingLower is better | 57.95 s |
| Subj. Snow HandlingHigher is better | 6.25 Points |
| Ice BrakingLower is better | 16.154 m |
| Ice TractionLower is better | 6.09 s |
| Subj. ComfortHigher is better | 7.25 Points |
| Subj. NoiseHigher is better | 7 Points |
Vredestein Quatrac
215/55 R17 98H XL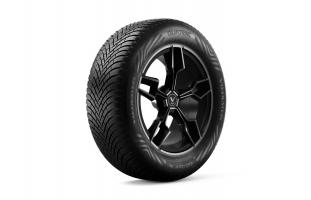
All discipline results (12)
Discipline positions compare the ranked tyres in this test, not the whole market. These are individual measurements, not weighted overall scores.
| Test | Result |
|---|---|
| Dry BrakingLower is better | 25.786 m |
| Dry CircleHigher is better | 0.85 g |
| Subj. Road ScoreHigher is better | 7.5 Points |
| Wet BrakingLower is better | 28.346 m |
| Wet CircleHigher is better | 0.74 g |
| Snow BrakingLower is better | 22.244 m |
| Snow HandlingLower is better | 58.37 s |
| Subj. Snow HandlingHigher is better | 5.25 Points |
| Ice BrakingLower is better | 15.423 m |
| Ice TractionLower is better | 5.8 s |
| Subj. ComfortHigher is better | 7.5 Points |
| Subj. NoiseHigher is better | 7 Points |
Winter Tyres
Continental VikingContact 8
215/55 R17 98H XL
All discipline results (12)
Discipline positions compare the ranked tyres in this test, not the whole market. These are individual measurements, not weighted overall scores.
| Test | Result |
|---|---|
| Dry BrakingLower is better | 30.145 m |
| Dry CircleHigher is better | 0.81 g |
| Subj. Road ScoreHigher is better | 7.5 Points |
| Wet BrakingLower is better | 35.905 m |
| Wet CircleHigher is better | 0.63 g |
| Snow BrakingLower is better | 18.075 m |
| Snow HandlingLower is better | 54.19 s |
| Subj. Snow HandlingHigher is better | 8 Points |
| Ice BrakingLower is better | 13.198 m |
| Ice TractionLower is better | 5.3 s |
| Subj. ComfortHigher is better | 8 Points |
| Subj. NoiseHigher is better | 7.75 Points |
Michelin X Ice Snow
215/55 R17 98H XL
All discipline results (12)
Discipline positions compare the ranked tyres in this test, not the whole market. These are individual measurements, not weighted overall scores.
| Test | Result |
|---|---|
| Dry BrakingLower is better | 31.394 m |
| Dry CircleHigher is better | 0.78 g |
| Subj. Road ScoreHigher is better | 8 Points |
| Wet BrakingLower is better | 39.319 m |
| Wet CircleHigher is better | 0.6 g |
| Snow BrakingLower is better | 17.099 m |
| Snow HandlingLower is better | 54.31 s |
| Subj. Snow HandlingHigher is better | 8 Points |
| Ice BrakingLower is better | 12.009 m |
| Ice TractionLower is better | 5.09 s |
| Subj. ComfortHigher is better | 7.75 Points |
| Subj. NoiseHigher is better | 7 Points |
Bridgestone Blizzak WS90
215/55 R17 94H
All discipline results (12)
Discipline positions compare the ranked tyres in this test, not the whole market. These are individual measurements, not weighted overall scores.
| Test | Result |
|---|---|
| Dry BrakingLower is better | 28.072 m |
| Dry CircleHigher is better | 0.78 g |
| Subj. Road ScoreHigher is better | 6.5 Points |
| Wet BrakingLower is better | 35.844 m |
| Wet CircleHigher is better | 0.6 g |
| Snow BrakingLower is better | 17.474 m |
| Snow HandlingLower is better | 53.66 s |
| Subj. Snow HandlingHigher is better | 8.25 Points |
| Ice BrakingLower is better | 11.796 m |
| Ice TractionLower is better | 5.02 s |
| Subj. ComfortHigher is better | 7.5 Points |
| Subj. NoiseHigher is better | 7.25 Points |
General Altimax Arctic 12
215/55 R17 98T XL
All discipline results (12)
Discipline positions compare the ranked tyres in this test, not the whole market. These are individual measurements, not weighted overall scores.
| Test | Result |
|---|---|
| Dry BrakingLower is better | 31.303 m |
| Dry CircleHigher is better | 0.78 g |
| Subj. Road ScoreHigher is better | 6.25 Points |
| Wet BrakingLower is better | 37.308 m |
| Wet CircleHigher is better | 0.65 g |
| Snow BrakingLower is better | 18.617 m |
| Snow HandlingLower is better | 56.31 s |
| Subj. Snow HandlingHigher is better | 7.75 Points |
| Ice BrakingLower is better | 13.99 m |
| Ice TractionLower is better | 5.51 s |
| Subj. ComfortHigher is better | 7.5 Points |
| Subj. NoiseHigher is better | 7.5 Points |
Vredestein Wintrac Pro+
215/55 R17 98H XL
All discipline results (12)
Discipline positions compare the ranked tyres in this test, not the whole market. These are individual measurements, not weighted overall scores.
| Test | Result |
|---|---|
| Dry BrakingLower is better | 28.194 m |
| Dry CircleHigher is better | 0.83 g |
| Subj. Road ScoreHigher is better | 7 Points |
| Wet BrakingLower is better | 30.541 m |
| Wet CircleHigher is better | 0.71 g |
| Snow BrakingLower is better | 19.227 m |
| Snow HandlingLower is better | 57.07 s |
| Subj. Snow HandlingHigher is better | 7 Points |
| Ice BrakingLower is better | 16.215 m |
| Ice TractionLower is better | 6.02 s |
| Subj. ComfortHigher is better | 7.75 Points |
| Subj. NoiseHigher is better | 7 Points |
Discussion