




In this test I've taken five of the most popular aggressive all terrain tyres for SUVs and trucks, and tested them offroad, in the dry, wet, and snow, and spent time assessing noise and comfort levels to help you pick the best all terrain tyre for your vehicle.

Test setup & methodology
The test setting, the conditions recorded and how the results contribute to the score.
Show full testing methodology
Recorded test conditions
- Dry Braking
- 60 → 0 mph · 82–84 f
- Wet Braking
- 60 → 0 mph · 83–85 f
- Snow Braking
- 40 → 5 km/h
Score Weighting
Weights express the scoring priorities, not how much each discipline actually changed the finishing order. The size of the performance gaps matters too. Category weights contribute to the overall score. Within each category, discipline weights divide that category’s share. Published finishing positions also need to be read alongside the editorial verdict.
| Test | Within category | Share of overall score |
|---|---|---|
| Dry · 25% | ||
| Dry Braking | 40% | 10% |
| Dry Handling | 20% | 5% |
| Subj. Dry Handling | 10% | 2.5% |
| Subj. Road Score | 30% | 7.5% |
| Wet · 25% | ||
| Wet Braking | 40% | 10% |
| Wet Handling | 30% | 7.5% |
| Subj. Wet Handling | 20% | 5% |
| Straight Aqua | 10% | 2.5% |
| Off road · 20% | ||
| Dirt Handling | 50% | 10% |
| Subj. Dirt Handling | 50% | 10% |
| Snow · 10% | ||
| Snow Braking | 40% | 4% |
| Snow Handling | 30% | 3% |
| Subj. Snow Handling | 30% | 3% |
| Comfort · 15% | ||
| Subj. Comfort | 50% | 7.5% |
| Subj. Noise | 50% | 7.5% |
| Value · 5% | ||
| Value | 100% | 5% |
Our standard methods
The conditions above are recorded for this test. The descriptions below explain our standard procedures; measurement windows and run counts can vary by test.
Dry Braking
For dry braking, I drive the test vehicle at an entry speed of 110 km/h and apply full braking effort to a standstill with ABS active on clean, dry asphalt. I typically use an 100–5 km/h measurement window. My standard programme is five runs per tyre set where possible, although the sequence can extend to as many as fifteen runs if conditions and tyre category justify it. I analyse the full set of runs and discard statistical outliers before averaging. Reference tyres are run repeatedly throughout the session to correct for changing conditions.
Dry Handling
For dry handling, I drive at the limit of adhesion around a dedicated handling circuit with ESC disabled where possible so I can assess the tyre's natural balance, transient response, and limit behaviour without electronic intervention masking the result. I usually complete between two and five timed laps per tyre set, depending on the circuit, tyre type, and consistency of conditions. I exclude laps affected by clear driver error or obvious environmental inconsistency. Control runs are carried out frequently throughout the session, and I often use multiple sets of control tyres so that wear on the references does not become a meaningful variable. For more track-focused products, I also do endurance testing, which is a set number of laps at race pace to determine tire wear patterns and heat resistance over longer driving.
Subj. Dry Handling
I also carry out a structured subjective handling assessment at the limit of adhesion on a dedicated dry handling circuit. I score steering precision, steering response, turn-in behaviour, mid-corner balance, corner-exit traction, breakaway characteristics, and overall confidence using a standardised 1–10 scale used consistently across my testing. The final assessment combines numeric scoring with written technical commentary. I complete familiarisation laps on the control tyre before evaluating each candidate.
Subj. Road Score
I use a broader road score to capture how a tyre performs in normal real-world use across motorways, rural roads, and urban environments over an extended drive of typically 100 km or more. This assessment includes ride comfort, cruising noise, wet-weather confidence, steering feel, lane-change stability, straight-line stability, and overall predictability. It is intended to reflect the cumulative real-world impression a tyre creates outside the constraints of short-format instrumented testing. Rated on a 1–10 scale.
Wet Braking
For wet braking, I drive the test vehicle at an entry speed of 88 km/h and apply full braking effort to a standstill with ABS active on an asphalt surface with a controlled water film. I typically use an 80–5 km/h measurement window to isolate tyre performance from variability in the initial brake application. My standard programme is eight runs per tyre set where possible, although the sequence can extend to as many as fifteen runs if conditions and tyre category justify it. I analyse the full set of runs and discard statistical outliers before averaging. To correct for changing conditions, I run reference tyres repeatedly throughout the session — in wet testing, typically every three candidate test sets.
Wet Handling
For wet handling, I drive at the limit of adhesion around a dedicated handling circuit. I generally use specialist wet circuits with kerb-watering systems designed to maintain a consistent surface condition. ESC is disabled where possible so I can assess the tyre's natural balance, transient response, and limit behaviour without electronic intervention masking the result. I usually complete between two and five timed laps per tyre set, depending on the circuit, tyre type, and consistency of conditions. I exclude laps affected by clear driver error or obvious environmental inconsistency. Control runs are carried out frequently throughout the session, and I often use multiple sets of control tyres so that wear on the references does not become a meaningful variable.
Subj. Wet Handling
I also carry out a structured subjective handling assessment at the limit of adhesion on a dedicated wet handling circuit. I score steering precision, steering response, turn-in behaviour, mid-corner balance, aquaplaning resistance, breakaway characteristics, and overall confidence using a standardised 1–10 scale used consistently across my testing. The final assessment combines numeric scoring with written technical commentary. I complete familiarisation laps on the control tyre before evaluating each candidate.
Straight Aqua
To measure straight-line aquaplaning resistance, I drive one side of the vehicle through a water trough of controlled depth, typically around 7 mm, while the opposite side remains on dry pavement. I enter at a fixed speed and then accelerate progressively. I define aquaplaning onset as the point at which the wheel travelling through the water exceeds a specified slip threshold relative to the dry-side reference wheel. I usually perform four runs per tyre set and average the valid results.
Snow Braking
For snow braking, I drive the test vehicle at an entry speed of 50 km/h and apply full braking effort to a standstill with ABS active on a groomed, compacted snow surface, measuring 45-5 km/h. I generally use a wide VDA (vehicle dynamic area) and progressively move across the surface between runs so that no tyre ever brakes on the same piece of snow twice. My standard programme is twelve runs per tyre set, although the sequence can extend further if the data justify it. I analyse the full set of runs and discard statistical outliers before averaging. The surface is regularly groomed throughout the session. To correct for changing snow surface conditions, I run reference tyres repeatedly — typically every two candidate test sets.
Snow Handling
For snow handling, I drive at the limit of adhesion around a dedicated snow handling circuit with ESC disabled where possible. The circuit is groomed and prepared after every run while tyres are being changed, so each set runs on a consistently prepared surface. I usually complete between two and five timed laps per tyre set, excluding laps affected by clear driver error or obvious environmental inconsistency. Because snow surfaces degrade more rapidly than asphalt, control runs are carried out more frequently — typically every two candidate test sets.
Subj. Snow Handling
I also carry out a structured subjective handling assessment at the limit of adhesion on a dedicated snow handling circuit. The circuit is groomed and prepared after every run while tyres are being changed, so each set runs on a consistently prepared surface. I score steering precision, turn-in behaviour, mid-corner balance, corner-exit traction, breakaway characteristics, and overall confidence on snow using a standardised 1–10 scale used consistently across my testing. The final assessment combines numeric scoring with written technical commentary. I complete familiarisation laps on the control tyre before evaluating each candidate.
Dirt Handling
For dirt handling, I drive at the limit of adhesion around a dedicated dirt handling course with ESC typically disabled. I complete multiple timed laps per tyre set, excluding laps affected by driver error or environmental inconsistency. Because natural surfaces are inherently variable, I place particular emphasis on repeat runs, careful reference tracking, and averaged results. The control tyre is retested at regular intervals.
Subj. Dirt Handling
I also carry out a structured subjective handling assessment on a dedicated dirt course. I score steering feel, traction, stability, breakaway characteristics, and overall confidence using a standardised 1–10 scale used consistently across my testing. The final assessment combines numeric scoring with written technical commentary. I complete familiarisation laps on the control tyre before evaluating each candidate.
Subj. Comfort
To assess comfort, I drive on a wide range of road surfaces (often dedicated comfort tracks at test facilities) at speeds from 50 to 120 km/h, including smooth motorway, coarse surfaces, expansion joints, broken pavement, and sharp-edged obstacles. I evaluate primary ride quality, secondary ride quality, impact harshness, seat-transmitted vibration, and the tyre's ability to absorb sharp inputs. Ratings are assigned on a 1–10 scale relative to the reference tyre.
Subj. Noise
For subjective noise assessment, I drive at constant speeds across multiple surface types with the windows closed, ventilation off, and audio system off. I assess overall noise level, tonal quality, cavity boom, pattern noise, broadband roar, and sensitivity to both speed and road texture. Each tyre is rated on a 1–10 scale and supported by written observations on noise character and annoyance.
Off road
The test group included the BFGoodrich All Terrain KO2 (not the new KO3 as it wasn't available in this size), the new Falken Wildpeak AT4W, Kumho Roadventure AT52, Nitto Recon Grappler AT and Toyo Open Country AT. Testing took place on a rally cross course with packed dirt and muddy puddles, mostly in 3rd gear and RWD mode.

The Toyo and Nitto posted similar times - the Nitto had slightly more front-end bite, though this might have been down to surface conditions, so they scored equally. The Kumho finished just a second ahead, with good front grip but a firm feel even at 25 psi. This firmness made the rear less stable and hurt confidence when pushing hard, particularly during recovery. The Kumho also struggled more in the muddy sections.
The Falken and BFG were fastest in the dirt. The BFG set the quickest time with strong grip, especially during traction and braking, but its firm carcass made it hard work through bumps and undulations. The Falken might not have matched the BFG's front-end bite, but it was the most drivable of the group. It gave the most confidence to push hard and felt the most stable, making it the best overall package despite being slightly slower.
Dirt Handling
Dirt handling time in seconds
Lower is better ↓| Position / Tyre | Result | Gap to best |
|---|---|---|
| 71.73 s | Best | |
| 71.8 s | +0.07 s | |
| 72.61 s | +0.88 s | |
| 73.01 s | +1.28 s | |
| 73.11 s | +1.38 s |
All the tyres in the Dirt Handling test finished less than 3% apart.
Dry
More important for these tyres is how they feel on the road, so we focused on steering predictability, stability, noise and comfort. Testing included two different layouts and various sized impacts for comfort assessment.

The Toyo and Nitto again finished close on steering response and comfort, both feeling good to drive. The Toyo was much quieter - the Nitto produced notable noise at most speeds, both straight and turning. The Toyo stayed nearly silent at 50 mph but got noisier during high-speed runs.
The Kumho felt like a sports tyre, with sharp steering that seemed out of place on a truck tyre. It stayed quiet and offered good, if not great, comfort levels.
The BFGoodrich had the softest steering of the group and stayed quiet until higher speeds. Comfort was very good overall, with just some firmness over bigger bumps.
The Falken again did everything well. Pattern noise was minimal during fast runs, and while there was some tread noise in turns, it was among the best. Comfort levels were also good.
Dry Handling
Dry handling time in seconds
Lower is better ↓| Position / Tyre | Result | Gap to best |
|---|---|---|
| 47.72 s | Best | |
| 47.83 s | +0.11 s | |
| 47.92 s | +0.20 s | |
| 48.19 s | +0.47 s | |
| 48.48 s | +0.76 s |
All the tyres in the Dry Handling test finished less than 3% apart.
Subj. Road Score
Subjective Real World Driving Score
Higher is better ↑| Position / Tyre | Result | Gap to best |
|---|---|---|
| 10 Points | Best | |
| 9.5 Points | -0.50 Points | |
| 9 Points | -1.00 Points | |
| 9 Points | -1.00 Points | |
| 9 Points | -1.00 Points |
The difference between best and worst was 10% (1 Points).
In dry braking, the Falken led, followed by the Kumho. The Toyo and Nitto posted similar times, while the BFGoodrich had the longest stopping distance.
Dry Braking
Dry braking in meters (60 - 0 mph) [Average Temperature 83f]
Lower is better ↓| Position / Tyre | Result | Gap to best | Residual speed |
|---|---|---|---|
| 41.17 m | Best | 0 km/h | |
| 42.75 m | +1.58 m | 25 km/h | |
| 42.81 m | +1.64 m | 25 km/h | |
| 43.2 m | +2.03 m | 28 km/h | |
| 44.41 m | +3.24 m | 35 km/h |
The difference between best and worst was 7.9% (3.24 m ≈ 0.7 Car Lengths). From 130 km/h, the BFGoodrich All Terrain TA KO2 would still be travelling at 35 km/h when the Falken Wildpeak AT4W had stopped.
Residual speed is calculated from the measured braking distances, assuming constant deceleration; it is not a separate measurement.

Wet
The tyres split into two groups in wet testing. The Nitto, Toyo and BFGoodrich posted similar times, all showing lots of understeer with reduced corner-exit traction. While you can counter the understeer in a Raptor with throttle, that wasn't a realistic approach for the test track.

The Falken and Kumho formed the second group. The Kumho had the best outright grip in the wet, but like in the dirt, didn't offer the perfect balance for the Raptor. The Falken was slightly slower but had the best overall balance, with good feedback and confidence.
Wet Handling
Wet handling time in seconds
Lower is better ↓| Position / Tyre | Result | Gap to best |
|---|---|---|
| 55.69 s | Best | |
| 56.39 s | +0.70 s | |
| 57.15 s | +1.46 s | |
| 57.17 s | +1.48 s | |
| 57.18 s | +1.49 s |
All the tyres in the Wet Handling test finished less than 3% apart.
For wet braking, the Kumho led, with the BFGoodrich close behind, followed by the Falken. The Nitto beat the Toyo, which finished 11% behind the best - a noticeable gap in a heavy Raptor.
Wet Braking
Wet braking in meters (60 - 0 mph) [Average Temperature 84f]
Lower is better ↓| Position / Tyre | Result | Gap to best | Residual speed |
|---|---|---|---|
| 65.95 m | Best | 0 km/h | |
| 68.28 m | +2.33 m | 24 km/h | |
| 69.4 m | +3.45 m | 29 km/h | |
| 71.72 m | +5.77 m | 37 km/h | |
| 73.47 m | +7.52 m | 42 km/h |
The difference between best and worst was 11.4% (7.52 m ≈ 1.7 Car Lengths). From 130 km/h, the Toyo Open Country AT III would still be travelling at 42 km/h when the Kumho Road Venture AT52 had stopped.
Residual speed is calculated from the measured braking distances, assuming constant deceleration; it is not a separate measurement.
The Nitto won the aquaplaning test, with strong performances from the BFGoodrich and Falken.
Straight Aqua
Float Speed in Km/H
Higher is better ↑| Position / Tyre | Result | Gap to best |
|---|---|---|
| 115.2 km/h | Best | |
| 111.2 km/h | -4.00 km/h | |
| 108.9 km/h | -6.30 km/h | |
| 104.6 km/h | -10.60 km/h | |
| 100.2 km/h | -15.00 km/h |
The difference between best and worst was 13% (15 Km/H).
Snow
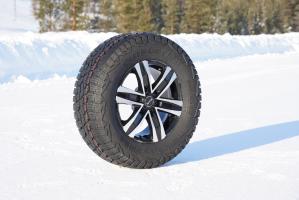
Snow testing proved difficult. Our usual test facility normally has deep snow, but we found just inches on arrival. After waiting several days, we got a small snowfall that quickly melted and refroze, leaving terrible test conditions. The Nitto wasn't included as it lacks a severe snow rating, and the limited running makes it hard to factor snow into the final results.

The BFGoodrich led snow braking, with the Toyo close behind, and the Kumho and Falken slightly further back. In handling, the Toyo edged the BFGoodrich, while the Kumho and Falken posted similar times. Falken told us they reduced snow performance slightly in the LT sizes of the AT4W to improve performance in other areas.
Snow Braking
Snow braking in meters (40 - 5 km/h)
Lower is better ↓| Position / Tyre | Result | Gap to best | Residual speed |
|---|---|---|---|
| 20.2 m | Best | 0 km/h | |
| 22.08 m | +1.88 m | 38 km/h | |
| 22.62 m | +2.42 m | 43 km/h | |
| 26.12 m | +5.92 m | 62 km/h |
The difference between best and worst was 29.3% (5.92 m ≈ 1.3 Car Lengths). From 130 km/h, the Falken Wildpeak AT4W would still be travelling at 62 km/h when the BFGoodrich All Terrain TA KO2 had stopped.
Residual speed is calculated from the measured braking distances, assuming constant deceleration; it is not a separate measurement.
Snow Handling
Snow handling time in seconds
Lower is better ↓| Position / Tyre | Result | Gap to best |
|---|---|---|
| 91.68 s | Best | |
| 92.02 s | +0.34 s | |
| 98.61 s | +6.93 s | |
| 101.27 s | +9.59 s |
The difference between best and worst was 10.5% (9.59 s).
Value
While purchase price matters, without wear testing it's not the whole story. Using the tread wear warranties, we calculated cost per 1000 miles. Despite the Kumho and Nitto having lower initial prices, the Falken's better warranty made it the most cost-effective over its lifespan.
Value
Dollars/1000 miles based on mileage warranty
Lower is better ↓| Position / Tyre | Result | Gap to best |
|---|---|---|
| 0.57 Price/1000 | Best | |
| 0.63 Price/1000 | +0.06 Price/1000 | |
| 0.68 Price/1000 | +0.11 Price/1000 | |
| 0.75 Price/1000 | +0.18 Price/1000 | |
| 0.82 Price/1000 | +0.25 Price/1000 |
The difference between best and worst was 43.9% (0.25 Price/1000).
Results
 The BEST All Terrain Tyre for 2025Watch the full video of this test on YouTube Watch on YouTube
Falken Wildpeak AT4W
35x12.5R17 125E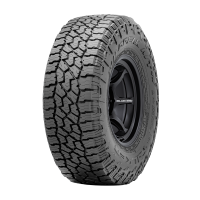
Category scores (% of best)
All discipline results (16)
Discipline positions compare the ranked tyres in this test, not the whole market. These are individual measurements, not weighted overall scores.
| Test | Position in discipline | Result | Gap to best |
|---|---|---|---|
| Dry BrakingLower is better | 1st / 5 | 41.17 m | Best in this discipline |
| Dry HandlingLower is better | 3rd / 5 | 47.92 s | +0.20 s |
| Subj. Dry HandlingHigher is better | 2nd / 5 | 9.5 Points | -0.50 Points |
| Subj. Road ScoreHigher is better | 1st / 5 | 10 Points | Best in this discipline |
| Wet BrakingLower is better | 3rd / 5 | 69.4 m | +3.45 m |
| Wet HandlingLower is better | 2nd / 5 | 56.39 s | +0.70 s |
| Subj. Wet HandlingHigher is better | 1st / 5 | 10 Points | Best in this discipline |
| Straight AquaHigher is better | 3rd / 5 | 108.9 km/h | -6.30 km/h |
| Snow BrakingLower is better | 4th / 4 | 26.12 m | +5.92 m |
| Snow HandlingLower is better | 4th / 4 | 101.27 s | +9.59 s |
| Subj. Snow HandlingHigher is better | 4th / 4 | 8 Points | -2.00 Points |
| Dirt HandlingLower is better | 2nd / 5 | 71.8 s | +0.07 s |
| Subj. Dirt HandlingHigher is better | 1st / 5 | 10 Points | Best in this discipline |
| Subj. ComfortHigher is better | 1st / 5 | 10 Points | Best in this discipline |
| Subj. NoiseHigher is better | 1st / 5 | 10 Points | Best in this discipline |
| ValueLower is better | 1st / 5 | 0.57 Price/1000 | Best in this discipline |
- 3PMSF
- Yes
- Weight
- 35.8 kgs
- Tread
- 14.6 mm
- Price
- 342.00
BFGoodrich All Terrain TA KO2
35x12.5R17 121E
Category scores (% of best)
All discipline results (16)
Discipline positions compare the ranked tyres in this test, not the whole market. These are individual measurements, not weighted overall scores.
| Test | Position in discipline | Result | Gap to best |
|---|---|---|---|
| Dry BrakingLower is better | 5th / 5 | 44.41 m | +3.24 m |
| Dry HandlingLower is better | 5th / 5 | 48.48 s | +0.76 s |
| Subj. Dry HandlingHigher is better | 2nd / 5 | 9.5 Points | -0.50 Points |
| Subj. Road ScoreHigher is better | 2nd / 5 | 9.5 Points | -0.50 Points |
| Wet BrakingLower is better | 2nd / 5 | 68.28 m | +2.33 m |
| Wet HandlingLower is better | 4th / 5 | 57.17 s | +1.48 s |
| Subj. Wet HandlingHigher is better | 3rd / 5 | 9.5 Points | -0.50 Points |
| Straight AquaHigher is better | 2nd / 5 | 111.2 km/h | -4.00 km/h |
| Snow BrakingLower is better | 1st / 4 | 20.2 m | Best in this discipline |
| Snow HandlingLower is better | 2nd / 4 | 92.02 s | +0.34 s |
| Subj. Snow HandlingHigher is better | 2nd / 4 | 9.5 Points | -0.50 Points |
| Dirt HandlingLower is better | 1st / 5 | 71.73 s | Best in this discipline |
| Subj. Dirt HandlingHigher is better | 2nd / 5 | 9.75 Points | -0.25 Points |
| Subj. ComfortHigher is better | 2nd / 5 | 9.5 Points | -0.50 Points |
| Subj. NoiseHigher is better | 2nd / 5 | 9.75 Points | -0.25 Points |
| ValueLower is better | 4th / 5 | 0.75 Price/1000 | +0.18 Price/1000 |
- 3PMSF
- Yes
- Weight
- 29.9 kgs
- Tread
- 11.7 mm
- Price
- 376.99
Kumho Road Venture AT52
35x12.5R17 121E
Category scores (% of best)
All discipline results (16)
Discipline positions compare the ranked tyres in this test, not the whole market. These are individual measurements, not weighted overall scores.
| Test | Position in discipline | Result | Gap to best |
|---|---|---|---|
| Dry BrakingLower is better | 2nd / 5 | 42.75 m | +1.58 m |
| Dry HandlingLower is better | 1st / 5 | 47.72 s | Best in this discipline |
| Subj. Dry HandlingHigher is better | 1st / 5 | 10 Points | Best in this discipline |
| Subj. Road ScoreHigher is better | 3rd / 5 | 9 Points | -1.00 Points |
| Wet BrakingLower is better | 1st / 5 | 65.95 m | Best in this discipline |
| Wet HandlingLower is better | 1st / 5 | 55.69 s | Best in this discipline |
| Subj. Wet HandlingHigher is better | 2nd / 5 | 9.75 Points | -0.25 Points |
| Straight AquaHigher is better | 5th / 5 | 100.2 km/h | -15.00 km/h |
| Snow BrakingLower is better | 3rd / 4 | 22.62 m | +2.42 m |
| Snow HandlingLower is better | 3rd / 4 | 98.61 s | +6.93 s |
| Subj. Snow HandlingHigher is better | 3rd / 4 | 8.5 Points | -1.50 Points |
| Dirt HandlingLower is better | 3rd / 5 | 72.61 s | +0.88 s |
| Subj. Dirt HandlingHigher is better | 3rd / 5 | 9 Points | -1.00 Points |
| Subj. ComfortHigher is better | 5th / 5 | 8.5 Points | -1.50 Points |
| Subj. NoiseHigher is better | 3rd / 5 | 9.5 Points | -0.50 Points |
| ValueLower is better | 2nd / 5 | 0.63 Price/1000 | +0.06 Price/1000 |
- 3PMSF
- Yes
- Weight
- 31.8 kgs
- Tread
- 12 mm
- Price
- 314.00
Toyo Open Country AT III
35x12.5R17 121E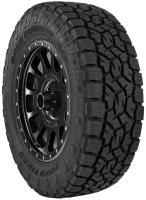
Category scores (% of best)
All discipline results (16)
Discipline positions compare the ranked tyres in this test, not the whole market. These are individual measurements, not weighted overall scores.
| Test | Position in discipline | Result | Gap to best |
|---|---|---|---|
| Dry BrakingLower is better | 3rd / 5 | 42.81 m | +1.64 m |
| Dry HandlingLower is better | 2nd / 5 | 47.83 s | +0.11 s |
| Subj. Dry HandlingHigher is better | 2nd / 5 | 9.5 Points | -0.50 Points |
| Subj. Road ScoreHigher is better | 3rd / 5 | 9 Points | -1.00 Points |
| Wet BrakingLower is better | 5th / 5 | 73.47 m | +7.52 m |
| Wet HandlingLower is better | 3rd / 5 | 57.15 s | +1.46 s |
| Subj. Wet HandlingHigher is better | 5th / 5 | 9.25 Points | -0.75 Points |
| Straight AquaHigher is better | 4th / 5 | 104.6 km/h | -10.60 km/h |
| Snow BrakingLower is better | 2nd / 4 | 22.08 m | +1.88 m |
| Snow HandlingLower is better | 1st / 4 | 91.68 s | Best in this discipline |
| Subj. Snow HandlingHigher is better | 1st / 4 | 10 Points | Best in this discipline |
| Dirt HandlingLower is better | 5th / 5 | 73.11 s | +1.38 s |
| Subj. Dirt HandlingHigher is better | 4th / 5 | 8.75 Points | -1.25 Points |
| Subj. ComfortHigher is better | 4th / 5 | 9 Points | -1.00 Points |
| Subj. NoiseHigher is better | 4th / 5 | 9.25 Points | -0.75 Points |
| ValueLower is better | 5th / 5 | 0.82 Price/1000 | +0.25 Price/1000 |
- 3PMSF
- Yes
- Weight
- 29.5 kgs
- Tread
- 13.2 mm
- Price
- 409.24
Nitto Recon Grappler AT
35x12.5R17 125R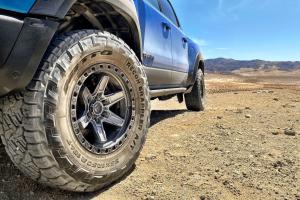
Category scores (% of best)
All discipline results (13)
Discipline positions compare the ranked tyres in this test, not the whole market. These are individual measurements, not weighted overall scores.
| Test | Position in discipline | Result | Gap to best |
|---|---|---|---|
| Dry BrakingLower is better | 4th / 5 | 43.2 m | +2.03 m |
| Dry HandlingLower is better | 4th / 5 | 48.19 s | +0.47 s |
| Subj. Dry HandlingHigher is better | 2nd / 5 | 9.5 Points | -0.50 Points |
| Subj. Road ScoreHigher is better | 3rd / 5 | 9 Points | -1.00 Points |
| Wet BrakingLower is better | 4th / 5 | 71.72 m | +5.77 m |
| Wet HandlingLower is better | 5th / 5 | 57.18 s | +1.49 s |
| Subj. Wet HandlingHigher is better | 3rd / 5 | 9.5 Points | -0.50 Points |
| Straight AquaHigher is better | 1st / 5 | 115.2 km/h | Best in this discipline |
| Dirt HandlingLower is better | 4th / 5 | 73.01 s | +1.28 s |
| Subj. Dirt HandlingHigher is better | 4th / 5 | 8.75 Points | -1.25 Points |
| Subj. ComfortHigher is better | 2nd / 5 | 9.5 Points | -0.50 Points |
| Subj. NoiseHigher is better | 5th / 5 | 8.5 Points | -1.50 Points |
| ValueLower is better | 3rd / 5 | 0.68 Price/1000 | +0.11 Price/1000 |
- Weight
- 29.9 kgs
- Tread
- 13.3 mm
- Price
- 372.00


One thing I would really like to see even on the more aggressive tires, even if it didn’t receive a weighting in the final score, is the rolling resistance.
Agreed!
How much worse is a tire like this - would love to know as it is 1/2 price: https://www.walmart.com/ip/Gladiator-X-Comp-A-T-LT-285-65R20-Load-E-10-Ply-AT-All-Terrain-Tire/820084509
Surely this test should have used the new bfg k03? I beleive its well improved over the K02.
I would also like to see the Geolandar at4 G018
It wasn't available in this test size at time of test.
Well, partly on the basis of this test (one of two I found), I bought these (Kumho AT 52, 31/10.5-15 fitted to a 1979 FJ 55 Landcruiser). Motivation was that I didn't require great off road performance (first gear 2WD high range around my paddocks is about as hard as it gets) but was interested in road handling & braking, especially in the wet, on bitumen roads when I use the Cruiser as a truck, carting or towing things.
In anecdotal reinforcement of Jonathan's remarks, it's a delight on these parameters of appraisal - decidedly the best tyre I have fitted in 25 years of use of the Cruiser.
Look forward to move feedback!
I really enjoy reading the reviews on this site and the youtube channel too, but I'm disappointed to see that the Nokian Outpost nAT isn't included in any all-terrain tire comparison against other AT tires, either in winter testing or all-around; I only saw a test against other Nokian tires in the snow, which is interesting, but frankly not helpful. I'm such a huge fan of Nokian winter tires that I want to see how their AT tires stack up against the competition, but having experience with their winter tires it's obvious to me that a dedicated winter tire will outperform an all-weather or all-terrain tire in snow and on ice (ok, I admit that it was interesting to see how it did against the all-weather, but I'm not shopping for that type of tire).
Stay tuned, something is coming with the nAT
Given that the Wrangler Duratrac tyres have lost their 3 Peak//Snowflake designation in some of their larger sizes (285/75R18 in particular), I've been weighing with replacing them with the Falken Wildpeaks, but I'm also a fan of the Nokian Outpost nATs. Of the two, which would you go for? I know you tested and were a fan of both, but I don't recall//see anything comparing the two directly for overall usability. The snow performance of the Nokians are drawing me to them, but at what cost for the other 3 seasons?
I'm not sure I'd be able to pick. The Falken is more proven in everything but snow.