

Bridgestone vs Pirelli
303 shared professional tests: Pirelli finished ahead in 177, Bridgestone in 123 and 3 were drawn. Owners rate Pirelli 7.2 and Bridgestone 7.1 out of 10 across 5,789 reviews.
The quick answer
 Bridgestone
Premium · 210 tyres on sale · Bridgestone Group
 Pirelli
Premium · 148 tyres on sale · Pirelli Group
Pirelli leads in more of the categories we measure. Built from every professional test both brands entered and every vetted owner review we hold for their tyres - the evidence is all further down the page. Data updated October 29, 2026.

Bridgestone vs Pirelli at a glance
Bridgestone and Pirelli are both premium brands with deep OE fitment and strong performance pedigrees, but they tend to win in different ways.
Looking at professional tests where both brands appear, Pirelli comes out ahead more often overall, while Bridgestone repeatedly posts stronger safety and efficiency-type numbers - particularly wet braking, rolling resistance and wear.
| Category | Bridgestone | Pirelli | Winner |
|---|---|---|---|
| Overall test record | 123 wins | 177 wins | Pirelli |
| Wet Braking | 39.72 m | 40.35 m | Bridgestone |
| Dry Braking | 38.87 m | 38.45 m | Pirelli |
| Snow Braking | 23.92 m | 24.31 m | Bridgestone |
| Rolling Resistance | 7.89 kg/t | 8.14 kg/t | Bridgestone |
| Noise | 71.64 dB | 71.09 dB | Pirelli |
| Tread life (wear tests) | 42,659 km | 39,264 km | Bridgestone |
| Price | cheaper in 64 of 104 tests | cheaper in 37 of 104 tests | Bridgestone |
| Overall owner score | 7.1 / 10 | 7.2 / 10 | Pirelli |
Head-to-head test record
Across 303 professional tests where both brands fielded a tyre, Pirelli finished ahead in 177 and Bridgestone in 123 (3 drew).
By season
| Category | shared tests | Bridgestone | Pirelli | draws |
|---|---|---|---|---|
| Summer | 148 | 57 | 89 | 2 |
| Winter | 100 | 49 | 51 | 0 |
| All Season | 50 | 16 | 33 | 1 |
| All Weather | 4 | 0 | 4 | 0 |
The cleanest comparison is the 287 shared tests where both brands fielded a tyre: Pirelli wins 164 to Bridgestone's 120, with 3 draws, and also has the higher average finishing percentile (64.3 vs 60.4). That points to Pirelli being more likely to place ahead when both turn up with their best-placed tyre in the same test, although the gap is not uniform across seasons - and in the last 5 years the head-to-head tightens to 54-48 (1 draw) in Pirelli's favour.
How we count: only tests entered by both brands are used, and each brand is represented by its best-placed tyre in that test. Owner-review and label figures cover the brands' full current ranges.
Performance by metric
Averaged across shared tests, which brand leads each measured discipline and by how much.
Bridgestone won 88 of 164 tests · 5.5% typical margin
Pirelli won 98 of 155 tests · 3.1% typical margin
Pirelli won 67 of 130 tests · 3.1% typical margin
Bridgestone won 77 of 120 tests · 8.8% typical margin
Pirelli won 70 of 101 tests · 1.4% typical margin
Bridgestone won 61 of 94 tests · 3.9% typical margin
Pirelli won 42 of 80 tests · 8.4% typical margin
Bridgestone won 43 of 69 tests · 1% typical margin
Bridgestone won 40 of 69 tests · 2.2% typical margin
Pirelli won 35 of 60 tests · 2.4% typical margin
Pirelli won 27 of 50 tests · 1.6% typical margin
Pirelli won 19 of 48 tests
Bridgestone won 32 of 52 tests · 6% typical margin
Bridgestone won 38 of 52 tests · 3.2% typical margin
Pirelli won 26 of 44 tests · 3.1% typical margin
Bridgestone won 25 of 43 tests · 3.8% typical margin
Bridgestone won 34 of 40 tests · 7.6% typical margin
Pirelli won 18 of 34 tests · 1.2% typical margin
Bridgestone won 13 of 25 tests · 3% typical margin
Bridgestone won 18 of 24 tests · 1.2% typical margin
Bridgestone won 16 of 24 tests · 2.1% typical margin
Bridgestone won 17 of 24 tests · 11.9% typical margin
Pirelli won 13 of 24 tests · 1.9% typical margin
Pirelli won 10 of 15 tests · 2.6% typical margin
Pirelli won 30 of 45 tests · 2.8% typical margin
Bridgestone won 29 of 45 tests · 4.7% typical margin
each won 19 of 38 tests
Pirelli won 25 of 36 tests · 3.9% typical margin
Pirelli won 17 of 34 tests · 6.9% typical margin
Pirelli won 23 of 29 tests · 7.3% typical margin
Pirelli won 22 of 28 tests · 1.2% typical margin
Pirelli won 18 of 22 tests · 6.6% typical margin
Pirelli won 12 of 21 tests · 1.4% typical margin
Bridgestone won 13 of 20 tests · 0.8% typical margin
Pirelli won 10 of 20 tests · 2% typical margin
Pirelli won 16 of 20 tests · 2% typical margin
Pirelli won 36 of 63 tests · 5.7% typical margin
Pirelli won 38 of 62 tests · 3.1% typical margin
Bridgestone won 25 of 49 tests · 2.1% typical margin
Bridgestone won 26 of 44 tests · 11.4% typical margin
Pirelli won 28 of 37 tests · 1.7% typical margin
Bridgestone won 16 of 27 tests · 2.8% typical margin
each won 12 of 25 tests
Bridgestone won 15 of 25 tests · 2.5% typical margin
Pirelli won 13 of 25 tests · 5.9% typical margin
Bridgestone won 11 of 22 tests · 1.2% typical margin
Pirelli won 11 of 18 tests
Bridgestone won 7 of 17 tests
By individual metrics, Bridgestone's most consistent advantages are stopping power and running costs: it leads Wet Braking (39.55 m vs 40.43 m, winning 85 of 149 comparisons), Rolling Resistance (7.9 vs 8.14 kg/t, 67-38 wins), Snow Braking (23.72 m vs 24.16 m, 52-26 wins), and Wear (42,195 km vs 38,406 km, 26-9 wins), and it also comes out ahead on Dry Handling measured in Km/H (105.24 vs 104.9, 39-22). Pirelli's clearest strengths are dry-road stopping and refinement: it leads Dry Braking (38.34 m vs 38.69 m, 87-51), Noise (71.05 dB vs 71.56 dB, 62-26), and shows edges in aquaplaning-related measures such as Straight Aqua (81.05 vs 80.65 Km/H, 61-55) and Curved Aquaplaning (6.69 vs 6.82 m/sec2, 37-33), plus many of the subjective scores (for example Subj. Dry Handling 27.72 vs 26.86 points, 25-9).
Typical margin is the average gap between the two brands within a single test. Test conditions vary, so it can be larger than the difference between the overall averages shown. Judged scores use a different scale in each test, so only the win record is comparable.
Which brand wins each season
Head-to-head test wins by season.
Pirelli leads 51 to 49 here
- Bridgestone strongest at
- Subj. Wet Handling
- Pirelli strongest at
- Subj. Noise
Pirelli leads 33 to 16 here
- Bridgestone strongest at
- Wear
- Pirelli strongest at
- Subj. Wet Handling
Pirelli leads 89 to 57 here
- Bridgestone strongest at
- Subj. Wet Handling
- Pirelli strongest at
- Subj. Dry Handling
Season is where the story changes. In Summer shared tests (147), Pirelli leads 89-56 with 2 draws, matching the per-metric summer pattern where Pirelli leads Wet Braking (36-27), Dry Braking (38-23) and Noise (28-7), while Bridgestone leads Straight Aqua (25-24), Rolling Resistance (26-18) and Wet Handling (15-10), with Dry Handling level at 12-12. In Winter (93), Bridgestone narrowly leads overall 48-45, and leads key winter metrics like Wet Braking (32-13), Snow Braking (33-10), Straight Aqua (23-15), Rolling Resistance (29-4) and Dry Handling (16-5), while Pirelli only leads Dry Braking (20-17) and Noise is effectively even (15-14). In All Season (43), Pirelli leads 27-15 with 1 draw, driven by advantages in aquaplaning, refinement and snow traction - Straight Aqua (21-7), Curved Aquaplaning (19-5), Noise (19-4) and Snow Traction (15-3) - while Bridgestone's big all-season counterweight is Wet Braking (26-12) and Snow Braking is split (16-16).
What owners say
Owner reviews, vetted by hand before publication and weighted by how many reviews each tyre has. Ownership is not verified.
Owner data is close overall, with Pirelli at 7.17 out of 10 from 2,351 reviews and Bridgestone at 7.08 from 3,334. On the two ownership signals that most strongly reflect long-term satisfaction, Pirelli is slightly ahead on Wear (6.95 vs 6.74) and Buy Again (6.28 vs 6.2), and it also scores higher for Comfort (7.12 vs 6.75) plus Snow and Ice confidence (Snow 7.45 vs 6.78, Ice 6.67 vs 6.05). Bridgestone owners rate Wet Grip a touch higher (7.26 vs 7.13) while Dry Grip is marginally higher for Pirelli (8.24 vs 8.18); Handling is tied at 7.3.
Price & value
How long each brand lasts, and how they compare on price.
Tread life (wear tests)
Bridgestone lasted longer in wear testing, winning 29 of 40 tests by an average of 18%.
Price
Bridgestone was the cheaper of the two in 64 of 104 shared tests.
On average Bridgestone cost about 1.9% less than Pirelli.
If you define value as cost per mile, Bridgestone's wear-test advantage is substantial: across 35 wear tests it averages 42,195 km vs Pirelli's 38,406 km, winning 26 comparisons to 9, which can materially lower replacement frequency. On price within shared tests, Bridgestone is also slightly cheaper on average - 1.5% lower than Pirelli across 92 samples - and is cheaper in more of those tests (55 vs 35). Put together, Bridgestone more often combines a lower test price with longer measured tread life, even though Pirelli may justify its pricing if your priorities are dry braking and cabin refinement.
Fuel economy & EU labels
Current range
How broad each brand's current line-up is.
Bridgestone
| Passenger Car | SUV / 4x4 | Motorcycle | Van | |
|---|---|---|---|---|
| Summer | 82 | 12 | 32 | 1 |
| All Season | 24 | 16 | 9 | 2 |
| Winter | 25 | 3 | - | 1 |
| All Weather | 2 | - | - | - |
Pirelli
| Passenger Car | SUV / 4x4 | Motorcycle | Van | |
|---|---|---|---|---|
| Summer | 49 | 8 | 20 | 3 |
| All Season | 17 | 16 | - | 2 |
| Winter | 24 | 5 | - | 1 |
| All Weather | 1 | 1 | - | - |
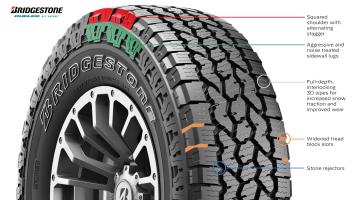
Bridgestone offers the broader catalogue overall with 201 active tyres and 5,543 total sizes, versus Pirelli's 147 active tyres and 5,045 sizes - that extra breadth increases the odds Bridgestone has a close match for niche fitments or specific priorities. Bridgestone's line-up is notably summer-heavy (129 summer patterns vs Pirelli's 80) and has more all-season patterns too (42 vs 35), while Pirelli is slightly deeper in winter patterns (30 vs 28) and has more EV-marketed tyres (3 vs 2) and more all-terrain options (6 vs 5).
Recommended picks per category
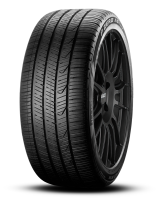
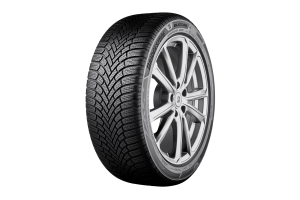
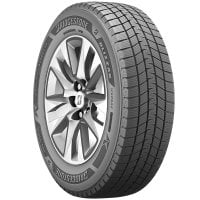
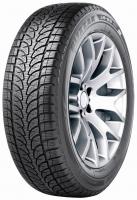
The top-rated current tyres from each brand, by season.
Summer
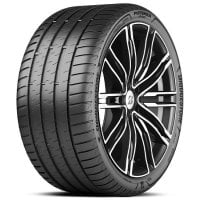

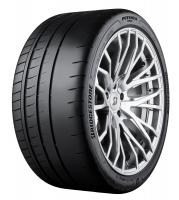

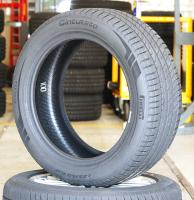
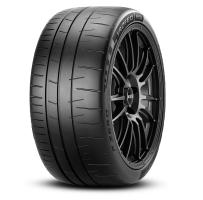
All Season

Winter
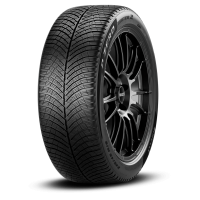

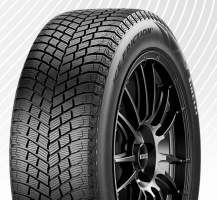
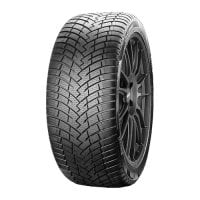
All Weather
Popular Bridgestone vs Pirelli tyre matchups
Head-to-head comparisons between specific tyres from these brands.
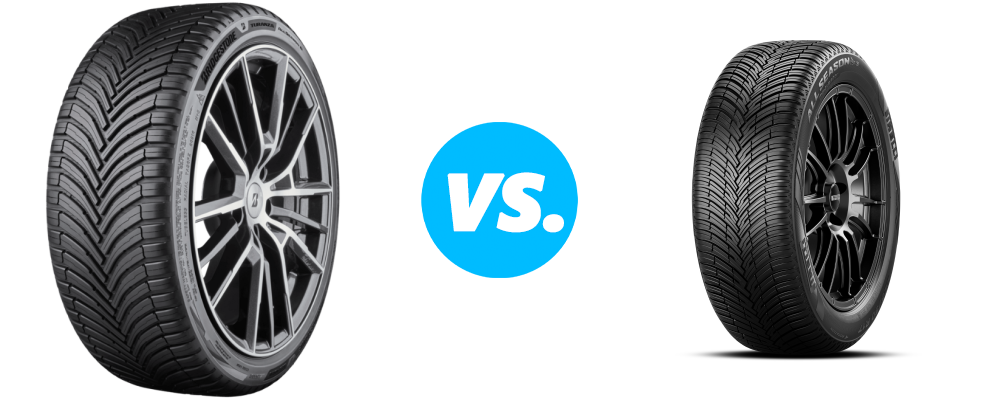 Bridgestone Turanza All Season 6 vs Pirelli Cinturato All Season SF3
 Bridgestone Potenza Sport vs Pirelli P Zero PZ4
 Bridgestone Turanza T005 vs Pirelli Cinturato P7 C2
 Bridgestone Potenza Sport vs Pirelli P Zero PZ5
 Bridgestone Blizzak 6 vs Pirelli Cinturato Winter 2
 Bridgestone Turanza 6 vs Pirelli Cinturato C3
Frequently asked questions
Is Bridgestone better than Pirelli?
Across 303 shared professional tests, Pirelli finished ahead of Bridgestone in 177 (3 drew), and holds a higher owner-review score of 7.2 vs 7.1 out of 10. Bridgestone leads on value.
Which is better in the wet, Bridgestone or Pirelli?
In Wet Braking, Bridgestone averaged 39.72 m versus 40.35 m, winning 88 of 164 shared tests. In Wet Handling, Bridgestone averaged 76.34 km/h versus 75.99 km/h, winning 40 of 69 shared tests.
Which lasts longer, Bridgestone or Pirelli?
In independent tyre wear testing across 40 shared tests, Bridgestone lasted longer, averaging 42,659 km versus 39,264 km (about 18% further) and winning 29 of them. Owners rate Pirelli tread life a little higher, however, at 7 vs 6.7 out of 10.
Which is cheaper, Bridgestone or Pirelli?
Bridgestone is usually the cheaper choice, coming in lower in 64 of 104 shared tests, on average about 1.9% less than Pirelli.
Which is better in winter, Bridgestone or Pirelli?
Across 100 shared winter tests, Pirelli finished ahead in 51. 34% of its current range is 3PMSF winter-certified, versus 33% for Bridgestone. In Snow Braking, Bridgestone averaged 23.92 m versus 24.31 m, winning 61 of 94 shared tests.
Which brand is more fuel efficient, Bridgestone or Pirelli?
Fuel economy and EV range come down to rolling resistance. In Rolling Resistance, Bridgestone averaged 7.89 kg/t versus 8.14 kg/t, winning 77 of 120 shared tests. 34% of Bridgestone's current range earns an A or B EU fuel-efficiency grade, versus 36% for Pirelli.
Which is better for electric cars, Bridgestone or Pirelli?
For an EV the priorities are low rolling resistance for range and low noise for a quiet cabin. In rolling-resistance testing, which directly drives EV range, Bridgestone led 77 of 120 shared tests. Pirelli also currently lists 3 EV-specific tyres versus 2 for Bridgestone.
Which brand is quieter and more comfortable, Bridgestone or Pirelli?
Owners rate Pirelli higher for comfort, at 7.1 vs 6.7 out of 10. In Noise, Pirelli averaged 71.09 dB versus 71.64 dB, winning 70 of 101 shared tests.
Would owners buy Bridgestone or Pirelli again?
Pirelli owners are more likely to buy the same brand again, scoring 6.3 vs 6.2 out of 10 on would-buy-again across 5,789 combined reviews.
Final verdict
Category-by-category, Pirelli more often finishes ahead when both brands compete in the same test (164-120), and it is particularly strong in summer and all-season comparisons where dry braking and noise tend to decide rankings. Bridgestone's clearer wins are in metrics that reduce risk and running costs - wet braking, snow braking, rolling resistance, and especially wear life.
Overall lean: Pirelli leads in more performance and refinement categories and wins more shared tests, while Bridgestone looks like the more value-robust choice thanks to longer measured longevity (42,195 km vs 38,406 km) and a slightly lower average price in shared tests (-1.5%). Choose Pirelli if your priority is dry-road stopping, quieter running and stronger summer/all-season test outcomes; choose Bridgestone if you want wet and winter-oriented reassurance, lower rolling resistance and fewer replacements over time, plus the broader range of fitments.