



For 2024 ADAC have tested two sizes of winter tyres. The below test covers the 16" version. There's nothing particularly shocking in the overall results, so enjoy the data, which includes wear, below!
Test setup & methodology
The test setting, the conditions recorded and how the results contribute to the score.
Recorded test conditions
Recorded test conditions
- Dry Braking
- 100 → 0 km/h
- Wet Braking
- 80 → 0 km/h
- Wet Braking - Concrete
- 80 → 0 km/h
- Snow Braking
- 30 → 0 km/h
- Ice Braking
- 20 → 0 km/h
Dry
The Falken EUROWINTER HS02 performed best in dry braking, stopping in 43.3 meters. The worst performer was the Winrun Winter max A1 WR22, taking 46.5 meters to stop - a difference of 3.2 meters. Most tyres clustered between 44-46 meters, with the top 3 (Falken, Nokian, and Goodyear) showing noticeably shorter braking distances.
Dry Braking
Dry braking in meters (100 - 0 km/h)
Lower is better ↓| Position / Tyre | Result | Gap to best | Residual speed |
|---|---|---|---|
| 43.3 m | Best | 0 km/h | |
| 44.1 m | +0.80 m | 18 km/h | |
| 44.2 m | +0.90 m | 19 km/h | |
| 44.5 m | +1.20 m | 21 km/h | |
| 44.7 m | +1.40 m | 23 km/h | |
| 45.2 m | +1.90 m | 27 km/h | |
| 45.5 m | +2.20 m | 29 km/h | |
| 45.6 m | +2.30 m | 29 km/h | |
| 45.7 m | +2.40 m | 30 km/h | |
| 45.8 m | +2.50 m | 30 km/h | |
| 46 m | +2.70 m | 31 km/h | |
| 46.5 m | +3.20 m | 34 km/h |
The difference between best and worst was 7.4% (3.2 m ≈ 0.7 Car Lengths). From 130 km/h, the Winrun Winter max A1 WR22 would still be travelling at 34 km/h when the Falken EUROWINTER HS02 had stopped.
Residual speed is calculated from the measured braking distances, assuming constant deceleration; it is not a separate measurement.
Wet
In wet braking, there was a tie for first place between the Continental WinterContact TS 870 and Pirelli Cinturato Winter 2, both stopping in 35.1 meters. The worst performer was the Winrun Winter max A1 WR22 at 40.7 meters - a significant 5.6 meter difference. The top 5 tyres were closely grouped within 0.8 meters of each other, while there was a clear performance drop-off for the bottom 3 tyres.
Wet Braking
Wet braking in meters (80 - 0 km/h)
Lower is better ↓| Position / Tyre | Result | Gap to best | Residual speed |
|---|---|---|---|
| 35.1 m | Best | 0 km/h | |
| 35.1 m | Best | 0 km/h | |
| 35.4 m | +0.30 m | 12 km/h | |
| 35.5 m | +0.40 m | 14 km/h | |
| 35.9 m | +0.80 m | 19 km/h | |
| 36.1 m | +1.00 m | 22 km/h | |
| 36.4 m | +1.30 m | 25 km/h | |
| 36.9 m | +1.80 m | 29 km/h | |
| 37.1 m | +2.00 m | 30 km/h | |
| 37.2 m | +2.10 m | 31 km/h | |
| 39.7 m | +4.60 m | 44 km/h | |
| 40.7 m | +5.60 m | 48 km/h |
The difference between best and worst was 16% (5.6 m ≈ 1.2 Car Lengths). From 130 km/h, the Winrun Winter max A1 WR22 would still be travelling at 48 km/h when the Continental WinterContact TS 870 had stopped.
Residual speed is calculated from the measured braking distances, assuming constant deceleration; it is not a separate measurement.
On concrete in wet conditions, the Continental WinterContact TS 870 performed best, stopping in 38.5 meters. The Winrun Winter max A1 WR22 again performed worst, taking 46.6 meters - a substantial 8.1 meter difference. There was a noticeable performance gap between the top 4 tyres and the rest of the field.
Wet Braking - Concrete
Wet braking on Concrete in meters (80 - 0 km/h)
Lower is better ↓| Position / Tyre | Result | Gap to best | Residual speed |
|---|---|---|---|
| 38.5 m | Best | 0 km/h | |
| 39 m | +0.50 m | 15 km/h | |
| 39.1 m | +0.60 m | 16 km/h | |
| 39.2 m | +0.70 m | 17 km/h | |
| 40.2 m | +1.70 m | 27 km/h | |
| 40.3 m | +1.80 m | 27 km/h | |
| 41 m | +2.50 m | 32 km/h | |
| 41.7 m | +3.20 m | 36 km/h | |
| 42.1 m | +3.60 m | 38 km/h | |
| 42.3 m | +3.80 m | 39 km/h | |
| 44.3 m | +5.80 m | 47 km/h | |
| 46.6 m | +8.10 m | 54 km/h |
The difference between best and worst was 21% (8.1 m ≈ 1.8 Car Lengths). From 130 km/h, the Winrun Winter max A1 WR22 would still be travelling at 54 km/h when the Continental WinterContact TS 870 had stopped.
Residual speed is calculated from the measured braking distances, assuming constant deceleration; it is not a separate measurement.
The Hankook Winter I cept RS3 performed best in straight aquaplaning, maintaining control up to 84.4 km/h. The worst performer was the Zeetex WH 1000 at 68.9 km/h - a significant 15.5 km/h difference. There was a clear performance divide, with the top 7 tyres maintaining control above 80 km/h, while the bottom 5 dropped below 77 km/h.
Straight Aqua
Float Speed in Km/H
Higher is better ↑| Position / Tyre | Result | Gap to best |
|---|---|---|
| 84.4 km/h | Best | |
| 84 km/h | -0.40 km/h | |
| 83.1 km/h | -1.30 km/h | |
| 81 km/h | -3.40 km/h | |
| 80.7 km/h | -3.70 km/h | |
| 80.6 km/h | -3.80 km/h | |
| 80.4 km/h | -4.00 km/h | |
| 77.2 km/h | -7.20 km/h | |
| 76.5 km/h | -7.90 km/h | |
| 76.1 km/h | -8.30 km/h | |
| 69 km/h | -15.40 km/h | |
| 68.9 km/h | -15.50 km/h |
The difference between best and worst was 18.4% (15.5 Km/H).
In curved aquaplaning, the Continental WinterContact TS 870 performed best with 3.7 m/sec2 of lateral acceleration. The Zeetex WH 1000 and Winrun Winter max A1 WR22 tied for worst at 2.4 m/sec2 - a difference of 1.3 m/sec2. There was a notable performance gap between the top 5 tyres and the rest of the field.
Curved Aquaplaning
Remaining lateral acceleration
Higher is better ↑| Position / Tyre | Result | Gap to best |
|---|---|---|
| 3.7 m/sec2 | Best | |
| 3.6 m/sec2 | -0.10 m/sec2 | |
| 3.6 m/sec2 | -0.10 m/sec2 | |
| 3.6 m/sec2 | -0.10 m/sec2 | |
| 3.6 m/sec2 | -0.10 m/sec2 | |
| 3.3 m/sec2 | -0.40 m/sec2 | |
| 3.3 m/sec2 | -0.40 m/sec2 | |
| 3.2 m/sec2 | -0.50 m/sec2 | |
| 3 m/sec2 | -0.70 m/sec2 | |
| 2.9 m/sec2 | -0.80 m/sec2 | |
| 2.4 m/sec2 | -1.30 m/sec2 | |
| 2.4 m/sec2 | -1.30 m/sec2 |
The difference between best and worst was 35.1% (1.3 m/sec2).
Snow
The Continental WinterContact TS 870 and Dunlop Winter Sport 5 tied for best snow braking performance, stopping in 9.9 meters. The Zeetex WH 1000 and Falken EUROWINTER HS02 tied for worst at 11.0 meters - a difference of 1.1 meters. Most tyres performed relatively closely, with only 1.1 meters separating the best from worst.
Snow Braking
Snow braking in meters (30 - 0 km/h)
Lower is better ↓| Position / Tyre | Result | Gap to best | Residual speed |
|---|---|---|---|
| 9.9 m | Best | 0 km/h | |
| 9.9 m | Best | 0 km/h | |
| 10 m | +0.10 m | 13 km/h | |
| 10.1 m | +0.20 m | 18 km/h | |
| 10.1 m | +0.20 m | 18 km/h | |
| 10.2 m | +0.30 m | 22 km/h | |
| 10.2 m | +0.30 m | 22 km/h | |
| 10.3 m | +0.40 m | 26 km/h | |
| 10.3 m | +0.40 m | 26 km/h | |
| 10.5 m | +0.60 m | 31 km/h | |
| 11 m | +1.10 m | 41 km/h | |
| 11 m | +1.10 m | 41 km/h |
The difference between best and worst was 11.1% (1.1 m). From 130 km/h, the Falken EUROWINTER HS02 would still be travelling at 41 km/h when the Dunlop Winter Sport 5 had stopped.
Residual speed is calculated from the measured braking distances, assuming constant deceleration; it is not a separate measurement.
The Michelin Alpin 6 provided the best snow traction at 236 N. The Zeetex WH 1000 performed worst at 208 N - a difference of 28 N. There was a clear performance divide, with the top 9 tyres providing over 229 N of traction, while the bottom 3 dropped below 222 N.
Snow Traction
Pulling Force in Newtons
Higher is better ↑| Position / Tyre | Result | Gap to best |
|---|---|---|
| 236 N | Best | |
| 235 N | -1.00 N | |
| 235 N | -1.00 N | |
| 233 N | -3.00 N | |
| 233 N | -3.00 N | |
| 231 N | -5.00 N | |
| 231 N | -5.00 N | |
| 230 N | -6.00 N | |
| 229 N | -7.00 N | |
| 222 N | -14.00 N | |
| 216 N | -20.00 N | |
| 208 N | -28.00 N |
The difference between best and worst was 11.9% (28 N).
Ice
On ice, the Continental WinterContact TS 870 performed best, stopping in 18.3 meters. The Nokian Snowproof 2 performed worst at 21.6 meters - a difference of 3.3 meters. There was a notable performance gap between the top 6 tyres and the rest of the field.
Ice Braking
Ice braking in meters (20 - 0 km/h)
Lower is better ↓| Position / Tyre | Result | Gap to best | Residual speed |
|---|---|---|---|
| 18.3 m | Best | 0 km/h | |
| 19.1 m | +0.80 m | 27 km/h | |
| 19.4 m | +1.10 m | 31 km/h | |
| 19.4 m | +1.10 m | 31 km/h | |
| 19.4 m | +1.10 m | 31 km/h | |
| 19.8 m | +1.50 m | 36 km/h | |
| 20 m | +1.70 m | 38 km/h | |
| 20 m | +1.70 m | 38 km/h | |
| 20.3 m | +2.00 m | 41 km/h | |
| 20.8 m | +2.50 m | 45 km/h | |
| 21.2 m | +2.90 m | 48 km/h | |
| 21.6 m | +3.30 m | 51 km/h |
The difference between best and worst was 18% (3.3 m ≈ 0.7 Car Lengths). From 130 km/h, the Nokian Snowproof 2 would still be travelling at 51 km/h when the Continental WinterContact TS 870 had stopped.
Residual speed is calculated from the measured braking distances, assuming constant deceleration; it is not a separate measurement.

Comfort
The Vredestein Wintrac was the quietest tyre at 70.4 dB. The Dunlop Winter Sport 5 was the noisiest at 73.0 dB - a difference of 2.6 dB. Most tyres performed relatively closely, with only 2.6 dB separating the quietest from the noisiest.
Noise
External noise in dB
Lower is better ↓| Position / Tyre | Result | Gap to best |
|---|---|---|
| 70.4 dB | Best | |
| 70.9 dB | +0.50 dB | |
| 71 dB | +0.60 dB | |
| 71.1 dB | +0.70 dB | |
| 71.2 dB | +0.80 dB | |
| 71.3 dB | +0.90 dB | |
| 71.6 dB | +1.20 dB | |
| 71.7 dB | +1.30 dB | |
| 71.9 dB | +1.50 dB | |
| 72 dB | +1.60 dB | |
| 72.5 dB | +2.10 dB | |
| 73 dB | +2.60 dB |
The difference between best and worst was 3.7% (2.6 dB).
Value
The Michelin Alpin 6 showed the best projected tread life at 53,200 km. The Vredestein Wintrac had the shortest projected life at 33,400 km - a significant difference of 19,800 km. There was a wide range of performance, with clear tiers of durability among the tested tyres.
Wear
Predicted tread life in KM
Higher is better ↑| Position / Tyre | Result | Gap to best |
|---|---|---|
| 53,200 KM | Best | |
| 52,800 KM | -400 KM | |
| 49,100 KM | -4,100 KM | |
| 48,700 KM | -4,500 KM | |
| 47,000 KM | -6,200 KM | |
| 44,100 KM | -9,100 KM | |
| 43,800 KM | -9,400 KM | |
| 42,300 KM | -10,900 KM | |
| 38,500 KM | -14,700 KM | |
| 37,100 KM | -16,100 KM | |
| 34,000 KM | -19,200 KM | |
| 33,400 KM | -19,800 KM |
The difference between best and worst was 37.2% (19,800 KM).
Several tyres tied for best fuel consumption at 5.1 l/100km. The worst performers (including Zeetex WH 1000 and Winrun Winter max A1 WR22) consumed 5.2 l/100km - a minor 0.1 l/100km difference. Overall, fuel consumption was very similar across all tested tyres.
Fuel Consumption
Fuel consumption in Litres per 100 km
Lower is better ↓| Position / Tyre | Result | Gap to best | Extra fuel / year |
|---|---|---|---|
| 5.1 l/100km | Best | £0 | |
| 5.1 l/100km | Best | £0 | |
| 5.1 l/100km | Best | £0 | |
| 5.1 l/100km | Best | £0 | |
| 5.1 l/100km | Best | £0 | |
| 5.1 l/100km | Best | £0 | |
| 5.2 l/100km | +0.10 l/100km | £28 | |
| 5.2 l/100km | +0.10 l/100km | £28 | |
| 5.2 l/100km | +0.10 l/100km | £28 | |
| 5.2 l/100km | +0.10 l/100km | £28 | |
| 5.2 l/100km | +0.10 l/100km | £28 | |
| 5.2 l/100km | +0.10 l/100km | £28 |
All the tyres in the Fuel Consumption test finished less than 3% apart. Over 19,000 km a year at £1.45/L, the Michelin Alpin 6 uses about 19 L (£28) more fuel than the Dunlop Winter Sport 5.
Adjust the assumptions
Calculated estimates, not additional measurements. Use the controls to explore the assumptions.
The Hankook Winter I cept RS3 and Michelin Alpin 6 tied for best (lowest) abrasion at 48 mg/km/t. The Pirelli Cinturato Winter 2 had the highest abrasion at 79 mg/km/t - a significant difference of 31 mg/km/t. There was a wide range of performance, with clear groupings of tyres at different abrasion levels.
Abrasion
Weight of Tyre Wear Particles Lost (mg/km/t)
Lower is better ↓| Position / Tyre | Result | Gap to best |
|---|---|---|
| 48 mg/km/t | Best | |
| 48 mg/km/t | Best | |
| 57 mg/km/t | +9.00 mg/km/t | |
| 57 mg/km/t | +9.00 mg/km/t | |
| 59 mg/km/t | +11.00 mg/km/t | |
| 61 mg/km/t | +13.00 mg/km/t | |
| 62 mg/km/t | +14.00 mg/km/t | |
| 71 mg/km/t | +23.00 mg/km/t | |
| 72 mg/km/t | +24.00 mg/km/t | |
| 72 mg/km/t | +24.00 mg/km/t | |
| 72 mg/km/t | +24.00 mg/km/t | |
| 79 mg/km/t | +31.00 mg/km/t |
The difference between best and worst was 64.6% (31 mg/km/t).
Results
Continental WinterContact TS 870
205/55 R16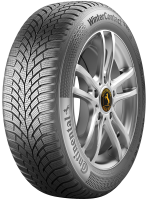
Category scores (% of best)
All discipline results (12)
Discipline positions compare the ranked tyres in this test, not the whole market. These are individual measurements, not weighted overall scores.
| Test | Position in discipline | Result | Gap to best |
|---|---|---|---|
| Dry BrakingLower is better | 5th / 12 | 44.7 m | +1.40 m |
| Wet BrakingLower is better | 1st / 12 | 35.1 m | Best in this discipline |
| Wet Braking - ConcreteLower is better | 1st / 12 | 38.5 m | Best in this discipline |
| Straight AquaHigher is better | 2nd / 12 | 84 km/h | -0.40 km/h |
| Curved AquaplaningHigher is better | 1st / 12 | 3.7 m/sec2 | Best in this discipline |
| Snow BrakingLower is better | 1st / 12 | 9.9 m | Best in this discipline |
| Snow TractionHigher is better | 9th / 12 | 229 N | -7.00 N |
| Ice BrakingLower is better | 1st / 12 | 18.3 m | Best in this discipline |
| NoiseLower is better | 4th / 12 | 71.1 dB | +0.70 dB |
| WearHigher is better | 7th / 12 | 43800 KM | -9,400.00 KM |
| Fuel ConsumptionLower is better | 1st / 12 | 5.1 l/100km | Best in this discipline |
| AbrasionLower is better | 5th / 12 | 59 mg/km/t | +11.00 mg/km/t |
- 3PMSF
- Yes
- Weight
- 8.4 kgs
Goodyear UltraGrip Performance 3
205/55 R16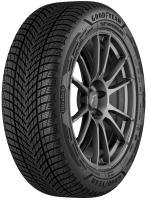
Category scores (% of best)
All discipline results (12)
Discipline positions compare the ranked tyres in this test, not the whole market. These are individual measurements, not weighted overall scores.
| Test | Position in discipline | Result | Gap to best |
|---|---|---|---|
| Dry BrakingLower is better | 3rd / 12 | 44.2 m | +0.90 m |
| Wet BrakingLower is better | 4th / 12 | 35.5 m | +0.40 m |
| Wet Braking - ConcreteLower is better | 4th / 12 | 39.2 m | +0.70 m |
| Straight AquaHigher is better | 3rd / 12 | 83.1 km/h | -1.30 km/h |
| Curved AquaplaningHigher is better | 2nd / 12 | 3.6 m/sec2 | -0.10 m/sec2 |
| Snow BrakingLower is better | 4th / 12 | 10.1 m | +0.20 m |
| Snow TractionHigher is better | 6th / 12 | 231 N | -5.00 N |
| Ice BrakingLower is better | 11th / 12 | 21.2 m | +2.90 m |
| NoiseLower is better | 5th / 12 | 71.2 dB | +0.80 dB |
| WearHigher is better | 3rd / 12 | 49100 KM | -4,100.00 KM |
| Fuel ConsumptionLower is better | 7th / 12 | 5.2 l/100km | +0.10 l/100km |
| AbrasionLower is better | 3rd / 12 | 57 mg/km/t | +9.00 mg/km/t |
- 3PMSF
- Yes
- Weight
- 8 kgs
Michelin Alpin 6
205/55 R16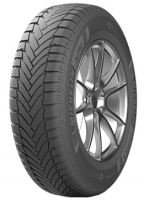
Category scores (% of best)
All discipline results (12)
Discipline positions compare the ranked tyres in this test, not the whole market. These are individual measurements, not weighted overall scores.
| Test | Position in discipline | Result | Gap to best |
|---|---|---|---|
| Dry BrakingLower is better | 7th / 12 | 45.5 m | +2.20 m |
| Wet BrakingLower is better | 3rd / 12 | 35.4 m | +0.30 m |
| Wet Braking - ConcreteLower is better | 3rd / 12 | 39.1 m | +0.60 m |
| Straight AquaHigher is better | 8th / 12 | 77.2 km/h | -7.20 km/h |
| Curved AquaplaningHigher is better | 8th / 12 | 3.2 m/sec2 | -0.50 m/sec2 |
| Snow BrakingLower is better | 8th / 12 | 10.3 m | +0.40 m |
| Snow TractionHigher is better | 1st / 12 | 236 N | Best in this discipline |
| Ice BrakingLower is better | 10th / 12 | 20.8 m | +2.50 m |
| NoiseLower is better | 9th / 12 | 71.9 dB | +1.50 dB |
| WearHigher is better | 1st / 12 | 53200 KM | Best in this discipline |
| Fuel ConsumptionLower is better | 7th / 12 | 5.2 l/100km | +0.10 l/100km |
| AbrasionLower is better | 1st / 12 | 48 mg/km/t | Best in this discipline |
- 3PMSF
- Yes
- Weight
- 8.2 kgs
Hankook Winter I cept RS3
205/55 R16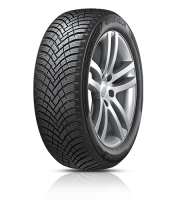
Category scores (% of best)
All discipline results (12)
Discipline positions compare the ranked tyres in this test, not the whole market. These are individual measurements, not weighted overall scores.
| Test | Position in discipline | Result | Gap to best |
|---|---|---|---|
| Dry BrakingLower is better | 9th / 12 | 45.7 m | +2.40 m |
| Wet BrakingLower is better | 9th / 12 | 37.1 m | +2.00 m |
| Wet Braking - ConcreteLower is better | 9th / 12 | 42.1 m | +3.60 m |
| Straight AquaHigher is better | 1st / 12 | 84.4 km/h | Best in this discipline |
| Curved AquaplaningHigher is better | 2nd / 12 | 3.6 m/sec2 | -0.10 m/sec2 |
| Snow BrakingLower is better | 3rd / 12 | 10 m | +0.10 m |
| Snow TractionHigher is better | 4th / 12 | 233 N | -3.00 N |
| Ice BrakingLower is better | 6th / 12 | 19.8 m | +1.50 m |
| NoiseLower is better | 8th / 12 | 71.7 dB | +1.30 dB |
| WearHigher is better | 2nd / 12 | 52800 KM | -400.00 KM |
| Fuel ConsumptionLower is better | 1st / 12 | 5.1 l/100km | Best in this discipline |
| AbrasionLower is better | 1st / 12 | 48 mg/km/t | Best in this discipline |
- 3PMSF
- Yes
- Weight
- 8.4 kgs
Dunlop Winter Sport 5
205/55 R16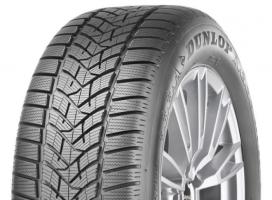
Category scores (% of best)
All discipline results (12)
Discipline positions compare the ranked tyres in this test, not the whole market. These are individual measurements, not weighted overall scores.
| Test | Position in discipline | Result | Gap to best |
|---|---|---|---|
| Dry BrakingLower is better | 8th / 12 | 45.6 m | +2.30 m |
| Wet BrakingLower is better | 10th / 12 | 37.2 m | +2.10 m |
| Wet Braking - ConcreteLower is better | 8th / 12 | 41.7 m | +3.20 m |
| Straight AquaHigher is better | 9th / 12 | 76.5 km/h | -7.90 km/h |
| Curved AquaplaningHigher is better | 2nd / 12 | 3.6 m/sec2 | -0.10 m/sec2 |
| Snow BrakingLower is better | 1st / 12 | 9.9 m | Best in this discipline |
| Snow TractionHigher is better | 2nd / 12 | 235 N | -1.00 N |
| Ice BrakingLower is better | 7th / 12 | 20 m | +1.70 m |
| NoiseLower is better | 12th / 12 | 73 dB | +2.60 dB |
| WearHigher is better | 4th / 12 | 48700 KM | -4,500.00 KM |
| Fuel ConsumptionLower is better | 1st / 12 | 5.1 l/100km | Best in this discipline |
| AbrasionLower is better | 3rd / 12 | 57 mg/km/t | +9.00 mg/km/t |
- 3PMSF
- Yes
- Weight
- 8.2 kgs
Nokian Snowproof 2
205/55 R16
Category scores (% of best)
All discipline results (12)
Discipline positions compare the ranked tyres in this test, not the whole market. These are individual measurements, not weighted overall scores.
| Test | Position in discipline | Result | Gap to best |
|---|---|---|---|
| Dry BrakingLower is better | 2nd / 12 | 44.1 m | +0.80 m |
| Wet BrakingLower is better | 7th / 12 | 36.4 m | +1.30 m |
| Wet Braking - ConcreteLower is better | 7th / 12 | 41 m | +2.50 m |
| Straight AquaHigher is better | 5th / 12 | 80.7 km/h | -3.70 km/h |
| Curved AquaplaningHigher is better | 2nd / 12 | 3.6 m/sec2 | -0.10 m/sec2 |
| Snow BrakingLower is better | 6th / 12 | 10.2 m | +0.30 m |
| Snow TractionHigher is better | 10th / 12 | 222 N | -14.00 N |
| Ice BrakingLower is better | 12th / 12 | 21.6 m | +3.30 m |
| NoiseLower is better | 11th / 12 | 72.5 dB | +2.10 dB |
| WearHigher is better | 9th / 12 | 38500 KM | -14,700.00 KM |
| Fuel ConsumptionLower is better | 1st / 12 | 5.1 l/100km | Best in this discipline |
| AbrasionLower is better | 7th / 12 | 62 mg/km/t | +14.00 mg/km/t |
- 3PMSF
- Yes
- Weight
- 8.2 kgs
Falken EUROWINTER HS02
205/55 R16
Category scores (% of best)
All discipline results (12)
Discipline positions compare the ranked tyres in this test, not the whole market. These are individual measurements, not weighted overall scores.
| Test | Position in discipline | Result | Gap to best |
|---|---|---|---|
| Dry BrakingLower is better | 1st / 12 | 43.3 m | Best in this discipline |
| Wet BrakingLower is better | 5th / 12 | 35.9 m | +0.80 m |
| Wet Braking - ConcreteLower is better | 5th / 12 | 40.2 m | +1.70 m |
| Straight AquaHigher is better | 7th / 12 | 80.4 km/h | -4.00 km/h |
| Curved AquaplaningHigher is better | 6th / 12 | 3.3 m/sec2 | -0.40 m/sec2 |
| Snow BrakingLower is better | 11th / 12 | 11 m | +1.10 m |
| Snow TractionHigher is better | 11th / 12 | 216 N | -20.00 N |
| Ice BrakingLower is better | 3rd / 12 | 19.4 m | +1.10 m |
| NoiseLower is better | 3rd / 12 | 71 dB | +0.60 dB |
| WearHigher is better | 8th / 12 | 42300 KM | -10,900.00 KM |
| Fuel ConsumptionLower is better | 7th / 12 | 5.2 l/100km | +0.10 l/100km |
| AbrasionLower is better | 8th / 12 | 71 mg/km/t | +23.00 mg/km/t |
- 3PMSF
- Yes
- Weight
- 8.3 kgs
Zeetex WH 1000
205/55 R16
Category scores (% of best)
All discipline results (12)
Discipline positions compare the ranked tyres in this test, not the whole market. These are individual measurements, not weighted overall scores.
| Test | Position in discipline | Result | Gap to best |
|---|---|---|---|
| Dry BrakingLower is better | 11th / 12 | 46 m | +2.70 m |
| Wet BrakingLower is better | 11th / 12 | 39.7 m | +4.60 m |
| Wet Braking - ConcreteLower is better | 11th / 12 | 44.3 m | +5.80 m |
| Straight AquaHigher is better | 12th / 12 | 68.9 km/h | -15.50 km/h |
| Curved AquaplaningHigher is better | 11th / 12 | 2.4 m/sec2 | -1.30 m/sec2 |
| Snow BrakingLower is better | 11th / 12 | 11 m | +1.10 m |
| Snow TractionHigher is better | 12th / 12 | 208 N | -28.00 N |
| Ice BrakingLower is better | 7th / 12 | 20 m | +1.70 m |
| NoiseLower is better | 7th / 12 | 71.6 dB | +1.20 dB |
| WearHigher is better | 6th / 12 | 44100 KM | -9,100.00 KM |
| Fuel ConsumptionLower is better | 7th / 12 | 5.2 l/100km | +0.10 l/100km |
| AbrasionLower is better | 9th / 12 | 72 mg/km/t | +24.00 mg/km/t |
- 3PMSF
- Yes
- Weight
- 9 kgs
GT Radial WinterPro2 Evo
205/55 R16
Category scores (% of best)
All discipline results (12)
Discipline positions compare the ranked tyres in this test, not the whole market. These are individual measurements, not weighted overall scores.
| Test | Position in discipline | Result | Gap to best |
|---|---|---|---|
| Dry BrakingLower is better | 10th / 12 | 45.8 m | +2.50 m |
| Wet BrakingLower is better | 8th / 12 | 36.9 m | +1.80 m |
| Wet Braking - ConcreteLower is better | 10th / 12 | 42.3 m | +3.80 m |
| Straight AquaHigher is better | 10th / 12 | 76.1 km/h | -8.30 km/h |
| Curved AquaplaningHigher is better | 10th / 12 | 2.9 m/sec2 | -0.80 m/sec2 |
| Snow BrakingLower is better | 8th / 12 | 10.3 m | +0.40 m |
| Snow TractionHigher is better | 8th / 12 | 230 N | -6.00 N |
| Ice BrakingLower is better | 9th / 12 | 20.3 m | +2.00 m |
| NoiseLower is better | 6th / 12 | 71.3 dB | +0.90 dB |
| WearHigher is better | 10th / 12 | 37100 KM | -16,100.00 KM |
| Fuel ConsumptionLower is better | 1st / 12 | 5.1 l/100km | Best in this discipline |
| AbrasionLower is better | 9th / 12 | 72 mg/km/t | +24.00 mg/km/t |
- 3PMSF
- Yes
- Weight
- 8.8 kgs
Vredestein Wintrac
205/55 R16
Category scores (% of best)
All discipline results (12)
Discipline positions compare the ranked tyres in this test, not the whole market. These are individual measurements, not weighted overall scores.
| Test | Position in discipline | Result | Gap to best |
|---|---|---|---|
| Dry BrakingLower is better | 4th / 12 | 44.5 m | +1.20 m |
| Wet BrakingLower is better | 6th / 12 | 36.1 m | +1.00 m |
| Wet Braking - ConcreteLower is better | 6th / 12 | 40.3 m | +1.80 m |
| Straight AquaHigher is better | 4th / 12 | 81 km/h | -3.40 km/h |
| Curved AquaplaningHigher is better | 6th / 12 | 3.3 m/sec2 | -0.40 m/sec2 |
| Snow BrakingLower is better | 10th / 12 | 10.5 m | +0.60 m |
| Snow TractionHigher is better | 2nd / 12 | 235 N | -1.00 N |
| Ice BrakingLower is better | 3rd / 12 | 19.4 m | +1.10 m |
| NoiseLower is better | 1st / 12 | 70.4 dB | Best in this discipline |
| WearHigher is better | 12th / 12 | 33400 KM | -19,800.00 KM |
| Fuel ConsumptionLower is better | 1st / 12 | 5.1 l/100km | Best in this discipline |
| AbrasionLower is better | 9th / 12 | 72 mg/km/t | +24.00 mg/km/t |
- 3PMSF
- Yes
- Weight
- 8.3 kgs
Pirelli Cinturato Winter 2
205/55 R16
Category scores (% of best)
All discipline results (12)
Discipline positions compare the ranked tyres in this test, not the whole market. These are individual measurements, not weighted overall scores.
| Test | Position in discipline | Result | Gap to best |
|---|---|---|---|
| Dry BrakingLower is better | 6th / 12 | 45.2 m | +1.90 m |
| Wet BrakingLower is better | 1st / 12 | 35.1 m | Best in this discipline |
| Wet Braking - ConcreteLower is better | 2nd / 12 | 39 m | +0.50 m |
| Straight AquaHigher is better | 6th / 12 | 80.6 km/h | -3.80 km/h |
| Curved AquaplaningHigher is better | 9th / 12 | 3 m/sec2 | -0.70 m/sec2 |
| Snow BrakingLower is better | 6th / 12 | 10.2 m | +0.30 m |
| Snow TractionHigher is better | 4th / 12 | 233 N | -3.00 N |
| Ice BrakingLower is better | 2nd / 12 | 19.1 m | +0.80 m |
| NoiseLower is better | 2nd / 12 | 70.9 dB | +0.50 dB |
| WearHigher is better | 11th / 12 | 34000 KM | -19,200.00 KM |
| Fuel ConsumptionLower is better | 7th / 12 | 5.2 l/100km | +0.10 l/100km |
| AbrasionLower is better | 12th / 12 | 79 mg/km/t | +31.00 mg/km/t |
- 3PMSF
- Yes
- Weight
- 8.5 kgs
Winrun Winter max A1 WR22
205/55 R16
Category scores (% of best)
All discipline results (12)
Discipline positions compare the ranked tyres in this test, not the whole market. These are individual measurements, not weighted overall scores.
| Test | Position in discipline | Result | Gap to best |
|---|---|---|---|
| Dry BrakingLower is better | 12th / 12 | 46.5 m | +3.20 m |
| Wet BrakingLower is better | 12th / 12 | 40.7 m | +5.60 m |
| Wet Braking - ConcreteLower is better | 12th / 12 | 46.6 m | +8.10 m |
| Straight AquaHigher is better | 11th / 12 | 69 km/h | -15.40 km/h |
| Curved AquaplaningHigher is better | 11th / 12 | 2.4 m/sec2 | -1.30 m/sec2 |
| Snow BrakingLower is better | 4th / 12 | 10.1 m | +0.20 m |
| Snow TractionHigher is better | 6th / 12 | 231 N | -5.00 N |
| Ice BrakingLower is better | 3rd / 12 | 19.4 m | +1.10 m |
| NoiseLower is better | 10th / 12 | 72 dB | +1.60 dB |
| WearHigher is better | 5th / 12 | 47000 KM | -6,200.00 KM |
| Fuel ConsumptionLower is better | 7th / 12 | 5.2 l/100km | +0.10 l/100km |
| AbrasionLower is better | 6th / 12 | 61 mg/km/t | +13.00 mg/km/t |
- 3PMSF
- Yes
- Weight
- 9.2 kgs
Discussion