



The Finnish publication Tekniikan Maailma has published its 2025 winter tyre test, evaluating a total of fourteen tyres, tested in conjunction with UTAC. The test was split into two categories, with seven studded winter tyres and seven Nordic non-studded (friction) winter tyres being compared. All tyres were tested in the popular 205/55 R16 size, using a Volkswagen Golf as the test vehicle. The tests covered a wide range of conditions, including performance on ice, snow, wet asphalt, and dry asphalt, as well as subjective handling characteristics and economy.
Test setup & methodology
The test setting, the conditions recorded and how the results contribute to the score.
Recorded test conditions
Recorded test conditions
- Wet Braking
- 80 → 0 km/h
- Snow Braking
- 80 → 0 km/h
- Snow Traction
- 5 → 35 km/h
- Ice Braking
- 50 → 0 km/h
- Ice Traction
- 5 → 20 km/h
The test revealed some notable variations in performance. Certain tyres, like the Continental VikingContact 8 and Goodyear UltraGrip Ice 3, were highlighted for their consistently strong and balanced performance across all tested surfaces. Conversely, several tyres demonstrated a clear trade-off between ice grip and asphalt handling. The Bridgestone Blizzak Spike 3, for example, delivered the best grip on ice but was found to have imprecise handling and weaker performance on asphalt. A similar inconsistency was noted in the Michelin X-Ice North 4, which provided excellent grip on ice and snow but was compromised by poor grip and sluggish handling on asphalt. The Pirelli Ice Zero 2 steered precisely but was difficult to control on ice due to oversteer, while the Falken Winterpeak F-Snow 1 was strong on ice but felt restless on snow.
Studded Tyres VS Friction Tyres
A significant finding from the comparison was the continued closing of the performance gap between premium studded and non-studded tyres. The testers observed that the difference in overall rating between the best of each category has become negligible, with the top two non-studded tyres scoring well enough to tie for second place had they been included in the studded group. The data suggests that for many drivers, a high-quality non-studded tyre is a viable choice for winter. However, the test still affirmed the superiority of studded tyres in the most treacherous conditions, such as on ice near 0°C. Under these circumstances, the studs provide a greater safety margin and more consistent grip as temperatures fluctuate, whereas the performance of non-studded tyres can change more dramatically. The testers concluded that while a modern car in less severe winter conditions can be well served by premium non-studded tyres, studded tyres remain a justified choice where maximizing safety is the primary concern, especially for older vehicles or less experienced drivers.
Below is the illustration provided by the magazine which shows studded vs friction tyres on ice at different temperatures.

Dry
On dry asphalt, where winter tyres can often feel less precise than their summer counterparts, a clear performance gap emerged, with some tyres providing surprisingly sharp braking while others, notably the Michelin and Radar patterns, struggled to match the group average.
Dry Braking
Dry braking in meters
Lower is better ↓Nordic Friction Winter Tyres
| Position / Tyre | Result | Gap to best |
|---|---|---|
| 30.8 m | Best | |
| 30.8 m | Best | |
| 31.3 m | +0.50 m | |
| 31.4 m | +0.60 m | |
| 31.5 m | +0.70 m | |
| 32.2 m | +1.40 m | |
| 32.6 m | +1.80 m |
Studded Winter Tyres
| Position / Tyre | Result | Gap to best |
|---|---|---|
| 31.5 m | Best | |
| 31.6 m | +0.10 m | |
| 31.9 m | +0.40 m | |
| 32.1 m | +0.60 m | |
| 32.2 m | +0.70 m | |
| 32.4 m | +0.90 m | |
| 33.4 m | +1.90 m |
The difference between best and worst was 8.4% (2.6 m ≈ 0.6 Car Lengths).
Subj. Dry Handling
Subjective Dry Handling Score
Higher is better ↑Nordic Friction Winter Tyres
| Position / Tyre | Result | Gap to best |
|---|---|---|
| 9 Points | Best | |
| 9 Points | Best | |
| 8 Points | -1.00 Points | |
| 8 Points | -1.00 Points | |
| 7 Points | -2.00 Points | |
| 7 Points | -2.00 Points | |
| 6 Points | -3.00 Points |
Studded Winter Tyres
| Position / Tyre | Result | Gap to best |
|---|---|---|
| 8 Points | Best | |
| 8 Points | Best | |
| 8 Points | Best | |
| 8 Points | Best | |
| 8 Points | Best | |
| 8 Points | Best | |
| 7 Points | -1.00 Points |
The difference between best and worst was 33.3% (3 Points).
Wet
Transitioning to wet conditions, the results shifted, highlighting the Goodyear UltraGrip Ice 3 as the strongest overall performer in the non-studded category. Continuing its poor showing on asphalt, the Michelin X-Ice Snow recorded the longest braking distances, falling a significant margin behind the leaders.
Wet Braking
Wet braking in meters (80 - 0 km/h)
Lower is better ↓Nordic Friction Winter Tyres
| Position / Tyre | Result | Gap to best | Residual speed |
|---|---|---|---|
| 37.5 m | Best | 0 km/h | |
| 37.5 m | Best | 0 km/h | |
| 37.7 m | +0.20 m | 9 km/h | |
| 37.9 m | +0.40 m | 13 km/h | |
| 39.4 m | +1.90 m | 29 km/h | |
| 39.5 m | +2.00 m | 29 km/h | |
| 41.1 m | +3.60 m | 38 km/h |
Studded Winter Tyres
| Position / Tyre | Result | Gap to best | Residual speed |
|---|---|---|---|
| 34.3 m | Best | 0 km/h | |
| 35.5 m | +1.20 m | 24 km/h | |
| 36 m | +1.70 m | 28 km/h | |
| 36.3 m | +2.00 m | 31 km/h | |
| 37.3 m | +3.00 m | 37 km/h | |
| 37.8 m | +3.50 m | 40 km/h | |
| 40.8 m | +6.50 m | 52 km/h |
The difference between best and worst was 19.8% (6.8 m ≈ 1.5 Car Lengths). From 130 km/h, the Michelin X Ice Snow would still be travelling at 53 km/h when the Pirelli Ice Zero 2 had stopped.
Residual speed is calculated from the measured braking distances, assuming constant deceleration; it is not a separate measurement.
Wet Handling
Wet handling time in seconds
Lower is better ↓Nordic Friction Winter Tyres
| Position / Tyre | Result | Gap to best |
|---|---|---|
| 39.9 s | Best | |
| 40 s | +0.10 s | |
| 40.3 s | +0.40 s | |
| 40.6 s | +0.70 s | |
| 41.4 s | +1.50 s | |
| 41.8 s | +1.90 s | |
| 41.8 s | +1.90 s |
Studded Winter Tyres
| Position / Tyre | Result | Gap to best |
|---|---|---|
| 40.1 s | Best | |
| 40.6 s | +0.50 s | |
| 41 s | +0.90 s | |
| 41.3 s | +1.20 s | |
| 41.5 s | +1.40 s | |
| 41.5 s | +1.40 s | |
| 42.1 s | +2.00 s |
The difference between best and worst was 5.5% (2.2 s).
Subj. Wet Handling
Subjective Wet Handling Score
Higher is better ↑Nordic Friction Winter Tyres
| Position / Tyre | Result | Gap to best |
|---|---|---|
| 9 Points | Best | |
| 8 Points | -1.00 Points | |
| 8 Points | -1.00 Points | |
| 8 Points | -1.00 Points | |
| 7 Points | -2.00 Points | |
| 7 Points | -2.00 Points | |
| 7 Points | -2.00 Points |
Studded Winter Tyres
| Position / Tyre | Result | Gap to best |
|---|---|---|
| 9 Points | Best | |
| 8 Points | -1.00 Points | |
| 8 Points | -1.00 Points | |
| 8 Points | -1.00 Points | |
| 7 Points | -2.00 Points | |
| 7 Points | -2.00 Points | |
| 6 Points | -3.00 Points |
The difference between best and worst was 33.3% (3 Points).

Snow
In snowy conditions, a key strength for any winter tyre, the Continental VikingContact 8 was best, offering calm handling across all snow disciplines, setting a benchmark that proved difficult for others to match.
Snow Braking
Snow braking in meters (80 - 0 km/h)
Lower is better ↓Nordic Friction Winter Tyres
| Position / Tyre | Result | Gap to best | Residual speed |
|---|---|---|---|
| 49.5 m | Best | 0 km/h | |
| 49.6 m | +0.10 m | 6 km/h | |
| 49.8 m | +0.30 m | 10 km/h | |
| 49.9 m | +0.40 m | 12 km/h | |
| 50.2 m | +0.70 m | 15 km/h | |
| 50.3 m | +0.80 m | 16 km/h | |
| 50.4 m | +0.90 m | 17 km/h |
Studded Winter Tyres
| Position / Tyre | Result | Gap to best | Residual speed |
|---|---|---|---|
| 49.8 m | Best | 0 km/h | |
| 49.9 m | +0.10 m | 6 km/h | |
| 50.1 m | +0.30 m | 10 km/h | |
| 50.1 m | +0.30 m | 10 km/h | |
| 50.3 m | +0.50 m | 13 km/h | |
| 50.6 m | +0.80 m | 16 km/h | |
| 51 m | +1.20 m | 20 km/h |
All the tyres in the Snow Braking test finished less than 3% apart. From 130 km/h, the Kumho WinterCraft Ice Wi32 would still be travelling at 22 km/h when the Nokian Hakkapeliitta R5 had stopped.
Residual speed is calculated from the measured braking distances, assuming constant deceleration; it is not a separate measurement.
Snow Traction
Snow acceleration time (5 - 35 km/h)
Lower is better ↓Nordic Friction Winter Tyres
| Position / Tyre | Result | Gap to best |
|---|---|---|
| 5.8 s | Best | |
| 5.9 s | +0.10 s | |
| 6 s | +0.20 s | |
| 6 s | +0.20 s | |
| 6 s | +0.20 s | |
| 6 s | +0.20 s | |
| 6.1 s | +0.30 s |
Studded Winter Tyres
| Position / Tyre | Result | Gap to best |
|---|---|---|
| 5.9 s | Best | |
| 5.9 s | Best | |
| 5.9 s | Best | |
| 5.9 s | Best | |
| 6 s | +0.10 s | |
| 6 s | +0.10 s | |
| 6 s | +0.10 s |
The difference between best and worst was 5.2% (0.3 s).
Ice
On the critical ice surface, which carries the most weight in the final scoring, the studded Bridgestone Blizzak Spike 3 delivered a strong performance with the best objective grip, while the Radar Dimax Ice consistently lagged behind.
Ice Braking
Ice braking in meters (50 - 0 km/h)
Lower is better ↓Nordic Friction Winter Tyres
| Position / Tyre | Result | Gap to best | Residual speed |
|---|---|---|---|
| 45.6 m | Best | 0 km/h | |
| 47.1 m | +1.50 m | 23 km/h | |
| 47.9 m | +2.30 m | 28 km/h | |
| 47.9 m | +2.30 m | 28 km/h | |
| 50.2 m | +4.60 m | 39 km/h | |
| 53.3 m | +7.70 m | 49 km/h | |
| 53.5 m | +7.90 m | 50 km/h |
Studded Winter Tyres
| Position / Tyre | Result | Gap to best | Residual speed |
|---|---|---|---|
| 32.3 m | Best | 0 km/h | |
| 33.1 m | +0.80 m | 20 km/h | |
| 33.9 m | +1.60 m | 28 km/h | |
| 36.9 m | +4.60 m | 46 km/h | |
| 37.7 m | +5.40 m | 49 km/h | |
| 41.6 m | +9.30 m | 61 km/h | |
| 42.5 m | +10.20 m | 64 km/h |
The difference between best and worst was 65.6% (21.2 m ≈ 4.7 Car Lengths). From 130 km/h, the Hankook Winter i cept IZ3 would still be travelling at 82 km/h when the Bridgestone Blizzak Spike 3 had stopped.
Residual speed is calculated from the measured braking distances, assuming constant deceleration; it is not a separate measurement.
Ice Traction
Ice acceleration time (5 - 20 km/h)
Lower is better ↓Nordic Friction Winter Tyres
| Position / Tyre | Result | Gap to best |
|---|---|---|
| 6.3 s | Best | |
| 6.7 s | +0.40 s | |
| 6.8 s | +0.50 s | |
| 7.2 s | +0.90 s | |
| 7.2 s | +0.90 s | |
| 7.6 s | +1.30 s | |
| 8.2 s | +1.90 s |
Studded Winter Tyres
| Position / Tyre | Result | Gap to best |
|---|---|---|
| 4.6 s | Best | |
| 4.7 s | +0.10 s | |
| 4.8 s | +0.20 s | |
| 5.1 s | +0.50 s | |
| 5.7 s | +1.10 s | |
| 5.8 s | +1.20 s | |
| 6.1 s | +1.50 s |
The difference between best and worst was 78.3% (3.6 s).
Comfort
Subj. Noise
Subjective in car noise levels
Higher is better ↑Nordic Friction Winter Tyres
| Position / Tyre | Result | Gap to best |
|---|---|---|
| 10 Points | Best | |
| 10 Points | Best | |
| 9 Points | -1.00 Points | |
| 9 Points | -1.00 Points | |
| 9 Points | -1.00 Points | |
| 9 Points | -1.00 Points | |
| 9 Points | -1.00 Points |
Studded Winter Tyres
| Position / Tyre | Result | Gap to best |
|---|---|---|
| 7 Points | Best | |
| 7 Points | Best | |
| 7 Points | Best | |
| 7 Points | Best | |
| 7 Points | Best | |
| 6 Points | -1.00 Points | |
| 6 Points | -1.00 Points |
The difference between best and worst was 40% (4 Points).
Results
Nordic Friction Winter Tyres
Continental VikingContact 8
205/55 R16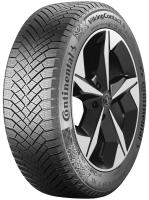
All discipline results (10)
Discipline positions compare the ranked tyres in this test, not the whole market. These are individual measurements, not weighted overall scores.
| Test | Result |
|---|---|
| Dry BrakingLower is better | 31.4 m |
| Subj. Dry HandlingHigher is better | 9 Points |
| Wet BrakingLower is better | 39.5 m |
| Wet HandlingLower is better | 40.3 s |
| Subj. Wet HandlingHigher is better | 8 Points |
| Snow BrakingLower is better | 49.6 m |
| Snow TractionLower is better | 5.8 s |
| Ice BrakingLower is better | 47.1 m |
| Ice TractionLower is better | 6.3 s |
| Subj. NoiseHigher is better | 9 Points |
- 3PMSF
- Yes
Nokian Hakkapeliitta R5
205/55 R16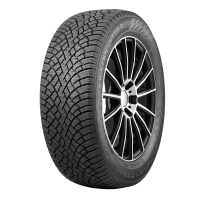
All discipline results (10)
Discipline positions compare the ranked tyres in this test, not the whole market. These are individual measurements, not weighted overall scores.
| Test | Result |
|---|---|
| Dry BrakingLower is better | 30.8 m |
| Subj. Dry HandlingHigher is better | 9 Points |
| Wet BrakingLower is better | 37.9 m |
| Wet HandlingLower is better | 40.6 s |
| Subj. Wet HandlingHigher is better | 8 Points |
| Snow BrakingLower is better | 49.5 m |
| Snow TractionLower is better | 6 s |
| Ice BrakingLower is better | 47.9 m |
| Ice TractionLower is better | 6.7 s |
| Subj. NoiseHigher is better | 10 Points |
- 3PMSF
- Yes
Goodyear UltraGrip Ice 3
205/55 R16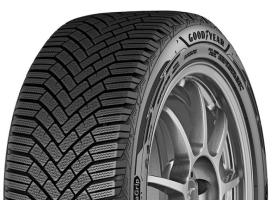
All discipline results (10)
Discipline positions compare the ranked tyres in this test, not the whole market. These are individual measurements, not weighted overall scores.
| Test | Result |
|---|---|
| Dry BrakingLower is better | 31.5 m |
| Subj. Dry HandlingHigher is better | 8 Points |
| Wet BrakingLower is better | 37.7 m |
| Wet HandlingLower is better | 39.9 s |
| Subj. Wet HandlingHigher is better | 9 Points |
| Snow BrakingLower is better | 49.8 m |
| Snow TractionLower is better | 6 s |
| Ice BrakingLower is better | 50.2 m |
| Ice TractionLower is better | 7.2 s |
| Subj. NoiseHigher is better | 9 Points |
- 3PMSF
- Yes
Hankook Winter i cept IZ3
205/55 R16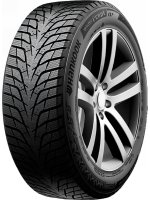
All discipline results (10)
Discipline positions compare the ranked tyres in this test, not the whole market. These are individual measurements, not weighted overall scores.
| Test | Result |
|---|---|
| Dry BrakingLower is better | 31.3 m |
| Subj. Dry HandlingHigher is better | 8 Points |
| Wet BrakingLower is better | 37.5 m |
| Wet HandlingLower is better | 40 s |
| Subj. Wet HandlingHigher is better | 8 Points |
| Snow BrakingLower is better | 50.4 m |
| Snow TractionLower is better | 6 s |
| Ice BrakingLower is better | 53.5 m |
| Ice TractionLower is better | 7.6 s |
| Subj. NoiseHigher is better | 9 Points |
- 3PMSF
- Yes
Falken Winterpeak F Snow 1
205/55 R16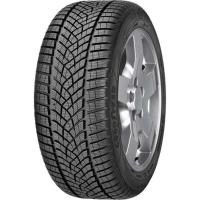
All discipline results (10)
Discipline positions compare the ranked tyres in this test, not the whole market. These are individual measurements, not weighted overall scores.
| Test | Result |
|---|---|
| Dry BrakingLower is better | 30.8 m |
| Subj. Dry HandlingHigher is better | 7 Points |
| Wet BrakingLower is better | 37.5 m |
| Wet HandlingLower is better | 41.4 s |
| Subj. Wet HandlingHigher is better | 7 Points |
| Snow BrakingLower is better | 50.3 m |
| Snow TractionLower is better | 5.9 s |
| Ice BrakingLower is better | 47.9 m |
| Ice TractionLower is better | 7.2 s |
| Subj. NoiseHigher is better | 9 Points |
- 3PMSF
- Yes
Michelin X Ice Snow
205/55 R16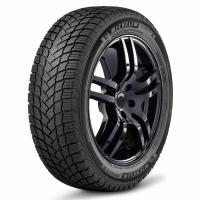
All discipline results (10)
Discipline positions compare the ranked tyres in this test, not the whole market. These are individual measurements, not weighted overall scores.
| Test | Result |
|---|---|
| Dry BrakingLower is better | 32.2 m |
| Subj. Dry HandlingHigher is better | 7 Points |
| Wet BrakingLower is better | 41.1 m |
| Wet HandlingLower is better | 41.8 s |
| Subj. Wet HandlingHigher is better | 7 Points |
| Snow BrakingLower is better | 49.9 m |
| Snow TractionLower is better | 6.1 s |
| Ice BrakingLower is better | 45.6 m |
| Ice TractionLower is better | 6.8 s |
| Subj. NoiseHigher is better | 10 Points |
- 3PMSF
- Yes
Radar Dimax Ice
205/55 R16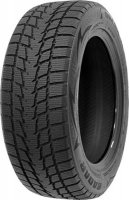
All discipline results (10)
Discipline positions compare the ranked tyres in this test, not the whole market. These are individual measurements, not weighted overall scores.
| Test | Result |
|---|---|
| Dry BrakingLower is better | 32.6 m |
| Subj. Dry HandlingHigher is better | 6 Points |
| Wet BrakingLower is better | 39.4 m |
| Wet HandlingLower is better | 41.8 s |
| Subj. Wet HandlingHigher is better | 7 Points |
| Snow BrakingLower is better | 50.2 m |
| Snow TractionLower is better | 6 s |
| Ice BrakingLower is better | 53.3 m |
| Ice TractionLower is better | 8.2 s |
| Subj. NoiseHigher is better | 9 Points |
- 3PMSF
- Yes
Studded Winter Tyres
Nokian Hakkapeliitta 10
205/55 R16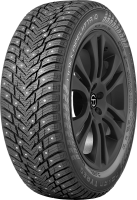
All discipline results (10)
Discipline positions compare the ranked tyres in this test, not the whole market. These are individual measurements, not weighted overall scores.
| Test | Result |
|---|---|
| Dry BrakingLower is better | 32.4 m |
| Subj. Dry HandlingHigher is better | 8 Points |
| Wet BrakingLower is better | 37.3 m |
| Wet HandlingLower is better | 41.5 s |
| Subj. Wet HandlingHigher is better | 8 Points |
| Snow BrakingLower is better | 50.3 m |
| Snow TractionLower is better | 6 s |
| Ice BrakingLower is better | 33.9 m |
| Ice TractionLower is better | 4.8 s |
| Subj. NoiseHigher is better | 7 Points |
- 3PMSF
- Yes
Continental IceContact 3
205/55 R16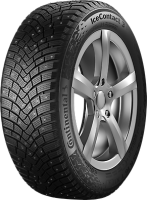
All discipline results (10)
Discipline positions compare the ranked tyres in this test, not the whole market. These are individual measurements, not weighted overall scores.
| Test | Result |
|---|---|
| Dry BrakingLower is better | 31.5 m |
| Subj. Dry HandlingHigher is better | 8 Points |
| Wet BrakingLower is better | 35.5 m |
| Wet HandlingLower is better | 40.1 s |
| Subj. Wet HandlingHigher is better | 8 Points |
| Snow BrakingLower is better | 49.8 m |
| Snow TractionLower is better | 5.9 s |
| Ice BrakingLower is better | 42.5 m |
| Ice TractionLower is better | 6.1 s |
| Subj. NoiseHigher is better | 6 Points |
- 3PMSF
- Yes
Goodyear UltraGrip Arctic 2
205/55 R16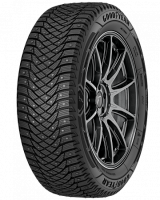
All discipline results (10)
Discipline positions compare the ranked tyres in this test, not the whole market. These are individual measurements, not weighted overall scores.
| Test | Result |
|---|---|
| Dry BrakingLower is better | 31.9 m |
| Subj. Dry HandlingHigher is better | 8 Points |
| Wet BrakingLower is better | 36 m |
| Wet HandlingLower is better | 40.6 s |
| Subj. Wet HandlingHigher is better | 9 Points |
| Snow BrakingLower is better | 50.1 m |
| Snow TractionLower is better | 5.9 s |
| Ice BrakingLower is better | 36.9 m |
| Ice TractionLower is better | 5.7 s |
| Subj. NoiseHigher is better | 7 Points |
- 3PMSF
- Yes
Michelin X Ice North 4
205/55 R16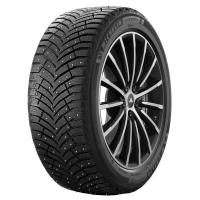
All discipline results (10)
Discipline positions compare the ranked tyres in this test, not the whole market. These are individual measurements, not weighted overall scores.
| Test | Result |
|---|---|
| Dry BrakingLower is better | 32.1 m |
| Subj. Dry HandlingHigher is better | 8 Points |
| Wet BrakingLower is better | 37.8 m |
| Wet HandlingLower is better | 41.3 s |
| Subj. Wet HandlingHigher is better | 7 Points |
| Snow BrakingLower is better | 50.1 m |
| Snow TractionLower is better | 5.9 s |
| Ice BrakingLower is better | 37.7 m |
| Ice TractionLower is better | 5.1 s |
| Subj. NoiseHigher is better | 7 Points |
- 3PMSF
- Yes
Bridgestone Blizzak Spike 3
205/55 R16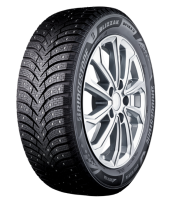
All discipline results (10)
Discipline positions compare the ranked tyres in this test, not the whole market. These are individual measurements, not weighted overall scores.
| Test | Result |
|---|---|
| Dry BrakingLower is better | 33.4 m |
| Subj. Dry HandlingHigher is better | 8 Points |
| Wet BrakingLower is better | 36.3 m |
| Wet HandlingLower is better | 41.5 s |
| Subj. Wet HandlingHigher is better | 7 Points |
| Snow BrakingLower is better | 50.6 m |
| Snow TractionLower is better | 6 s |
| Ice BrakingLower is better | 32.3 m |
| Ice TractionLower is better | 4.6 s |
| Subj. NoiseHigher is better | 6 Points |
- 3PMSF
- Yes
Pirelli Ice Zero 2
205/55 R16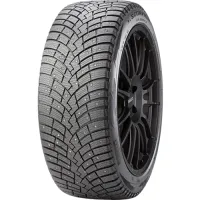
All discipline results (10)
Discipline positions compare the ranked tyres in this test, not the whole market. These are individual measurements, not weighted overall scores.
| Test | Result |
|---|---|
| Dry BrakingLower is better | 31.6 m |
| Subj. Dry HandlingHigher is better | 8 Points |
| Wet BrakingLower is better | 34.3 m |
| Wet HandlingLower is better | 41 s |
| Subj. Wet HandlingHigher is better | 8 Points |
| Snow BrakingLower is better | 49.9 m |
| Snow TractionLower is better | 5.9 s |
| Ice BrakingLower is better | 41.6 m |
| Ice TractionLower is better | 5.8 s |
| Subj. NoiseHigher is better | 7 Points |
- 3PMSF
- Yes
Kumho WinterCraft Ice Wi32
205/55 R16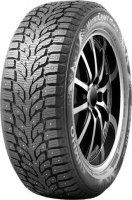
All discipline results (10)
Discipline positions compare the ranked tyres in this test, not the whole market. These are individual measurements, not weighted overall scores.
| Test | Result |
|---|---|
| Dry BrakingLower is better | 32.2 m |
| Subj. Dry HandlingHigher is better | 7 Points |
| Wet BrakingLower is better | 40.8 m |
| Wet HandlingLower is better | 42.1 s |
| Subj. Wet HandlingHigher is better | 6 Points |
| Snow BrakingLower is better | 51 m |
| Snow TractionLower is better | 6 s |
| Ice BrakingLower is better | 33.1 m |
| Ice TractionLower is better | 4.7 s |
| Subj. NoiseHigher is better | 7 Points |
- 3PMSF
- Yes
Discussion