

Goodyear UltraGrip Performance 3 vs Vredestein Wintrac Pro+
- TR Score
- 9.5/10
- Owners say
- 90% · 15
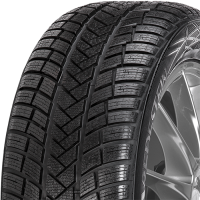
- TR Score
- 8.4/10
- Owners say
- 87% · 3
In the 12 independent tests that ran both tyres, the Goodyear UltraGrip Performance 3 finished ahead 10 times and the Wintrac Pro+ once, with one level. The UltraGrip Performance 3 lasted 41.3% longer in the wear tests; the Wintrac Pro+ resisted straight aquaplaning at a 0.5% higher speed.
Data updated

Which should you buy?
Choose the Goodyear UltraGrip Performance 3 for the best all-round winter performance with consistently shorter dry braking, stronger wet/snow handling balance, and clearly better projected wear/value. Pick the Vredestein Wintrac Pro+ if your priorities are ride comfort and strong hydroplaning resistance in very wet winters-and you can accept more compromise in dry braking/precision and typically shorter tread life.
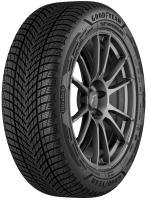
Where the UltraGrip Performance 3 is stronger
- Consistently stronger overall performance and rankings (wins 9/10 shared comparisons; includes multiple test victories such as 1st/10 in AZ and 1st/9 in 2026/27 test)
- Dry-road safety advantage: shorter dry braking in every measured head-to-head (e.g., 40.31 m vs 42.21 m; 41.8 m vs 43.6 m; 45.7 m vs 46.9 m)
- More complete winter competence, especially snow handling/traction consistency (frequent wins in snow handling; e.g., 76.15 s vs 77.99 s and 68.3 s vs 71.1 s)
The measured tallies (wins out of measurements in the shared tests) come straight from the tables below. The written verdict and bullet points are analysis of those tests and of owner reviews; where they and the figures disagree, the figures are right.
UltraGrip Performance 3 vs Wintrac Pro+ at a glance
| Category | UltraGrip Performance 3 | Gap | Wintrac Pro+ |
|---|---|---|---|
| Shared tests won12 shared tests | 10 | 1 level | 1 |
| Dry21 measurements | 17 | The UltraGrip Performance 3 stopped 3.7% shorter in the dry (10 tests) | 3 |
| Wet48 measurements | 30 | The UltraGrip Performance 3 stopped 2.4% shorter in the wet (12 tests) | 14 |
| Snow38 measurements | 29 | The UltraGrip Performance 3 was 4.2% quicker in the snow traction test (2 tests) | 8 |
| Ice1 measurement | 0 | 1 | |
| Comfort17 measurements | 11 | The UltraGrip Performance 3 was 1.5 dB quieter (9 tests) | 3 |
| Value16 measurements | 13 | The UltraGrip Performance 3 lasted 41.3% longer in the wear tests (4 tests) | 1 |
| Tyre Reviews Scoreevery test and review we hold | 9.5/10 | The UltraGrip Performance 3 by 1.1 | 8.4/10 |
| Owner rating15 and 3 reviews | 90% | The UltraGrip Performance 3 by 3 points | 87% |
| Pricein the 11 tests that listed prices | +18.7% | The UltraGrip Performance 3 was dearer in 11 of 11 | Cheaper |
| Sizes madeEU label registrations | 175 | 99 sizes made in both | 124 |
Wins count every measurement the shared tests recorded for both tyres; a tick marks the tyre ahead on that line. Subjective driver scores count as wins but are never averaged, because each test uses its own scale.
Head to head in 12 tests, 2025 to 2026
Each row is one published test in which both tyres ran on the same car, in the same size, on the same day. The line is the whole field, winner on the left.
| Test | UltraGrip Performance 3 | Field | Wintrac Pro+ |
|---|---|---|---|
| 2026 Auto Bild Winter Tyre Test | P5 of 20 | P8 of 20 | |
| 2026 Winter Tyre Braking Test - 50 Sets | P9 of 50 | P6 of 50 | |
| The BEST Winter Tyres for 2026/27 | P1 of 9 | P8 of 9 | |
| 2026 ADAC Winter Tyre Test - 225/50 R17 | P3 of 16 | P9 of 16 | |
| 2025 High Performance Winter Tyre Test | P3 of 6 | P6 of 6 | |
| 2025 AZ Performance Winter Tyre Test | P1 of 10 | P6 of 10 | |
| 2025 Autobild SUV Winter Tyre Test | P4 of 11 | P4 of 11 | |
| 2025 Autobild Winter Tyre Test | P5 of 20 | P13 of 20 | |
| 2025 Winter Tyre Braking Test - 52 Sets! | P3 of 51 | P17 of 51 | |
| 2025 AMS Winter Tyre Test | P2 of 10 | P5 of 10 | |
| 2025 Die Reifentester Winter Tyre Test | P2 of 7 | P4 of 7 | |
| 2025 Auto Express Winter Tyre Test | P2 of 8 | P6 of 8 |

Performance profile
25 measurements from the 12 shared tests, each tyre shown as its share of the better figure in every test.
Where each is furthest ahead
UltraGrip Performance 3
Wintrac Pro+
Point at or tap any spoke for both tyres' figures.
In each test the better of the two figures counts as 100% and the other as its share of it, so a 36 m stop against 34.2 m is 95%; each spoke averages the shared tests that recorded it. The scale stops at 92%: a point further in sits on the hub's edge, hollow. 5 measurements recorded in only one shared test are left off; every measurement is in the table further down.
Where each scores higher
UltraGrip Performance 3
Wintrac Pro+
Point at or tap any spoke for both tyres' figures.
Category scores are percentiles among tyres of the same season and class: 90 means this tyre out-performs 90% of them, measured across every test we hold, not only the ones it appeared in.
Where owners rate each higher
UltraGrip Performance 3
Wintrac Pro+
Point at or tap any spoke for both tyres' figures.
Owners rate the UltraGrip Performance 3 90% from 15 reviews and the Wintrac Pro+ 87% from 3. Each spoke is one question owners answer out of 10; reviews are vetted by hand before publication.
Every measurement, side by side
Averages of the figures both tyres posted in the same tests. The gap is the average of each test's own gap, so figures from different cars and years are never mixed. Open a discipline for its measurements, and a measurement for every test's figure.
| Measurement | UltraGrip Performance 3 | Gap | Wintrac Pro+ | Wins | ||||||||||||||||||||||||||||||||||||||||||||||||
|---|---|---|---|---|---|---|---|---|---|---|---|---|---|---|---|---|---|---|---|---|---|---|---|---|---|---|---|---|---|---|---|---|---|---|---|---|---|---|---|---|---|---|---|---|---|---|---|---|---|---|---|---|
| 41.87 | 3.7% | 43.43 | 10-0 | |||||||||||||||||||||||||||||||||||||||||||||||||
|
||||||||||||||||||||||||||||||||||||||||||||||||||||
| 67.68 | 0.7% | 68.22 | 2-0 | |||||||||||||||||||||||||||||||||||||||||||||||||
|
||||||||||||||||||||||||||||||||||||||||||||||||||||
| 114.8 | 0.7% | 114 | 3-2 | |||||||||||||||||||||||||||||||||||||||||||||||||
|
||||||||||||||||||||||||||||||||||||||||||||||||||||
| scored | 24.6% | scored | 2-1 | |||||||||||||||||||||||||||||||||||||||||||||||||
|
||||||||||||||||||||||||||||||||||||||||||||||||||||
| 39.88 | 2.4% | 40.93 | 8-3 | |||||||||||||||||||||||||||||||||||||||||||||||||
|
||||||||||||||||||||||||||||||||||||||||||||||||||||
| 39.5 | 4.1% | 41.2 | 1-0 | |||||||||||||||||||||||||||||||||||||||||||||||||
|
||||||||||||||||||||||||||||||||||||||||||||||||||||
| 84.64 | 1% | 85.5 | 3-0 | |||||||||||||||||||||||||||||||||||||||||||||||||
|
||||||||||||||||||||||||||||||||||||||||||||||||||||
| 77.24 | 0.9% | 76.54 | 4-0 | |||||||||||||||||||||||||||||||||||||||||||||||||
|
||||||||||||||||||||||||||||||||||||||||||||||||||||
| scored | 4.4% | scored | 1-1 | |||||||||||||||||||||||||||||||||||||||||||||||||
|
||||||||||||||||||||||||||||||||||||||||||||||||||||
| 7.92 | 0.9% | 7.85 | 2-0 | |||||||||||||||||||||||||||||||||||||||||||||||||
|
||||||||||||||||||||||||||||||||||||||||||||||||||||
| 13.02 | 1.4% | 13.19 | 3-0 | |||||||||||||||||||||||||||||||||||||||||||||||||
|
||||||||||||||||||||||||||||||||||||||||||||||||||||
| 83.27 | 0.5% | 83.82 | 4-6 | |||||||||||||||||||||||||||||||||||||||||||||||||
|
||||||||||||||||||||||||||||||||||||||||||||||||||||
| 19.81 | 1.3% | 22.94 | 4-4 | |||||||||||||||||||||||||||||||||||||||||||||||||
|
||||||||||||||||||||||||||||||||||||||||||||||||||||
| 26.3 | 1% | 26.58 | 8-4 | |||||||||||||||||||||||||||||||||||||||||||||||||
|
||||||||||||||||||||||||||||||||||||||||||||||||||||
| 7.58 | 4.2% | 7.94 | 2-0 | |||||||||||||||||||||||||||||||||||||||||||||||||
|
||||||||||||||||||||||||||||||||||||||||||||||||||||
| 2,745 | 2.3% | 2,676 | 3-3 | |||||||||||||||||||||||||||||||||||||||||||||||||
|
||||||||||||||||||||||||||||||||||||||||||||||||||||
| 68.98 | 3.6% | 71.53 | 3-0 | |||||||||||||||||||||||||||||||||||||||||||||||||
|
||||||||||||||||||||||||||||||||||||||||||||||||||||
| 72.62 | 1.8% | 71.12 | 4-1 | |||||||||||||||||||||||||||||||||||||||||||||||||
|
||||||||||||||||||||||||||||||||||||||||||||||||||||
| scored | 14.4% | scored | 4-0 | |||||||||||||||||||||||||||||||||||||||||||||||||
|
||||||||||||||||||||||||||||||||||||||||||||||||||||
| 3.89 | 8.8% | 3.58 | 2-0 | |||||||||||||||||||||||||||||||||||||||||||||||||
|
||||||||||||||||||||||||||||||||||||||||||||||||||||
| 3.38 | 2.2% | 3.31 | 3-0 | |||||||||||||||||||||||||||||||||||||||||||||||||
|
||||||||||||||||||||||||||||||||||||||||||||||||||||
| 18.7 | 0.5% | 18.6 | 0-1 | |||||||||||||||||||||||||||||||||||||||||||||||||
|
||||||||||||||||||||||||||||||||||||||||||||||||||||
| scored | 2.3% | scored | 3-2 | |||||||||||||||||||||||||||||||||||||||||||||||||
|
||||||||||||||||||||||||||||||||||||||||||||||||||||
| scored | 3.3% | scored | 1-0 | |||||||||||||||||||||||||||||||||||||||||||||||||
|
||||||||||||||||||||||||||||||||||||||||||||||||||||
| 68.87 | 1.5 dB | 70.36 | 7-1 | |||||||||||||||||||||||||||||||||||||||||||||||||
|
||||||||||||||||||||||||||||||||||||||||||||||||||||
| 52,213 | 41.3% | 37,358 | 4-0 | |||||||||||||||||||||||||||||||||||||||||||||||||
|
||||||||||||||||||||||||||||||||||||||||||||||||||||
| 8.2 | 6.2% | 8.75 | 7-1 | |||||||||||||||||||||||||||||||||||||||||||||||||
|
||||||||||||||||||||||||||||||||||||||||||||||||||||
| 5.6 | = | 5.6 | 0-0 | |||||||||||||||||||||||||||||||||||||||||||||||||
|
||||||||||||||||||||||||||||||||||||||||||||||||||||
| 62 | 32.6% | 92 | 1-0 | |||||||||||||||||||||||||||||||||||||||||||||||||
|
||||||||||||||||||||||||||||||||||||||||||||||||||||
| 0.14 | 30.3% | 0.2 | 1-0 | |||||||||||||||||||||||||||||||||||||||||||||||||
|
||||||||||||||||||||||||||||||||||||||||||||||||||||
Braking distances and lap times are better when lower; speeds, wear and grip figures when higher. A test's figures are its own: sizes, cars, surfaces and temperatures differ from one to the next, which is why the averages here are only ever of tests the two tyres shared. "Scored" rows are subjective driver ratings: each test uses its own scale, so only the wins are counted.
Scores beyond the shared tests
On the Tyre Reviews Score, which weighs every test and review we hold, the UltraGrip Performance 3 scores 9.5 and the Wintrac Pro+ 8.4 out of 10.
| UltraGrip Performance 3 | Category | Wintrac Pro+ | ||
|---|---|---|---|---|
| 89 | Dry | 52 | ||
| 95 | Wet | 87 | ||
| 85 | Comfort | 45 | ||
| 70 | Value | 13 | ||
| 87 | Snow | 56 | ||
| 22 | Ice | 44 | ||
Category scores are percentiles among tyres of the same season and class: 90 means this tyre out-performs 90% of them, measured across every test we hold, not only the ones it appeared in.
What owners say
| UltraGrip Performance 3 | Category | Wintrac Pro+ | ||
|---|---|---|---|---|
| 8.6 | Dry Grip | 8.3 | ||
| 8.8 | Wet Grip | 9 | ||
| 8.6 | Road Feedback | 8.7 | ||
| 8.1 | Handling | 9 | ||
| 9 | Wear | 8 | ||
| 8.8 | Comfort | 8.7 | ||
| 9.5 | Snow Grip | 9.5 | ||
| 8.1 | Ice Grip | 10 | ||
Owners rate the UltraGrip Performance 3 90% from 15 reviews and the Wintrac Pro+ 87% from 3. Reviews are vetted by hand before publication; ownership is not verified.
Goodyear UltraGrip Performance 3
- 90%from 15 reviews
- 100%would buy again
- 62,800 milesdriven by reviewers
Drivers rate the Goodyear UltraGrip Performance 3 very highly, praising its excellent grip and braking on dry and wet roads, strong traction in snow, and a quiet, comfortable, and predictable ride. Handling is often described as stable and confidence-inspiring, with several noting good highway manners. A minority mention weaker performance on pure ice and a softer, less sporty steering feel at the limit. Overall sentiment is strongly positive with only a few caveats.
- strong dry grip and braking
- excellent wet grip and braking
- very good snow traction
- quiet and comfortable ride
- limited grip on pure ice compared to some rivals
- softer steering feel and less sporty lateral grip at high speeds
Summarised by AI from 12 vetted reviews; the reviews themselves are on the tyre page.
All 15 UltraGrip Performance 3 reviewsThis is exceptional tyre in winter i swapped it now with Michelin PA 5 which is even better on snow but lucks a bit on wet. But you cant go wrong with niether of those. I cant wait Michelin s to worn out so i can try pirelli.
Vredestein Wintrac Pro+
- 87%from 3 reviews
- 37,500 milesdriven by reviewers
All 3 Wintrac Pro+ reviewsTyres has been perfect on my electric car which is very very (2,5 tonnes). quiet, stabile and long lasting.
Sizes, EU label and lineage
From the EU label registrations for each tyre: 175 sizes of the UltraGrip Performance 3 and 124 of the Wintrac Pro+, 99 of them made in both.
| Category | UltraGrip Performance 3 | Wintrac Pro+ |
|---|---|---|
| Season | Winter | Winter |
| Sizes made | 175 sizes, 14 to 23 inch | 124 sizes, 17 to 22 inch |
| Made in both | 99 sizes 205/45 R17205/50 R17205/55 R17215/45 R17215/50 R17215/55 R17215/60 R17215/65 R17225/45 R17225/50 R17225/55 R17235/45 R17and 87 more | |
| EU label wet grip | B60%C39%D0%A0% | B68%C32% |
| EU label rolling resistance | C74%B16%D9%A1%E0% | C55%D40%B3%E2% |
| EU label noise | 69-74 dB B87%A13% | 70-74 dB B100% |
| Severe snow (3PMSF) sizes | 415 of 415 | 137 of 137 |
| On the market since | - | 2024 |
| Awards | Commended: Best Winter Tyre (DriverReviews, 2025/26) | - |
| Price in the shared tests | The UltraGrip Performance 3 was the dearer tyre in 11 of the 11 tests that listed prices, by 18.7% on average. Each test priced the tyres in its own market at the time; only the gap is comparable. | |
Label grades are shown as the share of registered sizes carrying each grade, so "B (88%), C (12%)" means most sizes are B. Grades vary by size; check the label for yours.
Reading the results
Written from the test results and owner reviews above. It is analysis, not a measurement: where it and the tables disagree, the tables are right.
Goodyear's UltraGrip Performance 3 and Vredestein's Wintrac Pro+ sit in the same “UHP winter” space: tyres aimed at drivers who still want crisp steering and stable high-speed behaviour, but need real winter capability for cold, wet roads and occasional snow. With both models appearing across 10 shared, recent group tests (from 17-inch to 19-inch fitments, including ADAC, AutoBild, AMS and independent tyre channels), this is a comparison with unusually strong cross-checking across sizes and test styles.
The headline pattern is consistent: the Goodyear is the more complete, higher-performing all-rounder and typically finishes near the top of the table (including multiple wins), while the Vredestein tends to land mid-pack. Where the Wintrac Pro+ fights back is in hydroplaning resistance (often excellent) and, in some tests, wet braking or ride comfort-making it a more “comfort/wet-specialist value” play rather than a pure performance benchmark.
Conclusion
Across the shared tests, the UltraGrip Performance 3 is the clear winner on aggregate: it beats the Wintrac Pro+ in overall ranking in 9 of the 10 shared comparisons, including a dominant 1st vs 8th in the 2026/27 winter test. Objectively, it's repeatedly shorter in dry braking (it wins dry braking in all 9 tests where it's measured head-to-head) and is usually stronger in wet handling and snow handling. It also brings a meaningful ownership advantage where measured: ADAC's projected wear is 55,800 km for Goodyear vs 34,300 km for Vredestein, and other tests echo the same direction (e.g., 43,750 km vs 31,250 km in AZ; 53,000 km vs 37,630 km in AutoBild), so the Goodyear is typically the safer long-term value even if the purchase price is similar.
The Wintrac Pro+ isn't a bad tyre-it just has a narrower set of standout traits. It repeatedly performs very well in aquaplaning (it wins straight aquaplaning 5-4 and curved aquaplaning 4-3 across the shared dataset), and it can occasionally beat the Goodyear on wet braking (3 wins) and subjective ride comfort (notably winning comfort in the 2026/27 test). The trade-off is that it more often gives away stopping distance on dry roads and tends to wear faster, which hurts both safety margins in mixed winter conditions and cost per kilometre.
Practical takeaway: if you want one UHP winter tyre that you can trust to be consistently strong across dry, wet, and snow-with better longevity-pick the Goodyear. Choose the Vredestein primarily if your priority is a plush ride and top-tier hydroplaning security, and you're willing to accept weaker dry braking/precision and typically shorter tread life.
UltraGrip Performance 3 vs Wintrac Pro+: your questions
Is the Goodyear UltraGrip Performance 3 or the Vredestein Wintrac Pro+ the better tyre?
In the 12 independent tests that ran both tyres, the Goodyear UltraGrip Performance 3 finished ahead 10 times and the Wintrac Pro+ once, with one level. On the Tyre Reviews Score, which weighs every test and review we hold, the UltraGrip Performance 3 scores 9.5 and the Wintrac Pro+ 8.4 out of 10.
Which is better in the wet, the UltraGrip Performance 3 or the Wintrac Pro+?
The UltraGrip Performance 3 led 30 of the 48 wet measurements the shared tests recorded. On average it stopped 2.4% shorter in the wet across 12 tests.
Which is better in the dry?
The UltraGrip Performance 3 led 17 of the 21 dry measurements the shared tests recorded. On average it stopped 3.7% shorter in the dry across 10 tests.
Which is better in snow?
The UltraGrip Performance 3 led 29 of the 38 snow measurements the shared tests recorded. On average it was 4.2% quicker in the snow traction test across 2 tests.
Which lasts longer and costs less to run?
The UltraGrip Performance 3 lasted 41.3% longer in the wear tests (4 tests) and had 6.2% lower rolling resistance (9 tests). Owners rate wear 9/10 for the UltraGrip Performance 3 and 8/10 for the Wintrac Pro+.
Which is quieter and more comfortable?
The UltraGrip Performance 3 was 1.5 dB quieter (9 tests). Owners rate comfort 8.8/10 for the UltraGrip Performance 3 and 8.7/10 for the Wintrac Pro+.
What do owners say?
Owners rate the UltraGrip Performance 3 90% from 15 reviews and the Wintrac Pro+ 87% from 3.
Which is more expensive?
In the 11 tests that listed prices, the UltraGrip Performance 3 was the dearer tyre in 11 of them, by 18.7% on average. Prices are the test's own at the time, in its own market.
Are they available in the same sizes?
The UltraGrip Performance 3 is made in 175 sizes (14 to 23 inch) and the Wintrac Pro+ in 124 (17 to 22 inch). 99 sizes are available in both. On the EU label the UltraGrip Performance 3 is graded B for wet grip and C for rolling resistance in most sizes; the Wintrac Pro+ B and C.
More comparisons with these tyres
 vs
Continental WinterContact TS 870 P vs Goodyear UltraGrip Performance 3
8-16 in 25 shared tests
vs
 Goodyear UltraGrip Performance 3 vs Michelin Pilot Alpin 5
3-14 in 18 shared tests
 vs
Bridgestone Blizzak 6 vs Goodyear UltraGrip Performance 3
7-16 in 24 shared tests
vs
 Goodyear UltraGrip Performance 3 vs Michelin Alpin 7
8-4 in 12 shared tests
 vs
Continental WinterContact TS 870 vs Goodyear UltraGrip Performance 3
10-1 in 11 shared tests
vs
 Goodyear UltraGrip Performance 3 vs Hankook Winter I cept RS3
11-2 in 13 shared tests
 vs
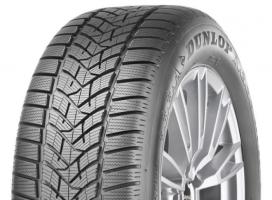
Dunlop Winter Sport 5 vs Goodyear UltraGrip Performance 3
0-8 in 8 shared tests
 vs
Barum Polaris 6 vs Goodyear UltraGrip Performance 3
1-4 in 5 shared tests
Run either of these?
Your review is the part of this page no test can supply: how the tyre wore, how it aged, what it was like in the rain in year three. It takes about five minutes.
Where this data comes from
Finishing positions and measurements are transcribed from each published test. A test only counts here when both tyres ran in it, so every figure was recorded on the same car, size and day as the one it is compared to.
About the TR Score
The Tyre Reviews Score rates each tyre out of 10 from every independent test result and vetted owner review we hold, so two tyres can be compared even before a test has run them together.
Who does the testing
Every test published as a Tyre Reviews test is run by Jonathan Benson, who has been testing tyres independently since 2007.
Discussion