



German publication AutoBild has tested eight summer tyres in the 215/55 R18 size specifically aimed at electric vehicles. The test aimed to find tyres that could achieve the difficult balance between energy efficiency (for maximum EV range) and safety performance.
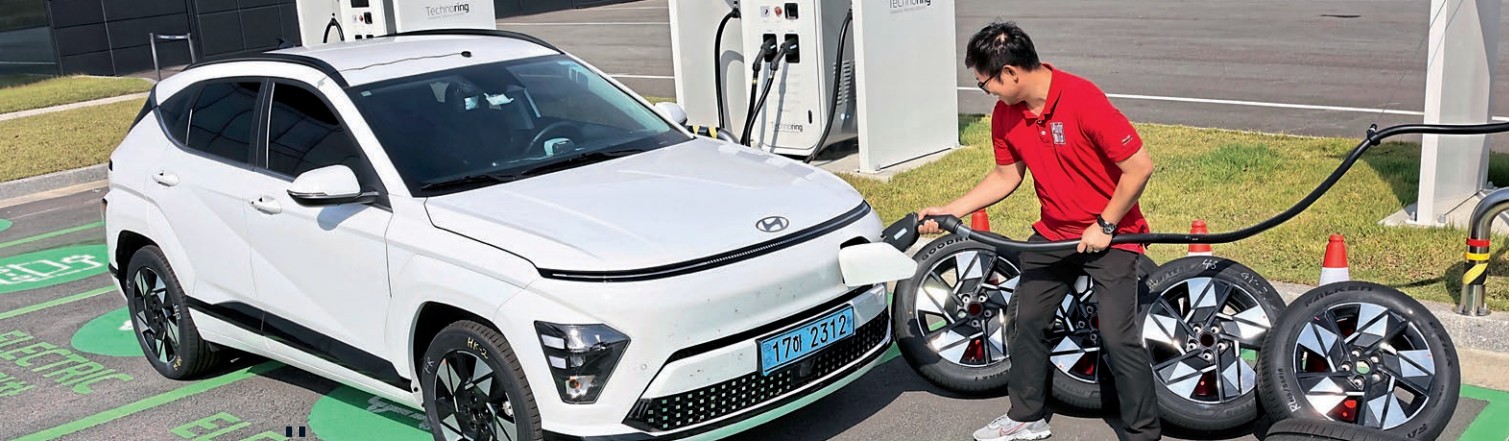
AutoBild evaluated models from premium manufacturers like Continental, Goodyear and Michelin alongside offerings from mid-range brands including Falken, Firestone and Yokohama, plus budget option Goodride. Interestingly, only two tyres in the test - the Hankook iON evo and Falken e.Ziex - were specifically designed as EV tyres, while others were standard tyres that manufacturers claim are also suitable for electric vehicles.
Test setup & methodology
The test setting, the conditions recorded and how the results contribute to the score.
Recorded test conditions
Recorded test conditions
- Wet Braking
- 100 → 0 km/h
Testing was conducted on a Hyundai Kona EV, with tyres put through wet and dry handling, braking, and aquaplaning tests. Additionally, the publication measured rolling resistance and conducted a roll-out test to determine real-world range impact. The results showed that in extreme cases, tyre choice could affect vehicle range by up to 70 kilometers (43 miles.)
One of the most interesting findings was that the Hankook iON evo, specifically designed for EVs, claimed the overall victory, but standard tyres from Continental and Goodyear followed extremely closely behind. This suggests that the gap between dedicated EV tyres and high-quality standard tyres is minimal when balancing safety and efficiency needs.
Goodyear's EfficientGrip 2 SUV was awarded AutoBild's "Green Tyre 2025" environmental seal due to its excellent balance of rolling resistance, longevity, and environmental characteristics.
Dry
Hankook iON evo achieved the shortest braking distance of 33.6 meters, with Continental close behind at 34.5 meters. Goodride Solmax 1 needed significantly more distance at 37.8 meters, showing the safety gap between premium and budget options.
Dry Braking
Dry braking in meters
Lower is better ↓| Position / Tyre | Result | Gap to best |
|---|---|---|
| 33.6 m | Best | |
| 34.5 m | +0.90 m | |
| 35.1 m | +1.50 m | |
| 35.7 m | +2.10 m | |
| 35.9 m | +2.30 m | |
| 36.6 m | +3.00 m | |
| 36.6 m | +3.00 m | |
| 37.8 m | +4.20 m |
The difference between best and worst was 12.5% (4.2 m ≈ 0.9 Car Lengths).
Hankook topped the handling test with 92.8 km/h average speed, followed by Continental at 91.9 km/h and Goodyear at 91.1 km/h. The Goodride again finished last with 88.2 km/h, confirming its limited cornering abilities.
Dry Handling
Dry Handling Average Speed
Higher is better ↑| Position / Tyre | Result | Gap to best |
|---|---|---|
| 92.8 km/h | Best | |
| 91.9 km/h | -0.90 km/h | |
| 91.1 km/h | -1.70 km/h | |
| 90.8 km/h | -2.00 km/h | |
| 90.5 km/h | -2.30 km/h | |
| 90.4 km/h | -2.40 km/h | |
| 90.2 km/h | -2.60 km/h | |
| 88.2 km/h | -4.60 km/h |
The difference between best and worst was 5% (4.6 Km/H).
Wet
Continental took the lead in wet conditions with a 39.4-meter stopping distance, just ahead of Hankook at 39.6 meters. The gap to last-place Goodride widened to 48.7 meters, a 23% increase that could be critical in emergency situations.
Wet Braking
Wet braking in meters (100 - 0 km/h)
Lower is better ↓| Position / Tyre | Result | Gap to best | Residual speed |
|---|---|---|---|
| 39.4 m | Best | 0 km/h | |
| 39.6 m | +0.20 m | 9 km/h | |
| 41.8 m | +2.40 m | 31 km/h | |
| 42.2 m | +2.80 m | 33 km/h | |
| 43.2 m | +3.80 m | 39 km/h | |
| 44.9 m | +5.50 m | 45 km/h | |
| 45.6 m | +6.20 m | 48 km/h | |
| 48.7 m | +9.30 m | 57 km/h |
The difference between best and worst was 23.6% (9.3 m ≈ 2.1 Car Lengths). From 130 km/h, the Goodride Solmax 1 would still be travelling at 57 km/h when the Continental PremiumContact 7 had stopped.
Residual speed is calculated from the measured braking distances, assuming constant deceleration; it is not a separate measurement.
Hankook led wet handling with 74.4 km/h, narrowly beating Continental's 74.1 km/h. Goodyear maintained third position while Falken e.Ziex fell to second-last despite its EV-specific design.
Wet Handling
Wet Handling Average Speed
Higher is better ↑| Position / Tyre | Result | Gap to best |
|---|---|---|
| 74.4 km/h | Best | |
| 74.1 km/h | -0.30 km/h | |
| 72.9 km/h | -1.50 km/h | |
| 72 km/h | -2.40 km/h | |
| 71.5 km/h | -2.90 km/h | |
| 70.6 km/h | -3.80 km/h | |
| 69.3 km/h | -5.10 km/h | |
| 68.4 km/h | -6.00 km/h |
The difference between best and worst was 8.1% (6 Km/H).
In the wet circle test, Hankook continued strong with 12.45 seconds, followed by Continental and Yokohama. Goodride again struggled with the slowest time at 13.03 seconds.
Wet Circle
Wet Circle Lap Time in seconds
Lower is better ↓| Position / Tyre | Result | Gap to best |
|---|---|---|
| 12.45 s | Best | |
| 12.59 s | +0.14 s | |
| 12.67 s | +0.22 s | |
| 12.68 s | +0.23 s | |
| 12.7 s | +0.25 s | |
| 12.79 s | +0.34 s | |
| 12.86 s | +0.41 s | |
| 13.03 s | +0.58 s |
The difference between best and worst was 4.7% (0.58 s).
Firestone Roadhawk 2 resisted aquaplaning up to 80.1 km/h, significantly better than its performance in other tests. Hankook placed second at 74.8 km/h, while Yokohama lost grip earliest at 63.7 km/h.
Straight Aqua
Float Speed in Km/H
Higher is better ↑| Position / Tyre | Result | Gap to best |
|---|---|---|
| 80.1 km/h | Best | |
| 74.8 km/h | -5.30 km/h | |
| 72.6 km/h | -7.50 km/h | |
| 71.5 km/h | -8.60 km/h | |
| 69.3 km/h | -10.80 km/h | |
| 67.5 km/h | -12.60 km/h | |
| 65.8 km/h | -14.30 km/h | |
| 63.7 km/h | -16.40 km/h |
The difference between best and worst was 20.5% (16.4 Km/H).
Firestone maintained its aquaplaning advantage in curves with 3.02 m/s² lateral acceleration. Hankook again followed in second place, while Yokohama continued to struggle with water evacuation.
Curved Aquaplaning
Remaining lateral acceleration
Higher is better ↑| Position / Tyre | Result | Gap to best |
|---|---|---|
| 3.02 m/sec2 | Best | |
| 2.97 m/sec2 | -0.05 m/sec2 | |
| 2.85 m/sec2 | -0.17 m/sec2 | |
| 2.84 m/sec2 | -0.18 m/sec2 | |
| 2.84 m/sec2 | -0.18 m/sec2 | |
| 2.74 m/sec2 | -0.28 m/sec2 | |
| 2.6 m/sec2 | -0.42 m/sec2 | |
| 2.58 m/sec2 | -0.44 m/sec2 |
The difference between best and worst was 14.6% (0.44 m/sec2).
Comfort
Yokohama produced the least external noise at 68.7 dB, a key advantage for quiet EV operation. Continental and Firestone were the loudest at over 72 dB, showing their focus on grip over comfort.
Noise
External noise in dB
Lower is better ↓| Position / Tyre | Result | Gap to best |
|---|---|---|
| 68.7 dB | Best | |
| 69.9 dB | +1.20 dB | |
| 70.2 dB | +1.50 dB | |
| 70.3 dB | +1.60 dB | |
| 70.9 dB | +2.20 dB | |
| 71.2 dB | +2.50 dB | |
| 72 dB | +3.30 dB | |
| 72.1 dB | +3.40 dB |
The difference between best and worst was 4.9% (3.4 dB).
Goodyear EfficientGrip 2 SUV leads in subjective comfort with 8 points, highlighting its balanced approach to both efficiency and ride quality. Most premium contenders like Hankook, Continental, Michelin and Falken offer respectable comfort with 7 points. The budget Goodride Solmax 1 trails significantly with just 5 points, showing where cost-cutting affects the driving experience most noticeably.
Subj. Comfort
Subjective Comfort Score
Higher is better ↑| Position / Tyre | Result | Gap to best |
|---|---|---|
| 8 Points | Best | |
| 7 Points | -1.00 Points | |
| 7 Points | -1.00 Points | |
| 7 Points | -1.00 Points | |
| 7 Points | -1.00 Points | |
| 7 Points | -1.00 Points | |
| 6 Points | -2.00 Points | |
| 5 Points | -3.00 Points |
The difference between best and worst was 37.5% (3 Points).

Value
Goodyear showed the best durability with a projected 49,050 km lifespan. Michelin placed second at 44,920 km, while Firestone's 28,510 km was just over half of Goodyear's life expectancy.
Wear
Predicted tread life in KM
Higher is better ↑| Position / Tyre | Result | Gap to best |
|---|---|---|
| 49,050 KM | Best | |
| 44,920 KM | -4,130 KM | |
| 43,120 KM | -5,930 KM | |
| 40,890 KM | -8,160 KM | |
| 36,790 KM | -12,260 KM | |
| 31,030 KM | -18,020 KM | |
| 30,280 KM | -18,770 KM | |
| 28,510 KM | -20,540 KM |
The difference between best and worst was 41.9% (20,540 KM).
Budget Goodride offered the best cost efficiency at €11 per 1,000 km despite performance limitations. Goodyear combined durability with competitive pricing for second place, while premium-priced Michelin ranked last at €16.4 per 1,000 km.
Value
Euros/1000km based on cost/wear
Lower is better ↓| Position / Tyre | Result | Gap to best | cost per 1,000 km |
|---|---|---|---|
| 11 Price/1000 | Best | €16.55 | |
| 12 Price/1000 | +1.00 Price/1000 | €16.63 | |
| 14.9 Price/1000 | +3.90 Price/1000 | €16.85 | |
| 15.1 Price/1000 | +4.10 Price/1000 | €19.03 | |
| 15.2 Price/1000 | +4.20 Price/1000 | €21.30 | |
| 15.6 Price/1000 | +4.60 Price/1000 | €21.68 | |
| 15.7 Price/1000 | +4.70 Price/1000 | €22.23 | |
| 16.4 Price/1000 | +5.40 Price/1000 | €19.52 |
The difference between best and worst was 49.1% (5.4 Price/1000). Over 40,000 km the cheapest tyre to own (Goodride Solmax 1) works out €227 cheaper than the most expensive (Yokohama BluEarth XT AE61).
How this is calculated
Assumes a typical EV using 18 kWh/100km (with rolling resistance causing 25% of energy use), electricity at €0.32 per kWh and €70 fitting per set of four. Purchase prices are from the time of the 2025 test; financing costs are excluded.
Falken e.Ziex recorded the lowest rolling resistance at 5.86 kg/t, followed by Michelin and Hankook. Continental had the highest at 7.66 kg/t, showing its priority on grip over efficiency.
Rolling Resistance
Rolling resistance in kg t
Lower is better ↓| Position / Tyre | Result | Gap to best | Extra energy / year |
|---|---|---|---|
| 5.86 kg/t | Best | £0 | |
| 6.51 kg/t | +0.65 kg/t | £27 | |
| 6.81 kg/t | +0.95 kg/t | £39 | |
| 7.15 kg/t | +1.29 kg/t | £53 | |
| 7.22 kg/t | +1.36 kg/t | £56 | |
| 7.33 kg/t | +1.47 kg/t | £60 | |
| 7.58 kg/t | +1.72 kg/t | £70 | |
| 7.66 kg/t | +1.80 kg/t | £74 |
The difference between best and worst was 30.7% (1.8 kg / t). Over 19,000 km a year at £0.28/kWh, the Continental PremiumContact 7 uses about 263 kWh (£74) more electricity than the Falken e.Ziex.
Adjust the assumptions
Calculated estimates, not additional measurements. Use the controls to explore the assumptions.
Falken's efficiency translated to 410 km range, 65.6 km more than Continental's 344.4 km. Hankook balanced performance with efficiency for second place at 381.3 km, highlighting how tyre choice affects EV range.
Range
Calculated Range
Higher is better ↑| Position / Tyre | Result | Gap to best |
|---|---|---|
| 410 km | Best | |
| 381 km | -29 km | |
| 377 km | -33 km | |
| 373 km | -37 km | |
| 373 km | -37 km | |
| 373 km | -37 km | |
| 353 km | -57 km | |
| 344 km | -66 km |
The difference between best and worst was 16% (65.6 km).
Results
Hankook iON Evo
215/55 R18 99Y XL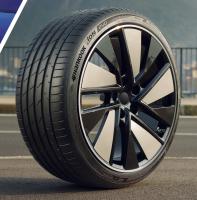
Category scores (% of best)
All discipline results (13)
Discipline positions compare the ranked tyres in this test, not the whole market. These are individual measurements, not weighted overall scores.
| Test | Position in discipline | Result | Gap to best |
|---|---|---|---|
| Dry BrakingLower is better | 1st / 8 | 33.6 m | Best in this discipline |
| Dry HandlingHigher is better | 1st / 8 | 92.8 km/h | Best in this discipline |
| Wet BrakingLower is better | 2nd / 8 | 39.6 m | +0.20 m |
| Wet HandlingHigher is better | 1st / 8 | 74.4 km/h | Best in this discipline |
| Wet CircleLower is better | 1st / 8 | 12.45 s | Best in this discipline |
| Straight AquaHigher is better | 2nd / 8 | 74.8 km/h | -5.30 km/h |
| Curved AquaplaningHigher is better | 2nd / 8 | 2.97 m/sec2 | -0.05 m/sec2 |
| Subj. ComfortHigher is better | 2nd / 8 | 7 Points | -1.00 Points |
| NoiseLower is better | 3rd / 8 | 70.2 dB | +1.50 dB |
| WearHigher is better | 3rd / 8 | 43120 KM | -5,930.00 KM |
| ValueLower is better | 4th / 8 | 15.1 Price/1000 | +4.10 Price/1000 |
| Rolling ResistanceLower is better | 3rd / 8 | 6.81 kg/t | +0.95 kg/t |
| RangeHigher is better | 2nd / 8 | 381.3 km | -28.70 km |
- EU Label
- B/A/69
- Price
- 650.00
Continental PremiumContact 7
215/55 R18 99V XL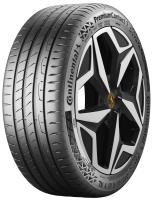
Category scores (% of best)
All discipline results (13)
Discipline positions compare the ranked tyres in this test, not the whole market. These are individual measurements, not weighted overall scores.
| Test | Position in discipline | Result | Gap to best |
|---|---|---|---|
| Dry BrakingLower is better | 2nd / 8 | 34.5 m | +0.90 m |
| Dry HandlingHigher is better | 2nd / 8 | 91.9 km/h | -0.90 km/h |
| Wet BrakingLower is better | 1st / 8 | 39.4 m | Best in this discipline |
| Wet HandlingHigher is better | 2nd / 8 | 74.1 km/h | -0.30 km/h |
| Wet CircleLower is better | 2nd / 8 | 12.59 s | +0.14 s |
| Straight AquaHigher is better | 5th / 8 | 69.3 km/h | -10.80 km/h |
| Curved AquaplaningHigher is better | 6th / 8 | 2.74 m/sec2 | -0.28 m/sec2 |
| Subj. ComfortHigher is better | 2nd / 8 | 7 Points | -1.00 Points |
| NoiseLower is better | 8th / 8 | 72.1 dB | +3.40 dB |
| WearHigher is better | 4th / 8 | 40890 KM | -8,160.00 KM |
| ValueLower is better | 5th / 8 | 15.2 Price/1000 | +4.20 Price/1000 |
| Rolling ResistanceLower is better | 8th / 8 | 7.66 kg/t | +1.80 kg/t |
| RangeHigher is better | 8th / 8 | 344.4 km | -65.60 km |
- EU Label
- C/A/71
- Price
- 620.00
Goodyear EfficientGrip 2 SUV
215/55 R18 99V XL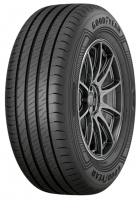
Category scores (% of best)
All discipline results (13)
Discipline positions compare the ranked tyres in this test, not the whole market. These are individual measurements, not weighted overall scores.
| Test | Position in discipline | Result | Gap to best |
|---|---|---|---|
| Dry BrakingLower is better | 5th / 8 | 35.9 m | +2.30 m |
| Dry HandlingHigher is better | 3rd / 8 | 91.1 km/h | -1.70 km/h |
| Wet BrakingLower is better | 4th / 8 | 42.2 m | +2.80 m |
| Wet HandlingHigher is better | 3rd / 8 | 72.9 km/h | -1.50 km/h |
| Wet CircleLower is better | 6th / 8 | 12.79 s | +0.34 s |
| Straight AquaHigher is better | 4th / 8 | 71.5 km/h | -8.60 km/h |
| Curved AquaplaningHigher is better | 4th / 8 | 2.84 m/sec2 | -0.18 m/sec2 |
| Subj. ComfortHigher is better | 1st / 8 | 8 Points | Best in this discipline |
| NoiseLower is better | 2nd / 8 | 69.9 dB | +1.20 dB |
| WearHigher is better | 1st / 8 | 49050 KM | Best in this discipline |
| ValueLower is better | 2nd / 8 | 12 Price/1000 | +1.00 Price/1000 |
| Rolling ResistanceLower is better | 4th / 8 | 7.15 kg/t | +1.29 kg/t |
| RangeHigher is better | 5th / 8 | 373.1 km | -36.90 km |
- EU Label
- B/A/70
- Price
- 590.00
Michelin Primacy 4+
215/55 R18 99V XL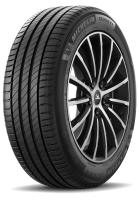
Category scores (% of best)
All discipline results (13)
Discipline positions compare the ranked tyres in this test, not the whole market. These are individual measurements, not weighted overall scores.
| Test | Position in discipline | Result | Gap to best |
|---|---|---|---|
| Dry BrakingLower is better | 3rd / 8 | 35.1 m | +1.50 m |
| Dry HandlingHigher is better | 4th / 8 | 90.8 km/h | -2.00 km/h |
| Wet BrakingLower is better | 5th / 8 | 43.2 m | +3.80 m |
| Wet HandlingHigher is better | 6th / 8 | 70.6 km/h | -3.80 km/h |
| Wet CircleLower is better | 7th / 8 | 12.86 s | +0.41 s |
| Straight AquaHigher is better | 7th / 8 | 65.8 km/h | -14.30 km/h |
| Curved AquaplaningHigher is better | 7th / 8 | 2.6 m/sec2 | -0.42 m/sec2 |
| Subj. ComfortHigher is better | 2nd / 8 | 7 Points | -1.00 Points |
| NoiseLower is better | 6th / 8 | 71.2 dB | +2.50 dB |
| WearHigher is better | 2nd / 8 | 44920 KM | -4,130.00 KM |
| ValueLower is better | 8th / 8 | 16.4 Price/1000 | +5.40 Price/1000 |
| Rolling ResistanceLower is better | 2nd / 8 | 6.51 kg/t | +0.65 kg/t |
| RangeHigher is better | 3rd / 8 | 377.2 km | -32.80 km |
- EU Label
- B/A/70
- Price
- 735.00
Falken e.Ziex
215/55 R18 99V XL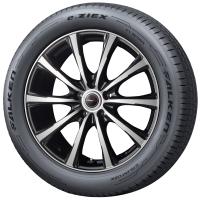
Category scores (% of best)
All discipline results (13)
Discipline positions compare the ranked tyres in this test, not the whole market. These are individual measurements, not weighted overall scores.
| Test | Position in discipline | Result | Gap to best |
|---|---|---|---|
| Dry BrakingLower is better | 4th / 8 | 35.7 m | +2.10 m |
| Dry HandlingHigher is better | 7th / 8 | 90.2 km/h | -2.60 km/h |
| Wet BrakingLower is better | 7th / 8 | 45.6 m | +6.20 m |
| Wet HandlingHigher is better | 7th / 8 | 69.3 km/h | -5.10 km/h |
| Wet CircleLower is better | 4th / 8 | 12.68 s | +0.23 s |
| Straight AquaHigher is better | 3rd / 8 | 72.6 km/h | -7.50 km/h |
| Curved AquaplaningHigher is better | 4th / 8 | 2.84 m/sec2 | -0.18 m/sec2 |
| Subj. ComfortHigher is better | 2nd / 8 | 7 Points | -1.00 Points |
| NoiseLower is better | 5th / 8 | 70.9 dB | +2.20 dB |
| WearHigher is better | 5th / 8 | 36790 KM | -12,260.00 KM |
| ValueLower is better | 3rd / 8 | 14.9 Price/1000 | +3.90 Price/1000 |
| Rolling ResistanceLower is better | 1st / 8 | 5.86 kg/t | Best in this discipline |
| RangeHigher is better | 1st / 8 | 410 km | Best in this discipline |
- EU Label
- A/A/72
- Price
- 550.00
Firestone Roadhawk 2 ENLITEN
215/55 R18 99V XL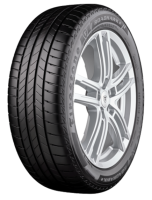
Category scores (% of best)
All discipline results (13)
Discipline positions compare the ranked tyres in this test, not the whole market. These are individual measurements, not weighted overall scores.
| Test | Position in discipline | Result | Gap to best |
|---|---|---|---|
| Dry BrakingLower is better | 6th / 8 | 36.6 m | +3.00 m |
| Dry HandlingHigher is better | 6th / 8 | 90.4 km/h | -2.40 km/h |
| Wet BrakingLower is better | 3rd / 8 | 41.8 m | +2.40 m |
| Wet HandlingHigher is better | 4th / 8 | 72 km/h | -2.40 km/h |
| Wet CircleLower is better | 5th / 8 | 12.7 s | +0.25 s |
| Straight AquaHigher is better | 1st / 8 | 80.1 km/h | Best in this discipline |
| Curved AquaplaningHigher is better | 1st / 8 | 3.02 m/sec2 | Best in this discipline |
| Subj. ComfortHigher is better | 2nd / 8 | 7 Points | -1.00 Points |
| NoiseLower is better | 7th / 8 | 72 dB | +3.30 dB |
| WearHigher is better | 8th / 8 | 28510 KM | -20,540.00 KM |
| ValueLower is better | 6th / 8 | 15.6 Price/1000 | +4.60 Price/1000 |
| Rolling ResistanceLower is better | 6th / 8 | 7.33 kg/t | +1.47 kg/t |
| RangeHigher is better | 7th / 8 | 352.6 km | -57.40 km |
- EU Label
- B/A/71
- Price
- 445.00
Yokohama BluEarth XT AE61
215/55 R18 99V XL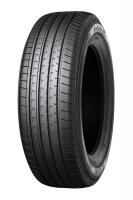
Category scores (% of best)
All discipline results (13)
Discipline positions compare the ranked tyres in this test, not the whole market. These are individual measurements, not weighted overall scores.
| Test | Position in discipline | Result | Gap to best |
|---|---|---|---|
| Dry BrakingLower is better | 6th / 8 | 36.6 m | +3.00 m |
| Dry HandlingHigher is better | 5th / 8 | 90.5 km/h | -2.30 km/h |
| Wet BrakingLower is better | 6th / 8 | 44.9 m | +5.50 m |
| Wet HandlingHigher is better | 5th / 8 | 71.5 km/h | -2.90 km/h |
| Wet CircleLower is better | 3rd / 8 | 12.67 s | +0.22 s |
| Straight AquaHigher is better | 8th / 8 | 63.7 km/h | -16.40 km/h |
| Curved AquaplaningHigher is better | 8th / 8 | 2.58 m/sec2 | -0.44 m/sec2 |
| Subj. ComfortHigher is better | 7th / 8 | 6 Points | -2.00 Points |
| NoiseLower is better | 1st / 8 | 68.7 dB | Best in this discipline |
| WearHigher is better | 7th / 8 | 30280 KM | -18,770.00 KM |
| ValueLower is better | 7th / 8 | 15.7 Price/1000 | +4.70 Price/1000 |
| Rolling ResistanceLower is better | 7th / 8 | 7.58 kg/t | +1.72 kg/t |
| RangeHigher is better | 5th / 8 | 373.1 km | -36.90 km |
- EU Label
- C/A/68
- Price
- 475.00
Goodride Solmax 1
215/55 R18 99V XL
Category scores (% of best)
All discipline results (13)
Discipline positions compare the ranked tyres in this test, not the whole market. These are individual measurements, not weighted overall scores.
| Test | Position in discipline | Result | Gap to best |
|---|---|---|---|
| Dry BrakingLower is better | 8th / 8 | 37.8 m | +4.20 m |
| Dry HandlingHigher is better | 8th / 8 | 88.2 km/h | -4.60 km/h |
| Wet BrakingLower is better | 8th / 8 | 48.7 m | +9.30 m |
| Wet HandlingHigher is better | 8th / 8 | 68.4 km/h | -6.00 km/h |
| Wet CircleLower is better | 8th / 8 | 13.03 s | +0.58 s |
| Straight AquaHigher is better | 6th / 8 | 67.5 km/h | -12.60 km/h |
| Curved AquaplaningHigher is better | 3rd / 8 | 2.85 m/sec2 | -0.17 m/sec2 |
| Subj. ComfortHigher is better | 8th / 8 | 5 Points | -3.00 Points |
| NoiseLower is better | 4th / 8 | 70.3 dB | +1.60 dB |
| WearHigher is better | 6th / 8 | 31030 KM | -18,020.00 KM |
| ValueLower is better | 1st / 8 | 11 Price/1000 | Best in this discipline |
| Rolling ResistanceLower is better | 5th / 8 | 7.22 kg/t | +1.36 kg/t |
| RangeHigher is better | 4th / 8 | 373.2 km | -36.80 km |
- EU Label
- X/X/72
- Price
- 340.00
These are great tests and the results are very helpful. However, I have a 2020 Tesla Model Y that have 255/40R20 so it's harder or impossible to find in your test fleet. In my location of Minneapolis it's VERY common to have dedicated snows (mine are Sottozero 3) and a good All Season for the rest of the year. It turns out finding a good 3+ seasons tire in my size is not easy. I must walk thru a whole series of trade-offs to get a few remaining features I can live with. I can find a summer tire with does well dry & wet & handling & braking. But replacing that soft rubber every 25K miles? I managed nearly 30K miles out of the original Eagle F1 that came with my Model Y (they've changed that now) only because I have experience driving a 4200 pound over-powered car before. It's not the weight its the heavy foot. Taking the highway cloverleaf ramp at 55 mph when it's 90 degrees F means you rub off 1000 hwy miles in 15 seconds. Anyway, some tire testing with my tire size requirements would be immensely helpful. You do great testing! Thank you for that work.
I am in Canada and Hankook has the winter version of the iON. It's called the ION icept
That's a lot of difference a tire can make on the range! Is there any data on this publication at what sort of speed range tests were performed?
I didn't see that data, sorry.
This is a great question! From what I understand, the impact of tires on range is much smaller at highway speeds. So if this test was run at highway speeds, you might see as much as 2x this impact at slower speeds, versus if this test was done at lower speeds, the impact could be as little as 1/2 of this at highway speeds
I believe Autobild usually run the tyres on an oval around 80kmh but I would need to check.
A tyres impact remains relatively constant but you are correct that the aero factor squares so at higher speeds the air is a bigger issue.
But I couldn't find the RANGE test. What is it? 410.00 km means what?
The 410km is the estimated ev range with that tyre based on the range test.
Shouldn´t the range scale be the other way around? I believe the Falken should have a 100% grade and be the 1st and the Continental 84%, being the 8th.
Which chart are you referring to?
The last one
Yes you are correct, nice spot. Let me fix that.