

Bridgestone vs Continental
379 shared professional tests: Continental finished ahead in 270, Bridgestone in 95 and 14 were drawn. Owners rate Continental 7.5 and Bridgestone 7.1 out of 10 across 6,634 reviews.
The quick answer
 Bridgestone
Premium · 210 tyres on sale · Bridgestone Group
 Continental
Premium · 131 tyres on sale · Continental Group
Continental leads in more of the categories we measure. Built from every professional test both brands entered and every vetted owner review we hold for their tyres - the evidence is all further down the page. Data updated October 29, 2026.

Bridgestone vs Continental at a glance
Bridgestone and Continental are both premium tyre brands with huge global reach - Bridgestone founded in 1931 in Tokyo and Continental founded in 1871 in Germany.
Looking across a large body of professional group tests and thousands of owner reviews, the picture is fairly consistent: Continental tends to finish higher more often, while Bridgestone more often shows flashes of advantage in particular wet-control areas and typically undercuts Continental on price in like-for-like test line-ups.
| Category | Bridgestone | Continental | Winner |
|---|---|---|---|
| Overall test record | 95 wins | 270 wins | Continental |
| Wet Braking | 39.05 m | 38.74 m | Continental |
| Dry Braking | 38.59 m | 38.62 m | Continental |
| Snow Braking | 24.1 m | 23.78 m | Continental |
| Rolling Resistance | 7.92 kg/t | 7.72 kg/t | Continental |
| Noise | 71.74 dB | 71.3 dB | Continental |
| Tread life (wear tests) | 40,314 km | 44,660 km | Continental |
| Price | cheaper in 112 of 144 tests | cheaper in 26 of 144 tests | Bridgestone |
| Overall owner score | 7.1 / 10 | 7.5 / 10 | Continental |
Head-to-head test record
Across 379 professional tests where both brands fielded a tyre, Continental finished ahead in 270 and Bridgestone in 95 (14 drew).
By season
| Category | shared tests | Bridgestone | Continental | draws |
|---|---|---|---|---|
| Summer | 187 | 39 | 142 | 6 |
| Winter | 124 | 35 | 84 | 5 |
| All Season | 65 | 20 | 42 | 3 |
| All Weather | 2 | 0 | 2 | 0 |
The cleanest signal is the shared-test head-to-head record - 359 tests where both brands appeared and each brand is represented by its best-placed tyre: Continental wins 255 to Bridgestone's 91, with 13 draws. The average finishing position is also notably higher for Continental (83 average finish percentile vs 61.5), suggesting it is not just winning more often but also placing nearer the front more consistently. In the last 5 years the pattern holds - across 139 shared tests Continental leads 91 wins to 41 (7 draws), so this is not only a historical advantage.
How we count: only tests entered by both brands are used, and each brand is represented by its best-placed tyre in that test. Owner-review and label figures cover the brands' full current ranges.
Performance by metric
Averaged across shared tests, which brand leads each measured discipline and by how much.
Continental won 111 of 225 tests · 5.2% typical margin
Continental won 116 of 216 tests · 3.6% typical margin
each won 90 of 181 tests
Continental won 100 of 166 tests · 8.5% typical margin
Continental won 99 of 148 tests · 1.4% typical margin
Continental won 74 of 120 tests · 3.9% typical margin
Bridgestone won 61 of 108 tests · 7.9% typical margin
Continental won 53 of 101 tests · 1.1% typical margin
Bridgestone won 59 of 101 tests · 1.9% typical margin
Continental won 48 of 75 tests · 2.6% typical margin
Continental won 33 of 65 tests
Continental won 37 of 62 tests · 1.1% typical margin
Bridgestone won 49 of 69 tests · 4.7% typical margin
Continental won 35 of 69 tests · 2.6% typical margin
Continental won 43 of 61 tests · 3% typical margin
Continental won 32 of 58 tests · 3.2% typical margin
Continental won 34 of 52 tests · 5.8% typical margin
Continental won 33 of 48 tests · 1.2% typical margin
each won 18 of 36 tests
each won 17 of 36 tests
Continental won 18 of 32 tests · 0.7% typical margin
Bridgestone won 22 of 32 tests · 1.5% typical margin
Continental won 22 of 32 tests · 1.7% typical margin
Continental won 15 of 21 tests · 2.2% typical margin
Bridgestone won 49 of 59 tests · 5.2% typical margin
Bridgestone won 34 of 59 tests · 4.4% typical margin
Continental won 38 of 49 tests · 5.5% typical margin
Bridgestone won 26 of 45 tests · 3.9% typical margin
Continental won 30 of 43 tests · 6.4% typical margin
Continental won 26 of 37 tests · 1.3% typical margin
Bridgestone won 18 of 33 tests · 7.5% typical margin
Bridgestone won 17 of 27 tests · 1.3% typical margin
Continental won 16 of 27 tests · 1.8% typical margin
Continental won 19 of 26 tests · 4.5% typical margin
Continental won 23 of 26 tests · 3.4% typical margin
Continental won 11 of 20 tests · 2.1% typical margin
Continental won 65 of 95 tests · 6.1% typical margin
Continental won 61 of 94 tests · 3.1% typical margin
Continental won 39 of 77 tests · 2.3% typical margin
each won 35 of 70 tests
Continental won 40 of 62 tests · 1.7% typical margin
Continental won 26 of 42 tests · 1.3% typical margin
Bridgestone won 26 of 42 tests · 2.4% typical margin
Bridgestone won 24 of 38 tests · 8.1% typical margin
Bridgestone won 18 of 35 tests · 3.1% typical margin
Continental won 17 of 31 tests · 1.2% typical margin
Continental won 18 of 29 tests
Continental won 14 of 28 tests
Across core test metrics, Continental holds more category leadership, especially on efficiency, refinement and winter performance. It leads rolling resistance (7.71 vs 7.93 kg/t, 94 wins to 58) and objective noise (71.27 vs 71.69 dB, 92 wins to 42), and it is ahead on snow braking (23.58 vs 23.91 m, 63 wins to 38) plus a broad set of snow and ice measures (for example ice braking wins 14 to 3). Bridgestone's strongest technical counters are in wet dynamics - it leads curved aquaplaning (8.26 vs 8.07 m/sec2, 55 wins to 41) and wet handling in the km/h format (58 wins to 35), and it is narrowly the leader on wet braking overall by the package's call (106 wins to 99, 38.98 vs 38.73 m) even though the averages are very close. Straight aquaplaning is essentially level overall (84 wins each).
Typical margin is the average gap between the two brands within a single test. Test conditions vary, so it can be larger than the difference between the overall averages shown. Judged scores use a different scale in each test, so only the win record is comparable.
Which brand wins each season
Head-to-head test wins by season.
Continental leads 84 to 35 here
- Bridgestone strongest at
- Subj. Noise
- Continental strongest at
- Subj. Dry Handling
Continental leads 42 to 20 here
- Bridgestone strongest at
- Value
- Continental strongest at
- Wear
Continental leads 142 to 39 here
- Bridgestone strongest at
- Subj. Wet Handling
- Continental strongest at
- Subj. Noise
By season in shared tests, Continental has the upper hand in all the big buckets: Summer is 140 wins to 38 (6 draws) across 184 tests; Winter is 79 to 33 (5 draws) across 117 tests; All Season is 35 to 18 (2 draws) across 55 tests. The interesting nuance is how the strengths express themselves: in Summer, Continental leads wet braking (64 wins to 27) and dry braking (60 to 32) and also noise (40 to 17), while Bridgestone's summer advantages show up in wet handling (26 to 16) and curved aquaplaning (24 to 13). In Winter, Bridgestone stands out specifically on wet braking (49 wins to 13) and has a slight edge on snow traction (16 to 15), but Continental leads the rest of the winter picture including dry braking (38 to 17), rolling resistance (32 to 15) and noise (30 to 15). In All Season tests, Bridgestone is very strong on dry braking (43 to 7) and also leads wet braking (30 to 20), straight aquaplaning (22 to 16), curved aquaplaning (15 to 11) and dry handling (16 to 6) - yet Continental still leads snow braking (31 to 10) as well as rolling resistance (27 to 9) and noise (22 to 10), which can heavily influence overall test placings.
What owners say
Owner reviews, vetted by hand before publication and weighted by how many reviews each tyre has. Ownership is not verified.
Owner feedback broadly aligns with the test data in terms of overall satisfaction, with Continental ahead overall at 7.46 out of 10 from 3168 reviews versus Bridgestone's 7.08 from 3334. Continental also leads on most 'feel' and confidence subscores - dry grip (8.52 vs 8.18), wet grip (7.92 vs 7.26), handling (7.65 vs 7.3) and comfort (7.58 vs 6.75). Two ownership signals worth weighting heavily are tread life perception and repurchase intent: Bridgestone is slightly ahead on owner-reported wear (6.74 vs 6.62), but Continental is ahead on buy-again (6.63 vs 6.2). Reported miles per review are similar (13542 Continental vs 13658 Bridgestone), so both brands have comparable usage depth in the review base.
Price & value
How long each brand lasts, and how they compare on price.
Tread life (wear tests)
Continental lasted longer in wear testing, winning 38 of 54 tests by an average of 21.4%.
Price
Bridgestone was the cheaper of the two in 112 of 144 shared tests.
On average Bridgestone cost about 5.2% less than Continental.
On tread life in professional wear testing, Continental has a clear advantage: across 48 wear tests it averages 44842 km versus 40105.56 km for Bridgestone, winning 34 tests to 14 - an average gap of 22.7% in Continental's favour. Pricing in shared tests points the other way: over 131 tests Bridgestone is cheaper on average versus Continental by 5.1%, and is cheaper in far more of those tests (102) than Continental is (23). Put together, value depends on how you buy - Bridgestone more often looks like the lower up-front cost option in comparable test scenarios, while Continental more often offers longer measured lifespan that can offset a higher initial price.
Fuel economy & EU labels
Current range
How broad each brand's current line-up is.
Bridgestone
| Passenger Car | SUV / 4x4 | Motorcycle | Van | |
|---|---|---|---|---|
| Summer | 82 | 12 | 32 | 1 |
| All Season | 24 | 16 | 9 | 2 |
| Winter | 25 | 3 | - | 1 |
| All Weather | 2 | - | - | - |
Continental
| Passenger Car | SUV / 4x4 | Motorcycle | Van | |
|---|---|---|---|---|
| Summer | 37 | 7 | 16 | 4 |
| All Season | 19 | 16 | 1 | 2 |
| Winter | 23 | 3 | - | 2 |
| All Weather | 1 | - | - | - |
Bridgestone offers the broader catalogue by model count - 201 active tyres versus 127 for Continental - which increases the odds of finding a Bridgestone that matches a niche fitment or a specific driving brief. That said, total sizes are extremely close (5543 Bridgestone vs 5526 Continental), so both brands are widely available in real-world fitments. By season, Bridgestone has a much larger summer range (129 vs 64) and a larger all-season range (42 vs 34), while both are equal in winter model count (28 each). EV-labelled tyres are equal (2 each), and Bridgestone has a slight edge in all-terrain options (5 vs 4).
Recommended picks per category
The top-rated current tyres from each brand, by season.
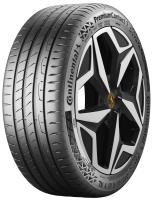
Summer
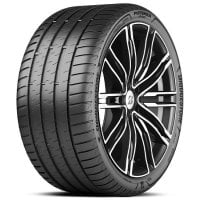

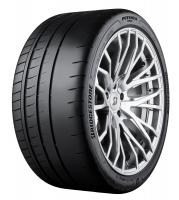
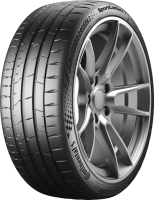
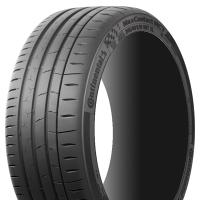
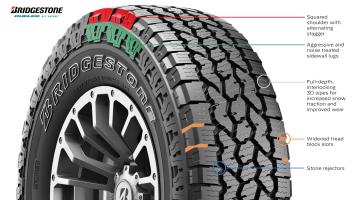
All Season
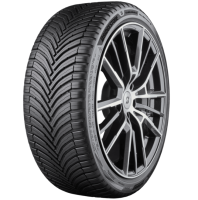
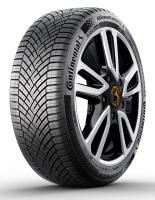
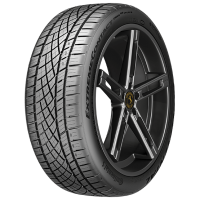

Winter
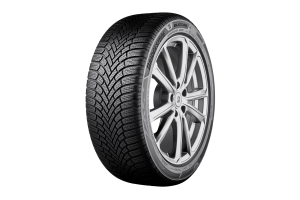
All Weather
 SecureContact AW
8.5 score
Popular Bridgestone vs Continental tyre matchups
Head-to-head comparisons between specific tyres from these brands.
 Bridgestone Turanza 6 vs Continental PremiumContact 7
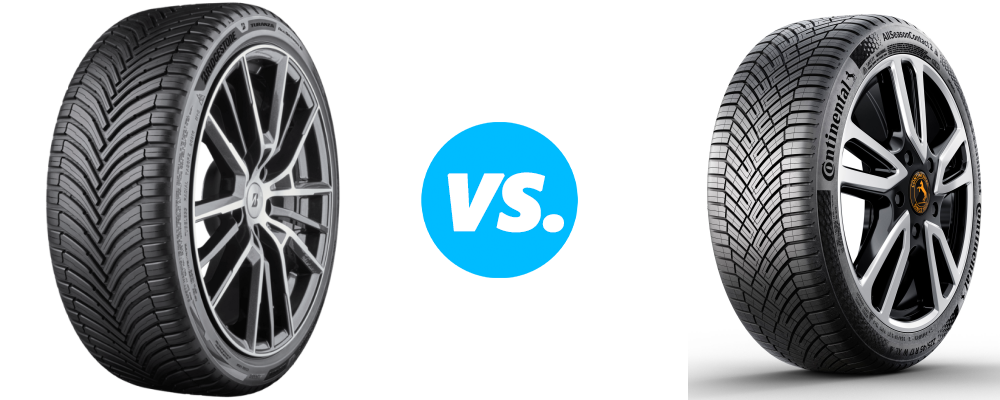 Bridgestone Turanza All Season 6 vs Continental AllSeasonContact 2
 Bridgestone Blizzak 6 vs Continental WinterContact TS 870
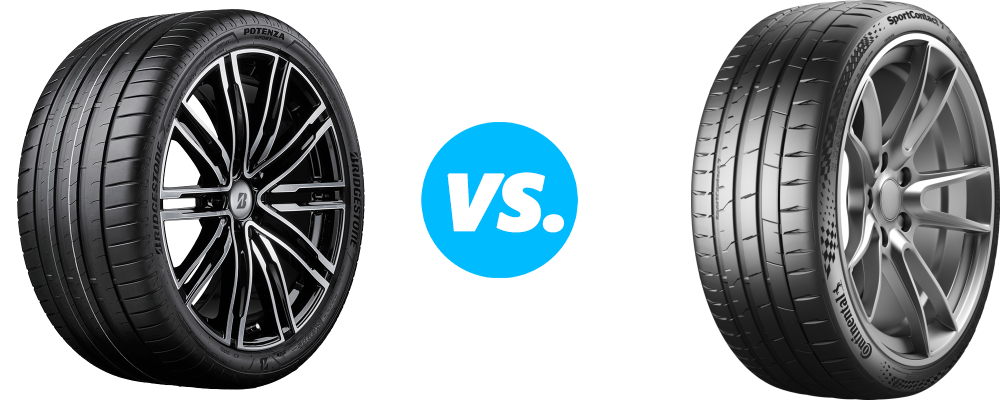 Bridgestone Potenza Sport vs Continental SportContact 7
 Bridgestone Blizzak LM005 vs Continental WinterContact TS 870
 Bridgestone Potenza Sport Evo vs Continental SportContact 7
Frequently asked questions
Is Bridgestone better than Continental?
Across 379 shared professional tests, Continental finished ahead of Bridgestone in 270 (14 drew), and holds a higher owner-review score of 7.5 vs 7.1 out of 10. Bridgestone leads on tread life and value.
Which is better in the wet, Bridgestone or Continental?
In Wet Braking, Continental averaged 38.74 m versus 39.05 m, winning 111 of 225 shared tests. In Wet Handling, Bridgestone averaged 75.24 km/h versus 75.26 km/h, winning 59 of 101 shared tests.
Which lasts longer, Bridgestone or Continental?
In independent tyre wear testing across 54 shared tests, Continental lasted longer, averaging 44,660 km versus 40,314 km (about 21.4% further) and winning 38 of them. Owners rate Bridgestone tread life a little higher, however, at 6.7 vs 6.6 out of 10.
Which is cheaper, Bridgestone or Continental?
Bridgestone is usually the cheaper choice, coming in lower in 112 of 144 shared tests, on average about 5.2% less than Continental.
Which is better in winter, Bridgestone or Continental?
Across 124 shared winter tests, Continental finished ahead in 84. 35% of its current range is 3PMSF winter-certified, versus 33% for Bridgestone. In Snow Braking, Continental averaged 23.78 m versus 24.1 m, winning 74 of 120 shared tests.
Which brand is more fuel efficient, Bridgestone or Continental?
Fuel economy and EV range come down to rolling resistance. In Rolling Resistance, Continental averaged 7.72 kg/t versus 7.92 kg/t, winning 100 of 166 shared tests. 46% of Continental's current range earns an A or B EU fuel-efficiency grade, versus 34% for Bridgestone.
Which is better for electric cars, Bridgestone or Continental?
For an EV the priorities are low rolling resistance for range and low noise for a quiet cabin. In rolling-resistance testing, which directly drives EV range, Continental led 100 of 166 shared tests.
Which brand is quieter and more comfortable, Bridgestone or Continental?
Owners rate Continental higher for comfort, at 7.6 vs 6.7 out of 10. In Noise, Continental averaged 71.3 dB versus 71.74 dB, winning 99 of 148 shared tests.
Would owners buy Bridgestone or Continental again?
Continental owners are more likely to buy the same brand again, scoring 6.6 vs 6.2 out of 10 on would-buy-again across 6,634 combined reviews.
Final verdict
Category-by-category, Continental leads the scoreboard where most group tests are decided - overall shared-test wins (255-91), summer and winter shared-test records (140-38 in Summer; 79-33 in Winter), efficiency and refinement (rolling resistance 94-58; noise 92-42), and measured longevity (44842 km vs 40105.56 km). Bridgestone's strongest case is more targeted: wet stability and control metrics (notably curved aquaplaning and wet handling), standout all-season metric performance on dry and wet braking within all-season tests, and typically lower prices in comparable test line-ups.
Overall lean: Continental leads in more areas and does so consistently, making it the safer bet if you want the highest probability of strong test performance, quieter running and longer measured wear life. Bridgestone is the better buy if your priority is keeping purchase cost down while still buying premium, and if you especially value wet-road control traits or want a wider choice of models - particularly in summer fitments.