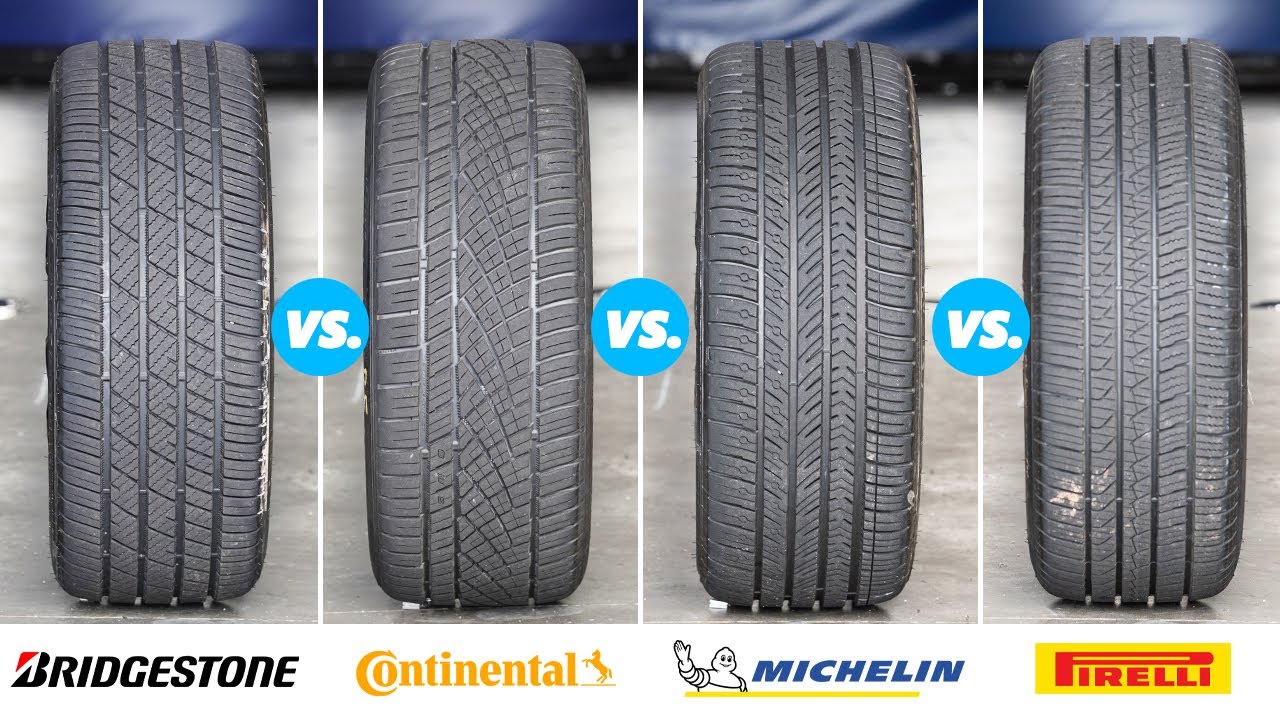
In this mini test I compare the plus version of the best ultra high performance all season tyres on the market, the Bridgestone Potenza RE980AS+, the Continental ExtremeContact DWS06 Plus, the Michelin Pilot Sport All Season 4 and the Pirelli P Zero All Season Plus in the dry, wet and snow to see which is the best tyre overall! Can the current champion, the Michelin Pilot Sport All Season 4 retain it's lead? Only one way to find out!

Test Data
- Test Driver
- Jonathan Benson
- Tyre Size
- 245/40 R18
- Test Location
- Professional Proving Ground
- Test Year
- 2022
- Tyres Tested
- 4
Show full testing methodology
Hide methodology
Every tyre is tested using calibrated instrumented measurement and structured subjective assessment. Reference tyres are retested throughout each session to correct for changing conditions, ensuring fair, repeatable comparisons. Multiple reference sets are used where needed so that control tyre wear does not affect accuracy.
We use professional-grade testing equipment including GPS data loggers, accelerometers, and calibrated microphones. All tyres are broken in and conditioned before testing begins. For full details on our equipment, preparation process, and calibration procedures, see our complete testing methodology.
Categories Tested
Dry Braking
For dry braking, I drive the test vehicle at an entry speed of 110 km/h and apply full braking effort to a standstill with ABS active on clean, dry asphalt. I typically use an 100–5 km/h measurement window. My standard programme is five runs per tyre set where possible, although the sequence can extend to as many as fifteen runs if conditions and tyre category justify it. I analyse the full set of runs and discard statistical outliers before averaging. Reference tyres are run repeatedly throughout the session to correct for changing conditions.
Dry Handling
For dry handling, I drive at the limit of adhesion around a dedicated handling circuit with ESC disabled where possible so I can assess the tyre's natural balance, transient response, and limit behaviour without electronic intervention masking the result. I usually complete between two and five timed laps per tyre set, depending on the circuit, tyre type, and consistency of conditions. I exclude laps affected by clear driver error or obvious environmental inconsistency. Control runs are carried out frequently throughout the session, and I often use multiple sets of control tyres so that wear on the references does not become a meaningful variable. For more track-focused products, I also do endurance testing, which is a set number of laps at race pace to determine tire wear patterns and heat resistance over longer driving.
Subj. Dry Handling
Objective data is only part of the picture, so I also carry out a structured subjective handling assessment at the limit of adhesion on a dedicated dry handling circuit. I score steering precision, steering response, turn-in behaviour, mid-corner balance, corner-exit traction, breakaway characteristics, and overall confidence using a standardised 1–10 scale used consistently across my testing. The final assessment combines numeric scoring with written technical commentary. I complete familiarisation laps on the control tyre before evaluating each candidate.
Wet Braking
For wet braking, I drive the test vehicle at an entry speed of 88 km/h and apply full braking effort to a standstill with ABS active on an asphalt surface with a controlled water film. I typically use an 80–5 km/h measurement window to isolate tyre performance from variability in the initial brake application. My standard programme is eight runs per tyre set where possible, although the sequence can extend to as many as fifteen runs if conditions and tyre category justify it. I analyse the full set of runs and discard statistical outliers before averaging. To correct for changing conditions, I run reference tyres repeatedly throughout the session — in wet testing, typically every three candidate test sets.
Wet Handling
For wet handling, I drive at the limit of adhesion around a dedicated handling circuit. I generally use specialist wet circuits with kerb-watering systems designed to maintain a consistent surface condition. ESC is disabled where possible so I can assess the tyre's natural balance, transient response, and limit behaviour without electronic intervention masking the result. I usually complete between two and five timed laps per tyre set, depending on the circuit, tyre type, and consistency of conditions. I exclude laps affected by clear driver error or obvious environmental inconsistency. Control runs are carried out frequently throughout the session, and I often use multiple sets of control tyres so that wear on the references does not become a meaningful variable.
Subj. Wet Handling
Objective data is only part of the picture, so I also carry out a structured subjective handling assessment at the limit of adhesion on a dedicated wet handling circuit. I score steering precision, steering response, turn-in behaviour, mid-corner balance, aquaplaning resistance, breakaway characteristics, and overall confidence using a standardised 1–10 scale used consistently across my testing. The final assessment combines numeric scoring with written technical commentary. I complete familiarisation laps on the control tyre before evaluating each candidate.
Wet Circle
For wet lateral grip testing, I use a circular track of fixed radius, typically between 30 and 50 metres, broadly aligned with ISO 4138 principles. The surface is wetted in a controlled and repeatable manner. I progressively increase speed until the maximum sustainable cornering speed is reached. I normally record multiple laps in both clockwise and counterclockwise directions to reduce the influence of camber, banking, or directional track bias. I then calculate average lateral acceleration and compare the result with the reference tyre.
Snow Braking
For snow braking, I drive the test vehicle at an entry speed of 50 km/h and apply full braking effort to a standstill with ABS active on a groomed, compacted snow surface, measuring 45-5 km/h. I generally use a wide VDA (vehicle dynamic area) and progressively move across the surface between runs so that no tyre ever brakes on the same piece of snow twice. My standard programme is twelve runs per tyre set, although the sequence can extend further if the data justify it. I analyse the full set of runs and discard statistical outliers before averaging. The surface is regularly groomed throughout the session. To correct for changing snow surface conditions, I run reference tyres repeatedly — typically every two candidate test sets.
Snow Traction
For snow traction, I accelerate the vehicle from rest on a groomed snow surface with traction control active and measure speed and time using GPS telemetry. I typically use a 5–35 km/h measurement window to reduce the influence of launch transients and powertrain irregularities. I use a wide VDA (vehicle dynamic area) and progressively move across the surface between runs so that no tyre ever accelerates on the same piece of snow twice. The surface is regularly groomed throughout the session. I complete multiple runs per tyre set and average the valid results. Reference tyres are run typically every two candidate test sets to correct for changing snow surface conditions.
Snow Handling
For snow handling, I drive at the limit of adhesion around a dedicated snow handling circuit with ESC disabled where possible. The circuit is groomed and prepared after every run while tyres are being changed, so each set runs on a consistently prepared surface. I usually complete between two and five timed laps per tyre set, excluding laps affected by clear driver error or obvious environmental inconsistency. Because snow surfaces degrade more rapidly than asphalt, control runs are carried out more frequently — typically every two candidate test sets.
Subj. Snow Handling
Objective data is only part of the picture, so I also carry out a structured subjective handling assessment at the limit of adhesion on a dedicated snow handling circuit. The circuit is groomed and prepared after every run while tyres are being changed, so each set runs on a consistently prepared surface. I score steering precision, turn-in behaviour, mid-corner balance, corner-exit traction, breakaway characteristics, and overall confidence on snow using a standardised 1–10 scale used consistently across my testing. The final assessment combines numeric scoring with written technical commentary. I complete familiarisation laps on the control tyre before evaluating each candidate.
Subj. Comfort
To assess comfort, I drive on a wide range of road surfaces (often dedicated comfort tracks at test facilities) at speeds from 50 to 120 km/h, including smooth motorway, coarse surfaces, expansion joints, broken pavement, and sharp-edged obstacles. I evaluate primary ride quality, secondary ride quality, impact harshness, seat-transmitted vibration, and the tyre's ability to absorb sharp inputs. Ratings are assigned on a 1–10 scale relative to the reference tyre.
Rolling Resistance
Rolling resistance is measured under controlled laboratory conditions in accordance with ISO 28580 and UNECE Regulation 117 Annex 6. The tyre is mounted on a test wheel and loaded against a large-diameter steel drum. After thermal stabilisation at the prescribed test speed, rolling resistance force is measured at the spindle and corrected according to the relevant procedure. The result is expressed as rolling resistance coefficient, typically in kg/tonne.
Standards:
ISO 4138
ISO 28580
UNECE Regulation 117 Annex 6
Read our complete testing methodology
Score Weighting
Hide Score Weighting
How each category is weighted in the overall score:
Dry
35%
Dry Braking
50%
Dry Handling
35%
Subj. Dry Handling
15%
Wet
35%
Wet Braking
50%
Wet Handling
30%
Subj. Wet Handling
10%
Wet Circle
10%
Snow
20%
Snow Braking
40%
Snow Traction
20%
Snow Handling
30%
Subj. Snow Handling
10%
Dry
The Michelin Pilot Sport All Season 4 lead during the dry braking test, narrowly beating the Continental ExtremeContact DWS06 Plus.
The dynamic response of the Pirelli P Zero All Season Plus had it leading a very close dry handling group.
- Pirelli P Zero All Season Plus
- Continental ExtremeContact DWS 06
- Michelin Pilot Sport All Season 4
- Bridgestone Potenza RE980AS Plus
Wet
Like in dry braking, the Michelin led the way in wet braking.
The Continental edged out the Michelin in wet handling.
- Continental ExtremeContact DWS 06
- Michelin Pilot Sport All Season 4
- Bridgestone Potenza RE980AS Plus
- Pirelli P Zero All Season Plus
The Continental also had the fastest lap during wet circle.
- Continental ExtremeContact DWS 06
- Michelin Pilot Sport All Season 4
- Pirelli P Zero All Season Plus
- Bridgestone Potenza RE980AS Plus
Snow
The snow braking test was led by the Bridgestone Potenza RE980AS+.
The Bridgestones lead extended during snow traction.
- Bridgestone Potenza RE980AS Plus
- Michelin Pilot Sport All Season 4
- Continental ExtremeContact DWS 06
- Pirelli P Zero All Season Plus
Rounding out the snow testing, the Bridgestone once again won snow handling, though the Michelin was the easiest tyre to drive of the four.
- Bridgestone Potenza RE980AS Plus
- Michelin Pilot Sport All Season 4
- Continental ExtremeContact DWS 06
- Pirelli P Zero All Season Plus
Comfort
The Michelin had a small lead in subjective comfort, rounding out the larger impacts a little better than the rest of the group.
- Michelin Pilot Sport All Season 4
- Continental ExtremeContact DWS 06
- Bridgestone Potenza RE980AS Plus
- Pirelli P Zero All Season Plus
Results
2022/23 UHP All Season Tyre TestWatch the full video of this test on YouTube Watch on YouTube
Shortest braking in the dry and wet, good wet handling, high grip in snow, good levels of comfort.
Could be a little more dynamic in handling in all conditions.
| Test |
# |
Result |
Best |
Diff |
% |
| Dry Braking |
1st |
37.25 M |
|
|
100% |
| Dry Handling |
3rd |
69.83 s |
69.53 s |
+0.3 s |
99.57% |
| Subj. Dry Handling |
3rd |
9.5 Points |
10 Points |
-0.5 Points |
95% |
| Test |
# |
Result |
Best |
Diff |
% |
| Wet Braking |
1st |
30.08 M |
|
|
100% |
| Wet Handling |
2nd |
39.08 s |
39.01 s |
+0.07 s |
99.82% |
| Subj. Wet Handling |
2nd |
9.75 Points |
10 Points |
-0.25 Points |
97.5% |
| Wet Circle |
2nd |
29.71 s |
29.13 s |
+0.58 s |
98.05% |
| Test |
# |
Result |
Best |
Diff |
% |
| Snow Braking |
2nd |
14.34 M |
13.87 M |
+0.47 M |
96.72% |
| Snow Traction |
2nd |
5.84 s |
5.17 s |
+0.67 s |
88.53% |
| Snow Handling |
2nd |
102.29 s |
100.14 s |
+2.15 s |
97.9% |
| Subj. Snow Handling |
1st |
10 Points |
|
|
100% |
| Test |
# |
Result |
Best |
Diff |
% |
| Subj. Comfort |
1st |
10 Points |
|
|
100% |
| Test |
# |
Result |
Best |
Diff |
% |
| Rolling Resistance |
1st |
9.69 kg / t |
|
|
100% |
Best wet handling, fastest wet circle, good in snow, good levels of comfort.
Average snow performance.
| Test |
# |
Result |
Best |
Diff |
% |
| Dry Braking |
2nd |
37.83 M |
37.25 M |
+0.58 M |
98.47% |
| Dry Handling |
2nd |
69.58 s |
69.53 s |
+0.05 s |
99.93% |
| Subj. Dry Handling |
2nd |
9.75 Points |
10 Points |
-0.25 Points |
97.5% |
| Test |
# |
Result |
Best |
Diff |
% |
| Wet Braking |
2nd |
31.24 M |
30.08 M |
+1.16 M |
96.29% |
| Wet Handling |
1st |
39.01 s |
|
|
100% |
| Subj. Wet Handling |
1st |
10 Points |
|
|
100% |
| Wet Circle |
1st |
29.13 s |
|
|
100% |
| Test |
# |
Result |
Best |
Diff |
% |
| Snow Braking |
3rd |
15.38 M |
13.87 M |
+1.51 M |
90.18% |
| Snow Traction |
3rd |
6.1 s |
5.17 s |
+0.93 s |
84.75% |
| Snow Handling |
3rd |
107.2 s |
100.14 s |
+7.06 s |
93.41% |
| Subj. Snow Handling |
2nd |
9.5 Points |
10 Points |
-0.5 Points |
95% |
| Test |
# |
Result |
Best |
Diff |
% |
| Subj. Comfort |
2nd |
9.5 Points |
10 Points |
-0.5 Points |
95% |
| Test |
# |
Result |
Best |
Diff |
% |
| Rolling Resistance |
2nd |
9.75 kg / t |
9.69 kg / t |
+0.06 kg / t |
99.38% |
Highest levels of grip in all snow tests.
Slightly reduced grip in the dry, less precise steering than the other tyres on test in the dry and wet.
| Test |
# |
Result |
Best |
Diff |
% |
| Dry Braking |
3rd |
38.95 M |
37.25 M |
+1.7 M |
95.64% |
| Dry Handling |
4th |
70.56 s |
69.53 s |
+1.03 s |
98.54% |
| Subj. Dry Handling |
4th |
9 Points |
10 Points |
-1 Points |
90% |
| Test |
# |
Result |
Best |
Diff |
% |
| Wet Braking |
3rd |
33.28 M |
30.08 M |
+3.2 M |
90.38% |
| Wet Handling |
3rd |
40.67 s |
39.01 s |
+1.66 s |
95.92% |
| Subj. Wet Handling |
3rd |
9.5 Points |
10 Points |
-0.5 Points |
95% |
| Wet Circle |
4th |
30.12 s |
29.13 s |
+0.99 s |
96.71% |
| Test |
# |
Result |
Best |
Diff |
% |
| Snow Braking |
1st |
13.87 M |
|
|
100% |
| Snow Traction |
1st |
5.17 s |
|
|
100% |
| Snow Handling |
1st |
100.14 s |
|
|
100% |
| Subj. Snow Handling |
3rd |
9 Points |
10 Points |
-1 Points |
90% |
| Test |
# |
Result |
Best |
Diff |
% |
| Subj. Comfort |
3rd |
9 Points |
10 Points |
-1 Points |
90% |
| Test |
# |
Result |
Best |
Diff |
% |
| Rolling Resistance |
4th |
11.15 kg / t |
9.69 kg / t |
+1.46 kg / t |
86.91% |
Quick steering and good handling in the dry.
Longer dry and wet braking distances, limited grip in the snow, lower levels of comfort.
| Test |
# |
Result |
Best |
Diff |
% |
| Dry Braking |
4th |
40.6 M |
37.25 M |
+3.35 M |
91.75% |
| Dry Handling |
1st |
69.53 s |
|
|
100% |
| Subj. Dry Handling |
1st |
10 Points |
|
|
100% |
| Test |
# |
Result |
Best |
Diff |
% |
| Wet Braking |
4th |
35.6 M |
30.08 M |
+5.52 M |
84.49% |
| Wet Handling |
4th |
40.81 s |
39.01 s |
+1.8 s |
95.59% |
| Subj. Wet Handling |
3rd |
9.5 Points |
10 Points |
-0.5 Points |
95% |
| Wet Circle |
3rd |
29.86 s |
29.13 s |
+0.73 s |
97.56% |
| Test |
# |
Result |
Best |
Diff |
% |
| Snow Braking |
4th |
16.96 M |
13.87 M |
+3.09 M |
81.78% |
| Snow Traction |
4th |
6.61 s |
5.17 s |
+1.44 s |
78.21% |
| Snow Handling |
4th |
116.04 s |
100.14 s |
+15.9 s |
86.3% |
| Subj. Snow Handling |
4th |
8 Points |
10 Points |
-2 Points |
80% |
| Test |
# |
Result |
Best |
Diff |
% |
| Subj. Comfort |
4th |
8.75 Points |
10 Points |
-1.25 Points |
87.5% |
| Test |
# |
Result |
Best |
Diff |
% |
| Rolling Resistance |
3rd |
10.32 kg / t |
9.69 kg / t |
+0.63 kg / t |
93.9% |
Are these sold in Europe?
Trying to find UHP all season tires in 245/40 R20 and 275/35 R20 and nothing comes up :-/
Even bare all season (no UHP) are extremely hard to find.
They are not. Generally in Europe they like to sell a full winter and summer combination in the big wheel sizes.
Like many people, i would love to have those in Europe, even more because i live in the south of France, where the only time i see snow is when i go to the alps.
I guess your recommandation of the A005 would apply.
Thx in advance
Yeah, or the Hankook
The lack of UHP All Season in the EU is quite frustrating. I have an E53 in Belgium so there easily can be some snow but mostly dry/wet/ice is what we want. Is there an UHP winter tire that's super strong in the dry/wet that would make more sense in the EU specifically because we can't get these options that are available in NA? Issue is size too trying to fit them to 20 inch rims, getting those boxes checked, and having a fun tire for 0-10 degrees. Variable overload at this point unless anyone has some suggestions!
Something like the Conti TS870P or Michelin Pilot Alpin 5 would be where I'd look with that wheel size.
Appreciate the reply, thanks! Is that because with the thinner profile of the 20" Alpin 5 would be sort of inbetween a winter/UHP All Season - does it effect it? (the UHP all season we sadly don't get here)
It won't be anything like a US UHP all season, but it's probably the best option as you're unlikely to get EU all season tyres in those sizes.
Okay thanks! Sadly the Conti 870P doesn't come in my sizes (245/35 and 275/30) and the Pilot Alpin 5 only in one size (245/235). Do you think it's a bad idea to run that square on all 4 wheels vs going with another option that has both those sizes (Wintrac Pro, for example, they have in stock.. it's wet a lot here). The shop basically said they won't do it unless I have a certificate signed from Merc saying it's okay. Looking for a fun wheel so that's probably the best solution vs LM005 which you've mentioned is a bit boring (unless I'm misremembering). Cheers!
check your handbook, they will hopefully offer a square size for winter, many do!
I’m looking at buying some UHP All season tyres. Ideally the Continental/Michelin’s but I’m struggling to find any of the premium brands in the UK. I’m looking for 215/40/R18.
Do you have any information on this sector of tyres and their availability in the UK at the moment?
UHP all season tyres sadly aren't available in the EU;
Thanks for your reply!
My car (i20N) comes standard with Pirelli P Zeros which I’d be keen to change ideally.
I feel I have 3 options:
1) Use the P Zeros for most of the year, swapping to 215/45/r17 Winter or All Season tyres (on smaller rims) for the few months needed here in Scotland. Eventually swapping the P Zeros out to a better performing summer tyre when they wear out.
2) Not bother with the hassle of getting another set of wheels/tyres and just swap the P Zeros out for a summer performance biased AS tyre that could just about cope in the winter.
My question is, with option 1: would you recommend an all season for the winter months vs a full winter (for Scotland), and which tyre would you recommend specifically based on this?
With option 2: is there any AS tyre available in the UK (in 215/40/r18) that comes close to UHP AS tyres available in North America? If so, which? Is this an option I should even consider for the i20 N?
Thanks in advance, apologies for the long ramble!
I'm a big fan of 2 sets of wheels, and sadly there's no real version of the US UHPAS in the EU. Maybe the A005 gets closest at the moment.