

Continental vs Michelin
467 shared professional tests: Continental finished ahead in 282, Michelin in 169 and 16 were drawn. Owners rate Michelin 8.1 and Continental 7.5 out of 10 across 7,310 reviews.
The quick answer
 Continental
Premium · 131 tyres on sale · Continental Group
 Michelin
Premium · 171 tyres on sale · Michelin Group
Michelin leads in more of the categories we measure. Built from every professional test both brands entered and every vetted owner review we hold for their tyres - the evidence is all further down the page. Data updated October 30, 2026.

Continental vs Michelin at a glance
Continental and Michelin are both premium brands with deep testing histories - Continental (Germany, founded 1871) and Michelin (France, founded 1889) each appear in well over 500 professional tests overall.
The numbers paint a clear split: Continental more often comes out ahead in direct, like-for-like group tests, especially in summer and winter fitments, while Michelin tends to win the longer-game measures that owners feel most - wear, comfort, buy-again intent and a consistently higher review score.
| Category | Continental | Michelin | Winner |
|---|---|---|---|
| Overall test record | 282 wins | 169 wins | Continental |
| Wet Braking | 38.18 m | 38.83 m | Continental |
| Dry Braking | 38.09 m | 37.68 m | Michelin |
| Snow Braking | 22.84 m | 22.79 m | Michelin |
| Rolling Resistance | 7.72 kg/t | 7.78 kg/t | Continental |
| Noise | 71.22 dB | 70.94 dB | Michelin |
| Tread life (wear tests) | 44,023 km | 48,963 km | Michelin |
| Price | cheaper in 138 of 164 tests | cheaper in 21 of 164 tests | Continental |
| Overall owner score | 7.5 / 10 | 8.1 / 10 | Michelin |
Head-to-head test record
Across 467 professional tests where both brands fielded a tyre, Continental finished ahead in 282 and Michelin in 169 (16 drew).
By season
| Category | shared tests | Continental | Michelin | draws |
|---|---|---|---|---|
| Summer | 232 | 143 | 83 | 6 |
| Winter | 161 | 107 | 48 | 6 |
| All Season | 70 | 31 | 36 | 3 |
| All Weather | 3 | 0 | 2 | 1 |
The cleanest comparison is the 449 shared tests where both brands competed and each brand is represented by its best-placed tyre - here Continental wins 273 to Michelin's 163, with 13 draws, and it also posts the stronger average finish percentile (81.6 vs 72.8). That pattern holds in recent data too: across the last 5 years (165 shared tests), Continental leads 92 to 67 with 6 draws, suggesting its test performance advantage is not just historical noise. Looking beyond head-to-heads, Continental also converts tests into top results more often overall (212 wins and a 73% podium rate from 516 tests) than Michelin (124 wins and a 58% podium rate from 521 tests).
How we count: only tests entered by both brands are used, and each brand is represented by its best-placed tyre in that test. Owner-review and label figures cover the brands' full current ranges.
Performance by metric
Averaged across shared tests, which brand leads each measured discipline and by how much.
Continental won 166 of 271 tests · 4.7% typical margin
Michelin won 146 of 263 tests · 3.8% typical margin
Michelin won 119 of 215 tests · 4% typical margin
Continental won 95 of 193 tests · 6.9% typical margin
Michelin won 101 of 178 tests · 1.3% typical margin
Michelin won 77 of 134 tests · 3.6% typical margin
Continental won 61 of 116 tests · 1% typical margin
Continental won 64 of 115 tests · 10.1% typical margin
Continental won 71 of 114 tests · 1.8% typical margin
Continental won 68 of 102 tests · 2.3% typical margin
Michelin won 34 of 86 tests
Continental won 39 of 85 tests
Continental won 75 of 126 tests · 5.2% typical margin
Continental won 71 of 125 tests · 2.7% typical margin
Michelin won 61 of 99 tests · 3% typical margin
Michelin won 56 of 92 tests · 7.3% typical margin
Michelin won 46 of 80 tests · 1.4% typical margin
Continental won 29 of 53 tests · 1.3% typical margin
Continental won 35 of 53 tests · 2.2% typical margin
Continental won 28 of 52 tests · 2.4% typical margin
Continental won 32 of 47 tests · 1% typical margin
Michelin won 29 of 47 tests · 8.7% typical margin
Michelin won 22 of 46 tests
Continental won 23 of 44 tests
Continental won 47 of 82 tests · 4.3% typical margin
Michelin won 46 of 82 tests · 2.7% typical margin
Michelin won 39 of 74 tests · 3.5% typical margin
Continental won 39 of 70 tests · 5% typical margin
Michelin won 29 of 57 tests · 1.3% typical margin
Continental won 42 of 57 tests · 7.7% typical margin
Continental won 34 of 40 tests · 14.2% typical margin
Michelin won 27 of 38 tests · 3.6% typical margin
Continental won 21 of 34 tests · 0.7% typical margin
Continental won 14 of 34 tests · 1% typical margin
Michelin won 20 of 34 tests · 1.6% typical margin
Continental won 16 of 30 tests · 1.5% typical margin
Michelin won 55 of 61 tests · 6.2% typical margin
Continental won 43 of 61 tests · 4.1% typical margin
Michelin won 29 of 50 tests · 4.6% typical margin
Michelin won 28 of 45 tests · 4.4% typical margin
Continental won 21 of 43 tests · 5.1% typical margin
Michelin won 26 of 40 tests · 1.2% typical margin
Michelin won 18 of 29 tests · 0.9% typical margin
Continental won 22 of 27 tests · 2.1% typical margin
each won 13 of 27 tests
Continental won 12 of 27 tests · 2.5% typical margin
Michelin won 19 of 23 tests · 4% typical margin
Continental won 17 of 19 tests · 1.8% typical margin
Across individual test metrics, the brands trade places depending on what you value. Continental's calling cards are wet-road control and efficiency-leaning lab metrics: it leads Wet Braking (38.07 m vs 38.71 m, 153 wins to 101), Wet Handling (75.18 vs 74.66 km/h, 67 wins to 35, and also 69.83 vs 70.58 s, 64 wins to 33), plus Curved Aquaplaning (9.06 vs 8.95 m/sec2, 60 wins to 45) and Rolling Resistance (7.72 vs 7.78 kg/t, 89 wins to 83). Michelin's strengths cluster around dry-road stopping, refinement, and winter traction and durability: it leads Dry Braking (37.53 m vs 37.96 m, 138 wins to 104), Straight Aquaplaning speed (80.02 vs 79.78 km/h, 114 wins to 86), Noise (70.91 vs 71.19 dB, 95 wins to 67), and it has the stronger snow and ice set - Snow Braking (22.74 m vs 22.88 m, 67 wins to 49) and Ice Braking (14.06 m vs 14.74 m, 21 wins to 8). The biggest separation is wear testing: Michelin leads by a wide margin (49,351.52 km vs 44,615.8 km, 38 wins to 11).
Typical margin is the average gap between the two brands within a single test. Test conditions vary, so it can be larger than the difference between the overall averages shown. Judged scores use a different scale in each test, so only the win record is comparable.
Which brand wins each season
Head-to-head test wins by season.
Continental leads 143 to 83 here
- Continental strongest at
- Subj. Noise
- Michelin strongest at
- Abrasion
Continental leads 107 to 48 here
- Continental strongest at
- Subj. Dry Handling
- Michelin strongest at
- Subj. Noise
Michelin leads 36 to 31 here
- Continental strongest at
- Subj. Wet Handling
- Michelin strongest at
- Abrasion
By season, the head-to-head record is decisive in summer and winter, and flips in all-season. In Summer shared tests (228), Continental wins 142 to Michelin's 81 (5 draws), aligning with Continental leading key summer dynamics like wet braking (74 wins to 49), dry braking (70 to 48), dry handling (29 to 24) and wet handling (28 to 23), while Michelin counters with straight aquaplaning resistance (61 wins to 35), rolling resistance (55 to 30) and noise (46 to 28). In Winter shared tests (154), Continental again leads overall (103 wins to 46, with 5 draws) and dominates winter efficiency and water clearing measures like rolling resistance (41 wins to 10) and curved aquaplaning (32 to 5), but Michelin is the more consistent bet for snow traction metrics - snow braking (40 wins to 30) and snow traction (25 to 10), and it also edges dry braking in winter (37 wins to 30). All Season is where Michelin takes the overall head-to-head lead: across 63 shared tests it wins 33 to 27 (3 draws), driven by big advantages in all-season dry braking (51 wins to 3), straight aquaplaning (25 to 15), noise (22 to 13) and dry handling (17 to 9), while Continental retains clear strengths in all-season wet braking (37 wins to 17) and wet handling (20 to 4).
What owners say
Owner reviews, vetted by hand before publication and weighted by how many reviews each tyre has. Ownership is not verified.
Owner feedback reinforces the durability and comfort narrative for Michelin. From 3,961 reviews, Michelin averages 8.05 out of 10 overall vs Continental's 7.46 from 3,168 reviews, with Michelin ahead on the ownership signals that typically drive repeat purchasing: Wear (7.97 vs 6.62) and Buy Again (7.7 vs 6.63). Michelin is also rated higher for comfort (8.13 vs 7.58) and both wet and dry grip (8.18 vs 7.92 wet, 8.72 vs 8.52 dry). Continental still scores strongly where its testing record suggests it should - solid dry grip and wet grip - but owners report a noticeably lower wear experience than Michelin despite similar reported mileage per review (14,516 vs 13,542).
Price & value
How long each brand lasts, and how they compare on price.
Tread life (wear tests)
Michelin lasted longer in wear testing, winning 44 of 57 tests by an average of 17%.
Price
Continental was the cheaper of the two in 138 of 164 shared tests.
On average Continental cost about 7% less than Michelin.
Value splits into two different stories: purchase price and how long the tyre lasts. On price within shared tests (153 samples), Continental is cheaper on average versus Michelin by 7%, and it is cheaper in far more of those tests (128 vs 20), so it tends to be the lower-cost way into premium-level performance. But on tread life, Michelin is the longer-lasting option in controlled wear testing: across 50 wear tests it averages 49,351.52 km vs Continental's 44,615.8 km, winning 38 to 11 - a 15.9% average gap in Michelin's favour. In other words, Continental often wins on up-front spend, while Michelin more often repays with longer service life, which can narrow or outweigh the price difference depending on your annual mileage.
Fuel economy & EU labels
Current range
How broad each brand's current line-up is.
Continental
| Passenger Car | SUV / 4x4 | Motorcycle | Van | |
|---|---|---|---|---|
| Summer | 37 | 7 | 16 | 4 |
| All Season | 19 | 16 | 1 | 2 |
| Winter | 23 | 3 | - | 2 |
| All Weather | 1 | - | - | - |
Michelin
| Passenger Car | SUV / 4x4 | Motorcycle | Van | |
|---|---|---|---|---|
| Summer | 47 | 9 | 39 | 2 |
| All Season | 23 | 15 | 9 | 2 |
| Winter | 17 | 6 | 1 | - |
| All Weather | 1 | - | - | - |
Michelin offers the broader catalogue by active tyre models (169 vs 127), which increases the odds of finding a Michelin that matches a specific niche or vehicle type, especially in summer (96 summer models vs 64) and all-season (48 vs 34). Continental counters with substantially wider size coverage overall (5,526 total sizes vs Michelin's 3,012), which matters if you drive a less common wheel size or need exact fitment availability. In the specialist corners, Michelin lists more all-terrain tyres (6 vs 4) and slightly more EV-marketed tyres (3 vs 2), while both brands show just 1 all-weather model in the range data.
Recommended picks per category
The top-rated current tyres from each brand, by season.
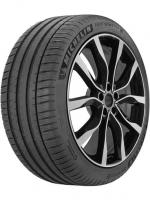
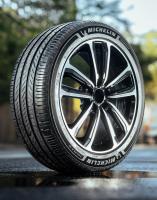
Summer
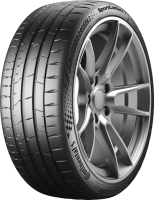
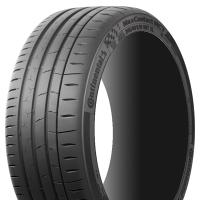
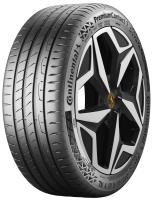
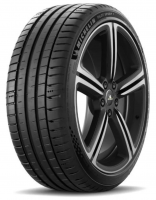
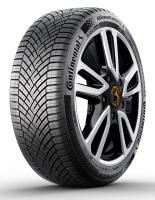
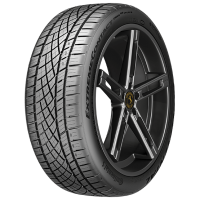
All Season

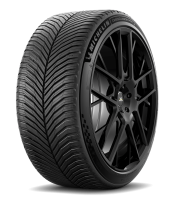
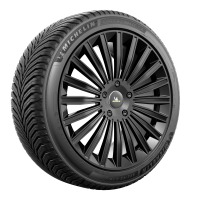
Winter
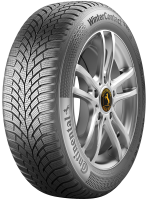
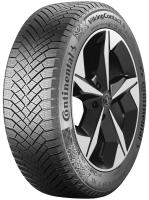
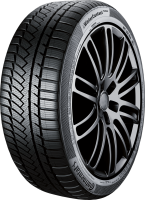
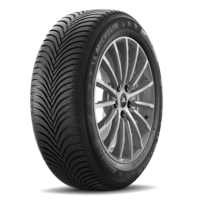
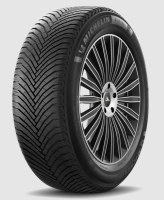
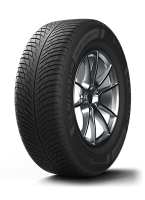
All Weather
 SecureContact AW
8.5 score
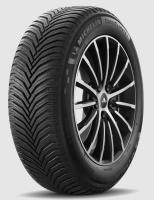 CrossClimate 2 AW
9.4 score
Popular Continental vs Michelin tyre matchups
Head-to-head comparisons between specific tyres from these brands.
 Continental AllSeasonContact 2 vs Michelin CrossClimate 2
 Continental PremiumContact 7 vs Michelin Primacy 5
 Continental SportContact 7 vs Michelin Pilot Sport 5
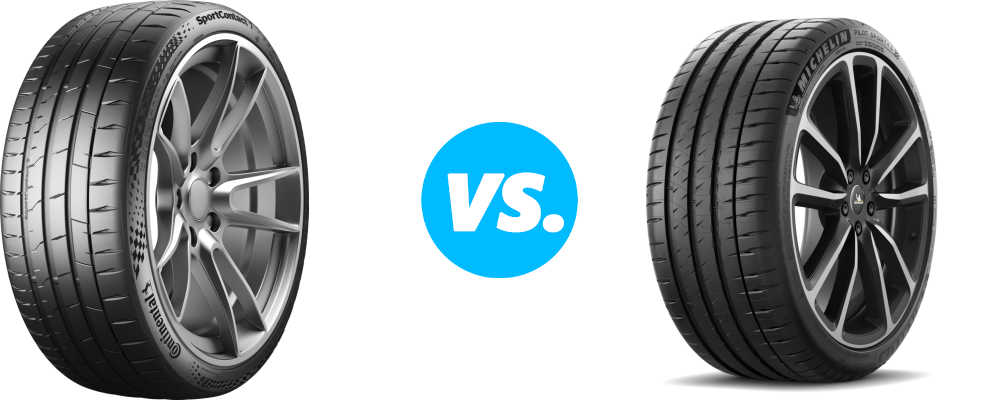 Continental SportContact 7 vs Michelin Pilot Sport 4 S
 Continental PremiumContact 7 vs Michelin Pilot Sport 5
 Continental VikingContact 8 vs Michelin X Ice Snow
Frequently asked questions
Is Continental better than Michelin?
Across 467 shared professional tests, Continental finished ahead of Michelin in 282 (16 drew), and holds a higher owner-review score of 7.5 vs 8.1 out of 10. Michelin leads on owner reviews and tread life.
Which is better in the wet, Continental or Michelin?
In Wet Braking, Continental averaged 38.18 m versus 38.83 m, winning 166 of 271 shared tests. In Wet Handling, Continental averaged 75.17 km/h versus 74.6 km/h, winning 71 of 114 shared tests.
Which lasts longer, Continental or Michelin?
In independent tyre wear testing across 57 shared tests, Michelin lasted longer, averaging 48,963 km versus 44,023 km (about 17% further) and winning 44 of them. Owner-rated tread life agrees, at 8 vs 6.6 out of 10.
Which is cheaper, Continental or Michelin?
Continental is usually the cheaper choice, coming in lower in 138 of 164 shared tests, on average about 7% less than Michelin.
Which is better in winter, Continental or Michelin?
Across 161 shared winter tests, Continental finished ahead in 107. 35% of its current range is 3PMSF winter-certified, versus 43% for Michelin. In Snow Braking, Michelin averaged 22.79 m versus 22.84 m, winning 77 of 134 shared tests.
Which brand is more fuel efficient, Continental or Michelin?
Fuel economy and EV range come down to rolling resistance. In Rolling Resistance, Continental averaged 7.72 kg/t versus 7.78 kg/t, winning 95 of 193 shared tests. 46% of Continental's current range earns an A or B EU fuel-efficiency grade, versus 38% for Michelin.
Which is better for electric cars, Continental or Michelin?
For an EV the priorities are low rolling resistance for range and low noise for a quiet cabin. In rolling-resistance testing, which directly drives EV range, Continental led 95 of 193 shared tests. Michelin also currently lists 3 EV-specific tyres versus 2 for Continental.
Which brand is quieter and more comfortable, Continental or Michelin?
Owners rate Michelin higher for comfort, at 8.1 vs 7.6 out of 10. In Noise, Michelin averaged 70.94 dB versus 71.22 dB, winning 101 of 178 shared tests.
Would owners buy Continental or Michelin again?
Michelin owners are more likely to buy the same brand again, scoring 7.7 vs 6.6 out of 10 on would-buy-again across 7,310 combined reviews.
Final verdict
If you prioritise outright performance in comparative group tests - especially summer and winter fitments and wet-road security measures - Continental has the stronger record, leading the shared-test head-to-head (273-163) and outperforming Michelin on average finish percentile (81.6 vs 72.8). If your priorities are longevity, comfort and a higher chance you will be happy after thousands of miles, Michelin stands out with longer wear-test life (49,351.52 km vs 44,615.8 km) and the higher owner score (8.05 vs 7.46), plus it leads the all-season head-to-head (33-27).
Overall lean: Continental leads in more test-outcome categories and is more often the cheaper premium buy, while Michelin leads the ownership-value categories that reduce replacement frequency and improve day-to-day satisfaction. Choose Continental if you want maximum odds of a top placing in independent tests for your season and strong wet performance at a typically lower price; choose Michelin if you want to optimise for tread life, comfort, and a stronger all-season and long-term ownership experience.