



Auto Bild tests are always amongst the best in the industry, and this year Auto Bild have taken things a step further. Not only did Auto Bild start with 25 all season tyres in the popular 195/55 R16 size and test them in dry and wet braking to get the best 15 for the full test below, they've also tested things Tyre Reviews was unable to test in the Tyre Reviews 2022 all season tyre test, including real world fuel use, the all important wear test, and new for this year, they tracked the abrasion of the tyres to see which tyre gives off the least particulates to the environment, which is separate from projected tyre life!
Test setup & methodology
The test setting, the conditions recorded and how the results contribute to the score.
Recorded test conditions
Recorded test conditions
- Dry Braking
- 100 → 0 km/h
- Snow Braking
- 50 → 0 km/h
Wear and Abrasion
Starting with wear and abrasion, there's a few surprises. Big surprises.
Firstly, the top three. Goodyear performing well isn't unusual, but Nexen and Toyo having the best projected mileage is very impressive. But more shocking is that the traditional kings of wear, Michelin, performed poorly, finishing third from last, and the Continental AllSeasonContact, which historically has done very well in wear tests, also performed badly.
Wear
Predicted tread life in KM
Higher is better ↑| Position / Tyre | Result | Gap to best |
|---|---|---|
| 71,951 KM | Best | |
| 62,356 KM | -9,595 KM | |
| 62,095 KM | -9,856 KM | |
| 59,199 KM | -12,752 KM | |
| 57,853 KM | -14,098 KM | |
| 57,117 KM | -14,834 KM | |
| 53,482 KM | -18,469 KM | |
| 51,779 KM | -20,172 KM | |
| 51,244 KM | -20,707 KM | |
| 48,420 KM | -23,531 KM | |
| 46,295 KM | -25,656 KM | |
| 46,219 KM | -25,732 KM | |
| 43,840 KM | -28,111 KM | |
| 40,997 KM | -30,954 KM | |
| 40,664 KM | -31,287 KM |
The difference between best and worst was 43.5% (31,287 KM).
Knowing the wear and price of the tyres allows us to calculate a value score, based on Euros per 1000km, and given Michelin and Continental are some of the most expensive tyres on test, this is an extremely poor result for both brands, and deranks them heavily in the final results.
Value
Euros/1000km based on cost/wear
Lower is better ↓| Position / Tyre | Result | Gap to best | cost per 1,000 km |
|---|---|---|---|
| 4.31 Price/1000 | Best | €12.58 | |
| 5.53 Price/1000 | +1.22 Price/1000 | €9.03 | |
| 5.69 Price/1000 | +1.38 Price/1000 | €11.40 | |
| 6.93 Price/1000 | +2.62 Price/1000 | €16.33 | |
| 7.35 Price/1000 | +3.04 Price/1000 | €11.30 | |
| 7.73 Price/1000 | +3.42 Price/1000 | €15.56 | |
| 8.11 Price/1000 | +3.80 Price/1000 | €13.46 | |
| 8.41 Price/1000 | +4.10 Price/1000 | €11.91 | |
| 8.73 Price/1000 | +4.42 Price/1000 | €17.26 | |
| 8.75 Price/1000 | +4.44 Price/1000 | €13.04 | |
| 8.76 Price/1000 | +4.45 Price/1000 | €14.98 | |
| 8.88 Price/1000 | +4.57 Price/1000 | €12.87 | |
| 9.19 Price/1000 | +4.88 Price/1000 | €11.49 | |
| 12.07 Price/1000 | +7.76 Price/1000 | €13.78 | |
| 12.2 Price/1000 | +7.89 Price/1000 | €14.21 |
The difference between best and worst was 183.1% (7.89 Price/1000). Over 40,000 km the cheapest tyre to own (Toyo Celsius AS2) works out €330 cheaper than the most expensive (Maxxis Premitra All Season AP3).
How this is calculated
Assumes a typical car using 8 l/100km (with rolling resistance causing 20% of fuel use), fuel at €1.65 per litre and €70 fitting per set of four. Purchase prices are from the time of the 2022 test; financing costs are excluded.
The results of this wear test certainly doesn't align with previous tests. If true, it's a big shake up we've not seen before, but there's always a chance it might be specific to this size, or it might be an issue with how the wear tests was measured.
New for 2022 is the abrasion tests, which is measured by weighing the tyre before and after the wear test and seeing how much weight was lost. This doesn't track with wear because some tyres have more void ratio in the tread pattern, and some tyres have narrower profiles overall, both meaning less material in the tyre.
In this test, the Michelin did lose the least amount of weight, which is the best result for the environment. This also shows the Michelin compound is still performing well.
Abrasion
Weight of Tyre Wear Particles Lost (Gram/1000km)
Lower is better ↓| Position / Tyre | Result | Gap to best |
|---|---|---|
| 14.3 Gram/1000km | Best | |
| 14.3 Gram/1000km | Best | |
| 14.7 Gram/1000km | +0.40 Gram/1000km | |
| 15.3 Gram/1000km | +1.00 Gram/1000km | |
| 16.3 Gram/1000km | +2.00 Gram/1000km | |
| 16.6 Gram/1000km | +2.30 Gram/1000km | |
| 17.4 Gram/1000km | +3.10 Gram/1000km | |
| 18.4 Gram/1000km | +4.10 Gram/1000km | |
| 19.6 Gram/1000km | +5.30 Gram/1000km | |
| 21.4 Gram/1000km | +7.10 Gram/1000km | |
| 21.9 Gram/1000km | +7.60 Gram/1000km | |
| 22 Gram/1000km | +7.70 Gram/1000km | |
| 22.9 Gram/1000km | +8.60 Gram/1000km | |
| 23.4 Gram/1000km | +9.10 Gram/1000km | |
| 23.5 Gram/1000km | +9.20 Gram/1000km |
The difference between best and worst was 64.3% (9.2 Gram/1000km).
Surprising Real World Fuel Use Results
The other new interesting dataset in this test was the real world fuel use, which was measured during the wear test. When we compare this against the bench measured rolling resistance data, there's another surprising inversion with Michelin.
Rolling Resistance
Rolling resistance in kg t
Lower is better ↓| Position / Tyre | Result | Gap to best | Extra fuel / year |
|---|---|---|---|
| 7.13 kg/t | Best | £0 | |
| 7.24 kg/t | +0.11 kg/t | £7 | |
| 7.36 kg/t | +0.23 kg/t | £14 | |
| 7.72 kg/t | +0.59 kg/t | £36 | |
| 7.77 kg/t | +0.64 kg/t | £40 | |
| 7.84 kg/t | +0.71 kg/t | £44 | |
| 7.87 kg/t | +0.74 kg/t | £46 | |
| 7.88 kg/t | +0.75 kg/t | £46 | |
| 8.21 kg/t | +1.08 kg/t | £67 | |
| 8.34 kg/t | +1.21 kg/t | £75 | |
| 8.4 kg/t | +1.27 kg/t | £79 | |
RefReference Winter |
8.45 kg/t | +1.32 kg/t | £82 |
| 8.94 kg/t | +1.81 kg/t | £112 | |
RefReference Summer |
8.95 kg/t | +1.82 kg/t | £113 |
| 8.97 kg/t | +1.84 kg/t | £114 | |
| 9.1 kg/t | +1.97 kg/t | £122 | |
| 9.35 kg/t | +2.22 kg/t | £137 |
The difference between best and worst was 31.1% (2.22 kg / t). Over 19,000 km a year at £1.45/L, the Falken EUROALL SEASON AS210 uses about 95 L (£137) more fuel than the Continental AllSeasonContact.
Adjust the assumptions
Calculated estimates, not additional measurements. Use the controls to explore the assumptions.
Fuel Consumption
Fuel consumption in Litres per 100 km
Lower is better ↓| Position / Tyre | Result | Gap to best | Extra fuel / year |
|---|---|---|---|
| 5.32 l/100km | Best | £0 | |
| 5.48 l/100km | +0.16 l/100km | £44 | |
| 5.49 l/100km | +0.17 l/100km | £47 | |
| 5.5 l/100km | +0.18 l/100km | £50 | |
| 5.52 l/100km | +0.20 l/100km | £55 | |
| 5.56 l/100km | +0.24 l/100km | £66 | |
| 5.59 l/100km | +0.27 l/100km | £74 | |
| 5.61 l/100km | +0.29 l/100km | £80 | |
| 5.61 l/100km | +0.29 l/100km | £80 | |
| 5.63 l/100km | +0.31 l/100km | £85 | |
| 5.65 l/100km | +0.33 l/100km | £91 | |
| 5.67 l/100km | +0.35 l/100km | £96 | |
| 5.67 l/100km | +0.35 l/100km | £96 | |
| 5.67 l/100km | +0.35 l/100km | £96 | |
| 5.79 l/100km | +0.47 l/100km | £129 |
The difference between best and worst was 8.8% (0.47 l/100km). Over 19,000 km a year at £1.45/L, the Falken EUROALL SEASON AS210 uses about 89 L (£129) more fuel than the Continental AllSeasonContact.
Adjust the assumptions
Calculated estimates, not additional measurements. Use the controls to explore the assumptions.
This is harder to explain. Theories in the comments please!

Best Tyres
Now we know Michelin and Continental have been deranked due to low value scores, this leaves the top few positions open to a surprise result. Sadly, we don't get one.
The Goodyear Vector 4Seasons Gen-3 continues to be an outstanding all season tyre in nearly all conditions, the Vredestein Quatrac also does very well, and the Hankook Kinergy 4S2 rounds out the top three spots, all tyres which performed well in the 2022 Tyre Reviews All Season Tyre Test. It's always nice to get parity amongst tests.
Dry
Fortunately for Michelin the dry braking of the CrossClimate 2 is still class leading, with the Kleber Quadraxer 3 (a Michelin tier 2 brand) placing second.
Dry Braking
Dry braking in meters (100 - 0 km/h)
Lower is better ↓| Position / Tyre | Result | Gap to best | Residual speed |
|---|---|---|---|
RefReference Summer |
36.5 m | -3.40 m | 0 km/h |
| 39.9 m | Best | 0 km/h | |
| 40.3 m | +0.40 m | 13 km/h | |
| 41.4 m | +1.50 m | 25 km/h | |
| 41.7 m | +1.80 m | 27 km/h | |
| 42.1 m | +2.20 m | 30 km/h | |
| 43.1 m | +3.20 m | 35 km/h | |
| 43.5 m | +3.60 m | 37 km/h | |
| 43.7 m | +3.80 m | 38 km/h | |
| 43.9 m | +4.00 m | 39 km/h | |
| 44.4 m | +4.50 m | 41 km/h | |
| 44.4 m | +4.50 m | 41 km/h | |
| 44.6 m | +4.70 m | 42 km/h | |
| 45.8 m | +5.90 m | 47 km/h | |
| 45.9 m | +6.00 m | 47 km/h | |
| 46.3 m | +6.40 m | 48 km/h | |
RefReference Winter |
46.4 m | +6.50 m | 49 km/h |
The difference between best and worst was 27.1% (9.9 m ≈ 2.2 Car Lengths). From 130 km/h, the Nokian SeasonProof would still be travelling at 48 km/h when the Michelin CrossClimate 2 had stopped.
Residual speed is calculated from the measured braking distances, assuming constant deceleration; it is not a separate measurement.
The Dunlop Sport All Season was the best around the dry handling lap, with the Goodyear and Hankook close behind.
Dry Handling
Dry Handling Average Speed
Higher is better ↑| Position / Tyre | Result | Gap to best |
|---|---|---|
RefReference Summer |
94.5 km/h | +0.80 km/h |
| 93.7 km/h | Best | |
| 93.6 km/h | -0.10 km/h | |
| 93.3 km/h | -0.40 km/h | |
| 93.3 km/h | -0.40 km/h | |
| 93.1 km/h | -0.60 km/h | |
| 93.1 km/h | -0.60 km/h | |
| 92.3 km/h | -1.40 km/h | |
| 92.3 km/h | -1.40 km/h | |
| 92.1 km/h | -1.60 km/h | |
| 91.9 km/h | -1.80 km/h | |
| 91.8 km/h | -1.90 km/h | |
| 91.8 km/h | -1.90 km/h | |
| 91.7 km/h | -2.00 km/h | |
| 91.5 km/h | -2.20 km/h | |
| 91.2 km/h | -2.50 km/h | |
RefReference Winter |
90.2 km/h | -3.50 km/h |
The difference between best and worst was 4.6% (4.3 Km/H).
In both dry tests the summer tyre was significantly better than any of the all season tyres, and the winter tyre was narrowly last place.
Wet
Bridgestone took the lead in wet braking with the WeatherControl A005 EVO being the only all season tyre able to get close to the summer tyre in braking performance.
Wet Braking
Wet braking in meters
Lower is better ↓| Position / Tyre | Result | Gap to best |
|---|---|---|
RefReference Summer |
43.3 m | -1.10 m |
| 44.4 m | Best | |
| 46.6 m | +2.20 m | |
| 46.8 m | +2.40 m | |
| 47.1 m | +2.70 m | |
| 48 m | +3.60 m | |
RefReference Winter |
48.8 m | +4.40 m |
| 48.9 m | +4.50 m | |
| 48.9 m | +4.50 m | |
| 49.2 m | +4.80 m | |
| 49.4 m | +5.00 m | |
| 51.6 m | +7.20 m | |
| 51.8 m | +7.40 m | |
| 51.9 m | +7.50 m | |
| 52.4 m | +8.00 m | |
| 53.2 m | +8.80 m | |
| 54.5 m | +10.10 m |
The difference between best and worst was 25.9% (11.2 m ≈ 2.5 Car Lengths).
Wet handling had the impressive Vredestein Quatrac be the fastest tyre around the lap, with the Goodyear and Dunlop once again performing well.
Wet Handling
Wet Handling Average Speed
Higher is better ↑| Position / Tyre | Result | Gap to best |
|---|---|---|
RefReference Summer |
77.5 km/h | +3.00 km/h |
| 74.5 km/h | Best | |
| 74.1 km/h | -0.40 km/h | |
| 73.3 km/h | -1.20 km/h | |
| 72.7 km/h | -1.80 km/h | |
| 72.6 km/h | -1.90 km/h | |
| 72.5 km/h | -2.00 km/h | |
RefReference Winter |
72.5 km/h | -2.00 km/h |
| 72.2 km/h | -2.30 km/h | |
| 72.1 km/h | -2.40 km/h | |
| 72 km/h | -2.50 km/h | |
| 71.8 km/h | -2.70 km/h | |
| 71.5 km/h | -3.00 km/h | |
| 71.4 km/h | -3.10 km/h | |
| 71.3 km/h | -3.20 km/h | |
| 70.9 km/h | -3.60 km/h | |
| 70.9 km/h | -3.60 km/h |
The difference between best and worst was 8.5% (6.6 Km/H).
Goodyear had the best straight aquaplaning performance with the Vector 4Seasons Gen-3.
Straight Aqua
Float Speed in Km/H
Higher is better ↑| Position / Tyre | Result | Gap to best |
|---|---|---|
| 84.9 km/h | Best | |
| 83.6 km/h | -1.30 km/h | |
| 82.8 km/h | -2.10 km/h | |
| 82.3 km/h | -2.60 km/h | |
| 82.1 km/h | -2.80 km/h | |
RefReference Summer |
81.5 km/h | -3.40 km/h |
| 81.4 km/h | -3.50 km/h | |
| 80.5 km/h | -4.40 km/h | |
| 80.3 km/h | -4.60 km/h | |
| 80.3 km/h | -4.60 km/h | |
| 79.7 km/h | -5.20 km/h | |
| 79.1 km/h | -5.80 km/h | |
| 78.9 km/h | -6.00 km/h | |
| 78.4 km/h | -6.50 km/h | |
| 78.2 km/h | -6.70 km/h | |
RefReference Winter |
78.1 km/h | -6.80 km/h |
| 77 km/h | -7.90 km/h |
The difference between best and worst was 9.3% (7.9 Km/H).
Snow
Snow braking was led by the winter tyre, but the margin was small with the best all season tyre, the Nokian SeasonProof less than a meter behind.
Snow Braking
Snow braking in meters (50 - 0 km/h)
Lower is better ↓| Position / Tyre | Result | Gap to best | Residual speed |
|---|---|---|---|
RefReference Winter |
26.5 m | -0.70 m | 0 km/h |
| 27.2 m | Best | 0 km/h | |
| 27.3 m | +0.10 m | 8 km/h | |
| 27.4 m | +0.20 m | 11 km/h | |
| 27.4 m | +0.20 m | 11 km/h | |
| 27.6 m | +0.40 m | 16 km/h | |
| 27.7 m | +0.50 m | 17 km/h | |
| 27.7 m | +0.50 m | 17 km/h | |
| 28.3 m | +1.10 m | 26 km/h | |
| 28.4 m | +1.20 m | 27 km/h | |
| 28.9 m | +1.70 m | 32 km/h | |
| 29 m | +1.80 m | 32 km/h | |
| 29.1 m | +1.90 m | 33 km/h | |
| 29.8 m | +2.60 m | 38 km/h | |
| 31.8 m | +4.60 m | 49 km/h | |
| 32 m | +4.80 m | 50 km/h | |
RefReference Summer |
58.9 m | +31.70 m | 95 km/h |
The difference between best and worst was 122.3% (32.4 m ≈ 7.2 Car Lengths). From 130 km/h, the Bridgestone Weather Control A005 EVO would still be travelling at 50 km/h when the Nokian SeasonProof had stopped.
Residual speed is calculated from the measured braking distances, assuming constant deceleration; it is not a separate measurement.
The CrossClimate 2 was the only all season tyre able to offer better snow traction than the dedicated winter tyre!
Snow Traction
Pulling Force in Newtons
Higher is better ↑| Position / Tyre | Result | Gap to best |
|---|---|---|
| 2574 N | Best | |
RefReference Winter |
2521 N | -53.00 N |
| 2508 N | -66.00 N | |
| 2502 N | -72.00 N | |
| 2490 N | -84.00 N | |
| 2487 N | -87.00 N | |
| 2430 N | -144.00 N | |
| 2422 N | -152.00 N | |
| 2400 N | -174.00 N | |
| 2365 N | -209.00 N | |
| 2269 N | -305.00 N | |
| 2256 N | -318.00 N | |
| 2246 N | -328.00 N | |
| 2242 N | -332.00 N | |
| 2081 N | -493.00 N | |
| 2068 N | -506.00 N | |
RefReference Summer |
835 N | -1,739.00 N |
The difference between best and worst was 67.6% (1,739 N).
The winter tyre had an advantage during snow handling, with the Nokian and Hankook Kinergy 4S2 proving to be the best of the all season tyres.
Snow Handling
Snow handling average speed
Higher is better ↑| Position / Tyre | Result | Gap to best |
|---|---|---|
RefReference Winter |
59.9 km/h | +1.90 km/h |
| 58 km/h | Best | |
| 57.4 km/h | -0.60 km/h | |
| 57.3 km/h | -0.70 km/h | |
| 57.3 km/h | -0.70 km/h | |
| 57 km/h | -1.00 km/h | |
| 56.8 km/h | -1.20 km/h | |
| 56.1 km/h | -1.90 km/h | |
| 55.9 km/h | -2.10 km/h | |
| 55.9 km/h | -2.10 km/h | |
| 55.5 km/h | -2.50 km/h | |
| 55.5 km/h | -2.50 km/h | |
| 55 km/h | -3.00 km/h | |
| 54.7 km/h | -3.30 km/h | |
| 54.2 km/h | -3.80 km/h | |
| 53 km/h | -5.00 km/h |
The difference between best and worst was 11.5% (6.9 Km/H).
Environment
The Nokian had the lowest external noise, but the whole group was spread by just 1.9dB.
Noise
External noise in dB
Lower is better ↓| Position / Tyre | Result | Gap to best |
|---|---|---|
| 71.5 dB | Best | |
| 71.6 dB | +0.10 dB | |
| 71.6 dB | +0.10 dB | |
| 72 dB | +0.50 dB | |
| 72.1 dB | +0.60 dB | |
| 72.2 dB | +0.70 dB | |
RefReference Winter |
72.2 dB | +0.70 dB |
| 72.4 dB | +0.90 dB | |
| 72.5 dB | +1.00 dB | |
| 72.6 dB | +1.10 dB | |
| 72.6 dB | +1.10 dB | |
| 72.6 dB | +1.10 dB | |
| 72.7 dB | +1.20 dB | |
| 72.7 dB | +1.20 dB | |
| 72.8 dB | +1.30 dB | |
RefReference Summer |
72.8 dB | +1.30 dB |
| 72.9 dB | +1.40 dB |
All the tyres in the Noise test finished less than 3% apart.
The excellent wearing Nexen N Blue 4Season was not only the best wearing tyre on test, but also the cheapest, with the Continental and Michelin the most expensive.
Results
Goodyear Vector 4Seasons Gen 3
195/55 R16 91V XL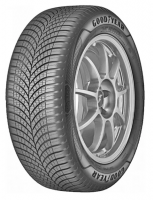
Category scores (% of best)
All discipline results (18)
Discipline positions compare the ranked tyres in this test, not the whole market. These are individual measurements, not weighted overall scores.
| Test | Position in discipline | Result | Gap to best |
|---|---|---|---|
| Dry BrakingLower is better | 9th / 15 | 43.9 m | +4.00 m |
| Dry HandlingHigher is better | 2nd / 15 | 93.6 km/h | -0.10 km/h |
| Wet BrakingLower is better | 3rd / 15 | 46.8 m | +2.40 m |
| Wet HandlingHigher is better | 2nd / 15 | 74.1 km/h | -0.40 km/h |
| Wet CircleLower is better | 6th / 15 | 12.17 s | +0.16 s |
| Straight AquaHigher is better | 1st / 15 | 84.9 km/h | Best in this discipline |
| Curved AquaplaningHigher is better | 1st / 15 | 3.83 m/sec2 | Best in this discipline |
| Snow BrakingLower is better | 3rd / 15 | 27.4 m | +0.20 m |
| Snow TractionHigher is better | 5th / 15 | 2487 N | -87.00 N |
| Snow HandlingHigher is better | 3rd / 15 | 57.3 km/h | -0.70 km/h |
| Snow SlalomHigher is better | 3rd / 15 | 4.41 m/sec2 | -0.19 m/sec2 |
| NoiseLower is better | 7th / 15 | 72.4 dB | +0.90 dB |
| Tyre WeightLower is better | 3rd / 15 | 7607 Kg | +89.00 Kg |
| WearHigher is better | 3rd / 15 | 62095 KM | -9,856.00 KM |
| ValueLower is better | 6th / 15 | 7.73 Price/1000 | +3.42 Price/1000 |
| Rolling ResistanceLower is better | 12th / 15 | 8.94 kg/t | +1.81 kg/t |
| Fuel ConsumptionLower is better | 12th / 15 | 5.67 l/100km | +0.35 l/100km |
| AbrasionLower is better | 6th / 15 | 16.6 Gram/1000km | +2.30 Gram/1000km |
- EU Label
- C/B/70
- Price
- 480.00
Vredestein Quatrac
195/55 R16 91V XL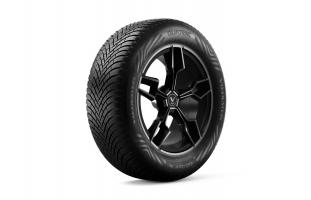
Category scores (% of best)
All discipline results (18)
Discipline positions compare the ranked tyres in this test, not the whole market. These are individual measurements, not weighted overall scores.
| Test | Position in discipline | Result | Gap to best |
|---|---|---|---|
| Dry BrakingLower is better | 4th / 15 | 41.7 m | +1.80 m |
| Dry HandlingHigher is better | 5th / 15 | 93.1 km/h | -0.60 km/h |
| Wet BrakingLower is better | 4th / 15 | 47.1 m | +2.70 m |
| Wet HandlingHigher is better | 1st / 15 | 74.5 km/h | Best in this discipline |
| Wet CircleLower is better | 2nd / 15 | 12.03 s | +0.02 s |
| Straight AquaHigher is better | 6th / 15 | 81.4 km/h | -3.50 km/h |
| Curved AquaplaningHigher is better | 10th / 15 | 3.18 m/sec2 | -0.65 m/sec2 |
| Snow BrakingLower is better | 8th / 15 | 28.3 m | +1.10 m |
| Snow TractionHigher is better | 8th / 15 | 2400 N | -174.00 N |
| Snow HandlingHigher is better | 8th / 15 | 55.9 km/h | -2.10 km/h |
| Snow SlalomHigher is better | 9th / 15 | 4.12 m/sec2 | -0.48 m/sec2 |
| NoiseLower is better | 5th / 15 | 72.1 dB | +0.60 dB |
| Tyre WeightLower is better | 7th / 15 | 7820 Kg | +302.00 Kg |
| WearHigher is better | 11th / 15 | 46295 KM | -25,656.00 KM |
| ValueLower is better | 10th / 15 | 8.75 Price/1000 | +4.44 Price/1000 |
| Rolling ResistanceLower is better | 8th / 15 | 7.88 kg/t | +0.75 kg/t |
| Fuel ConsumptionLower is better | 6th / 15 | 5.56 l/100km | +0.24 l/100km |
| AbrasionLower is better | 7th / 15 | 17.4 Gram/1000km | +3.10 Gram/1000km |
- EU Label
- C/B/70
- Price
- 405.00
Hankook Kinergy 4S2
195/55 R16 91H XL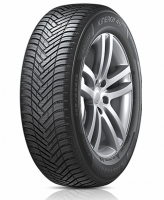
Category scores (% of best)
All discipline results (18)
Discipline positions compare the ranked tyres in this test, not the whole market. These are individual measurements, not weighted overall scores.
| Test | Position in discipline | Result | Gap to best |
|---|---|---|---|
| Dry BrakingLower is better | 5th / 15 | 42.1 m | +2.20 m |
| Dry HandlingHigher is better | 3rd / 15 | 93.3 km/h | -0.40 km/h |
| Wet BrakingLower is better | 5th / 15 | 48 m | +3.60 m |
| Wet HandlingHigher is better | 4th / 15 | 72.7 km/h | -1.80 km/h |
| Wet CircleLower is better | 9th / 15 | 12.23 s | +0.22 s |
| Straight AquaHigher is better | 12th / 15 | 78.9 km/h | -6.00 km/h |
| Curved AquaplaningHigher is better | 7th / 15 | 3.29 m/sec2 | -0.54 m/sec2 |
| Snow BrakingLower is better | 6th / 15 | 27.7 m | +0.50 m |
| Snow TractionHigher is better | 4th / 15 | 2490 N | -84.00 N |
| Snow HandlingHigher is better | 2nd / 15 | 57.4 km/h | -0.60 km/h |
| Snow SlalomHigher is better | 5th / 15 | 4.31 m/sec2 | -0.29 m/sec2 |
| NoiseLower is better | 2nd / 15 | 71.6 dB | +0.10 dB |
| Tyre WeightLower is better | 12th / 15 | 8149 Kg | +631.00 Kg |
| WearHigher is better | 12th / 15 | 46219 KM | -25,732.00 KM |
| ValueLower is better | 11th / 15 | 8.76 Price/1000 | +4.45 Price/1000 |
| Rolling ResistanceLower is better | 11th / 15 | 8.4 kg/t | +1.27 kg/t |
| Fuel ConsumptionLower is better | 11th / 15 | 5.65 l/100km | +0.33 l/100km |
| AbrasionLower is better | 14th / 15 | 23.4 Gram/1000km | +9.10 Gram/1000km |
- EU Label
- C/B/69
- Price
- 405.00
Kleber Quadraxer 3
195/55 R16 91V XL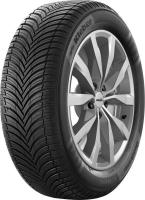
Category scores (% of best)
All discipline results (18)
Discipline positions compare the ranked tyres in this test, not the whole market. These are individual measurements, not weighted overall scores.
| Test | Position in discipline | Result | Gap to best |
|---|---|---|---|
| Dry BrakingLower is better | 2nd / 15 | 40.3 m | +0.40 m |
| Dry HandlingHigher is better | 7th / 15 | 92.3 km/h | -1.40 km/h |
| Wet BrakingLower is better | 9th / 15 | 49.4 m | +5.00 m |
| Wet HandlingHigher is better | 14th / 15 | 70.9 km/h | -3.60 km/h |
| Wet CircleLower is better | 9th / 15 | 12.23 s | +0.22 s |
| Straight AquaHigher is better | 2nd / 15 | 83.6 km/h | -1.30 km/h |
| Curved AquaplaningHigher is better | 3rd / 15 | 3.5 m/sec2 | -0.33 m/sec2 |
| Snow BrakingLower is better | 5th / 15 | 27.6 m | +0.40 m |
| Snow TractionHigher is better | 7th / 15 | 2422 N | -152.00 N |
| Snow HandlingHigher is better | 7th / 15 | 56.1 km/h | -1.90 km/h |
| Snow SlalomHigher is better | 7th / 15 | 4.24 m/sec2 | -0.36 m/sec2 |
| NoiseLower is better | 4th / 15 | 72 dB | +0.50 dB |
| Tyre WeightLower is better | 8th / 15 | 7936 Kg | +418.00 Kg |
| WearHigher is better | 9th / 15 | 51244 KM | -20,707.00 KM |
| ValueLower is better | 12th / 15 | 8.88 Price/1000 | +4.57 Price/1000 |
| Rolling ResistanceLower is better | 6th / 15 | 7.84 kg/t | +0.71 kg/t |
| Fuel ConsumptionLower is better | 12th / 15 | 5.67 l/100km | +0.35 l/100km |
| AbrasionLower is better | 4th / 15 | 15.3 Gram/1000km | +1.00 Gram/1000km |
- EU Label
- C/B/69
- Price
- 455.00
Kumho Solus 4S HA32+
195/55 R16 91V XL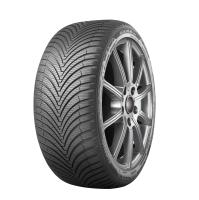
Category scores (% of best)
All discipline results (18)
Discipline positions compare the ranked tyres in this test, not the whole market. These are individual measurements, not weighted overall scores.
| Test | Position in discipline | Result | Gap to best |
|---|---|---|---|
| Dry BrakingLower is better | 10th / 15 | 44.4 m | +4.50 m |
| Dry HandlingHigher is better | 9th / 15 | 92.1 km/h | -1.60 km/h |
| Wet BrakingLower is better | 12th / 15 | 51.9 m | +7.50 m |
| Wet HandlingHigher is better | 9th / 15 | 72 km/h | -2.50 km/h |
| Wet CircleLower is better | 6th / 15 | 12.17 s | +0.16 s |
| Straight AquaHigher is better | 15th / 15 | 77 km/h | -7.90 km/h |
| Curved AquaplaningHigher is better | 15th / 15 | 2.81 m/sec2 | -1.02 m/sec2 |
| Snow BrakingLower is better | 3rd / 15 | 27.4 m | +0.20 m |
| Snow TractionHigher is better | 6th / 15 | 2430 N | -144.00 N |
| Snow HandlingHigher is better | 6th / 15 | 56.8 km/h | -1.20 km/h |
| Snow SlalomHigher is better | 8th / 15 | 4.16 m/sec2 | -0.44 m/sec2 |
| NoiseLower is better | 8th / 15 | 72.5 dB | +1.00 dB |
| Tyre WeightLower is better | 10th / 15 | 7972 Kg | +454.00 Kg |
| WearHigher is better | 6th / 15 | 57117 KM | -14,834.00 KM |
| ValueLower is better | 3rd / 15 | 5.69 Price/1000 | +1.38 Price/1000 |
| Rolling ResistanceLower is better | 10th / 15 | 8.34 kg/t | +1.21 kg/t |
| Fuel ConsumptionLower is better | 2nd / 15 | 5.48 l/100km | +0.16 l/100km |
| AbrasionLower is better | 9th / 15 | 19.6 Gram/1000km | +5.30 Gram/1000km |
- EU Label
- D/B/72
- Price
- 325.00
Nokian SeasonProof
195/55 R16 91V XL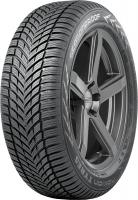
Category scores (% of best)
All discipline results (18)
Discipline positions compare the ranked tyres in this test, not the whole market. These are individual measurements, not weighted overall scores.
| Test | Position in discipline | Result | Gap to best |
|---|---|---|---|
| Dry BrakingLower is better | 15th / 15 | 46.3 m | +6.40 m |
| Dry HandlingHigher is better | 11th / 15 | 91.8 km/h | -1.90 km/h |
| Wet BrakingLower is better | 13th / 15 | 52.4 m | +8.00 m |
| Wet HandlingHigher is better | 8th / 15 | 72.1 km/h | -2.40 km/h |
| Wet CircleLower is better | 11th / 15 | 12.3 s | +0.29 s |
| Straight AquaHigher is better | 8th / 15 | 80.3 km/h | -4.60 km/h |
| Curved AquaplaningHigher is better | 8th / 15 | 3.23 m/sec2 | -0.60 m/sec2 |
| Snow BrakingLower is better | 1st / 15 | 27.2 m | Best in this discipline |
| Snow TractionHigher is better | 2nd / 15 | 2508 N | -66.00 N |
| Snow HandlingHigher is better | 1st / 15 | 58 km/h | Best in this discipline |
| Snow SlalomHigher is better | 4th / 15 | 4.33 m/sec2 | -0.27 m/sec2 |
| NoiseLower is better | 1st / 15 | 71.5 dB | Best in this discipline |
| Tyre WeightLower is better | 5th / 15 | 7668 Kg | +150.00 Kg |
| WearHigher is better | 7th / 15 | 53482 KM | -18,469.00 KM |
| ValueLower is better | 8th / 15 | 8.41 Price/1000 | +4.10 Price/1000 |
| Rolling ResistanceLower is better | 4th / 15 | 7.72 kg/t | +0.59 kg/t |
| Fuel ConsumptionLower is better | 8th / 15 | 5.61 l/100km | +0.29 l/100km |
| AbrasionLower is better | 11th / 15 | 21.9 Gram/1000km | +7.60 Gram/1000km |
- EU Label
- C/B/69
- Price
- 450.00
Dunlop Sport All Season
195/55 R16 91V XL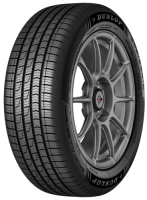
Category scores (% of best)
All discipline results (18)
Discipline positions compare the ranked tyres in this test, not the whole market. These are individual measurements, not weighted overall scores.
| Test | Position in discipline | Result | Gap to best |
|---|---|---|---|
| Dry BrakingLower is better | 12th / 15 | 44.6 m | +4.70 m |
| Dry HandlingHigher is better | 1st / 15 | 93.7 km/h | Best in this discipline |
| Wet BrakingLower is better | 2nd / 15 | 46.6 m | +2.20 m |
| Wet HandlingHigher is better | 3rd / 15 | 73.3 km/h | -1.20 km/h |
| Wet CircleLower is better | 5th / 15 | 12.08 s | +0.07 s |
| Straight AquaHigher is better | 14th / 15 | 78.2 km/h | -6.70 km/h |
| Curved AquaplaningHigher is better | 4th / 15 | 3.45 m/sec2 | -0.38 m/sec2 |
| Snow BrakingLower is better | 13th / 15 | 29.8 m | +2.60 m |
| Snow TractionHigher is better | 11th / 15 | 2256 N | -318.00 N |
| Snow HandlingHigher is better | 14th / 15 | 54.2 km/h | -3.80 km/h |
| Snow SlalomHigher is better | 14th / 15 | 3.83 m/sec2 | -0.77 m/sec2 |
| NoiseLower is better | 9th / 15 | 72.6 dB | +1.10 dB |
| Tyre WeightLower is better | 4th / 15 | 7642 Kg | +124.00 Kg |
| WearHigher is better | 8th / 15 | 51779 KM | -20,172.00 KM |
| ValueLower is better | 7th / 15 | 8.11 Price/1000 | +3.80 Price/1000 |
| Rolling ResistanceLower is better | 9th / 15 | 8.21 kg/t | +1.08 kg/t |
| Fuel ConsumptionLower is better | 10th / 15 | 5.63 l/100km | +0.31 l/100km |
| AbrasionLower is better | 3rd / 15 | 14.7 Gram/1000km | +0.40 Gram/1000km |
- EU Label
- C/B/71
- Price
- 420.00
Falken EUROALL SEASON AS210
195/55 R16 91V XL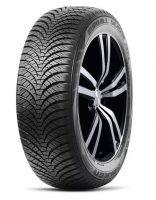
Category scores (% of best)
All discipline results (18)
Discipline positions compare the ranked tyres in this test, not the whole market. These are individual measurements, not weighted overall scores.
| Test | Position in discipline | Result | Gap to best |
|---|---|---|---|
| Dry BrakingLower is better | 10th / 15 | 44.4 m | +4.50 m |
| Dry HandlingHigher is better | 7th / 15 | 92.3 km/h | -1.40 km/h |
| Wet BrakingLower is better | 10th / 15 | 51.6 m | +7.20 m |
| Wet HandlingHigher is better | 12th / 15 | 71.4 km/h | -3.10 km/h |
| Wet CircleLower is better | 12th / 15 | 12.31 s | +0.30 s |
| Straight AquaHigher is better | 3rd / 15 | 82.8 km/h | -2.10 km/h |
| Curved AquaplaningHigher is better | 8th / 15 | 3.23 m/sec2 | -0.60 m/sec2 |
| Snow BrakingLower is better | 12th / 15 | 29.1 m | +1.90 m |
| Snow TractionHigher is better | 13th / 15 | 2242 N | -332.00 N |
| Snow HandlingHigher is better | 12th / 15 | 55 km/h | -3.00 km/h |
| Snow SlalomHigher is better | 11th / 15 | 3.98 m/sec2 | -0.62 m/sec2 |
| NoiseLower is better | 9th / 15 | 72.6 dB | +1.10 dB |
| Tyre WeightLower is better | 15th / 15 | 8935 Kg | +1,417.00 Kg |
| WearHigher is better | 4th / 15 | 59199 KM | -12,752.00 KM |
| ValueLower is better | 4th / 15 | 6.93 Price/1000 | +2.62 Price/1000 |
| Rolling ResistanceLower is better | 15th / 15 | 9.35 kg/t | +2.22 kg/t |
| Fuel ConsumptionLower is better | 15th / 15 | 5.79 l/100km | +0.47 l/100km |
| AbrasionLower is better | 5th / 15 | 16.3 Gram/1000km | +2.00 Gram/1000km |
- EU Label
- D/B/70
- Price
- 410.00
Michelin CrossClimate 2
195/55 R16 91V XL
Category scores (% of best)
All discipline results (18)
Discipline positions compare the ranked tyres in this test, not the whole market. These are individual measurements, not weighted overall scores.
| Test | Position in discipline | Result | Gap to best |
|---|---|---|---|
| Dry BrakingLower is better | 1st / 15 | 39.9 m | Best in this discipline |
| Dry HandlingHigher is better | 3rd / 15 | 93.3 km/h | -0.40 km/h |
| Wet BrakingLower is better | 8th / 15 | 49.2 m | +4.80 m |
| Wet HandlingHigher is better | 10th / 15 | 71.8 km/h | -2.70 km/h |
| Wet CircleLower is better | 13th / 15 | 12.39 s | +0.38 s |
| Straight AquaHigher is better | 7th / 15 | 80.5 km/h | -4.40 km/h |
| Curved AquaplaningHigher is better | 12th / 15 | 3.01 m/sec2 | -0.82 m/sec2 |
| Snow BrakingLower is better | 2nd / 15 | 27.3 m | +0.10 m |
| Snow TractionHigher is better | 1st / 15 | 2574 N | Best in this discipline |
| Snow HandlingHigher is better | 5th / 15 | 57 km/h | -1.00 km/h |
| Snow SlalomHigher is better | 1st / 15 | 4.6 m/sec2 | Best in this discipline |
| NoiseLower is better | 2nd / 15 | 71.6 dB | +0.10 dB |
| Tyre WeightLower is better | 9th / 15 | 7942 Kg | +424.00 Kg |
| WearHigher is better | 13th / 15 | 43840 KM | -28,111.00 KM |
| ValueLower is better | 15th / 15 | 12.2 Price/1000 | +7.89 Price/1000 |
| Rolling ResistanceLower is better | 2nd / 15 | 7.24 kg/t | +0.11 kg/t |
| Fuel ConsumptionLower is better | 12th / 15 | 5.67 l/100km | +0.35 l/100km |
| AbrasionLower is better | 1st / 15 | 14.3 Gram/1000km | Best in this discipline |
- EU Label
- C/B/69
- Price
- 535.00
Nexen N Blue 4 Season
195/55 R16 91H XL
Category scores (% of best)
All discipline results (18)
Discipline positions compare the ranked tyres in this test, not the whole market. These are individual measurements, not weighted overall scores.
| Test | Position in discipline | Result | Gap to best |
|---|---|---|---|
| Dry BrakingLower is better | 8th / 15 | 43.7 m | +3.80 m |
| Dry HandlingHigher is better | 15th / 15 | 91.2 km/h | -2.50 km/h |
| Wet BrakingLower is better | 15th / 15 | 54.5 m | +10.10 m |
| Wet HandlingHigher is better | 11th / 15 | 71.5 km/h | -3.00 km/h |
| Wet CircleLower is better | 14th / 15 | 12.42 s | +0.41 s |
| Straight AquaHigher is better | 10th / 15 | 79.7 km/h | -5.20 km/h |
| Curved AquaplaningHigher is better | 13th / 15 | 2.96 m/sec2 | -0.87 m/sec2 |
| Snow BrakingLower is better | 9th / 15 | 28.4 m | +1.20 m |
| Snow TractionHigher is better | 9th / 15 | 2365 N | -209.00 N |
| Snow HandlingHigher is better | 8th / 15 | 55.9 km/h | -2.10 km/h |
| Snow SlalomHigher is better | 6th / 15 | 4.26 m/sec2 | -0.34 m/sec2 |
| NoiseLower is better | 6th / 15 | 72.2 dB | +0.70 dB |
| Tyre WeightLower is better | 11th / 15 | 8017 Kg | +499.00 Kg |
| WearHigher is better | 1st / 15 | 71951 KM | Best in this discipline |
| ValueLower is better | 1st / 15 | 4.31 Price/1000 | Best in this discipline |
| Rolling ResistanceLower is better | 14th / 15 | 9.1 kg/t | +1.97 kg/t |
| Fuel ConsumptionLower is better | 8th / 15 | 5.61 l/100km | +0.29 l/100km |
| AbrasionLower is better | 1st / 15 | 14.3 Gram/1000km | Best in this discipline |
- EU Label
- D/C/70
- Price
- 310.00
Firestone MultiSeason Gen 02
195/55 R16 91V XL
Category scores (% of best)
All discipline results (18)
Discipline positions compare the ranked tyres in this test, not the whole market. These are individual measurements, not weighted overall scores.
| Test | Position in discipline | Result | Gap to best |
|---|---|---|---|
| Dry BrakingLower is better | 14th / 15 | 45.9 m | +6.00 m |
| Dry HandlingHigher is better | 10th / 15 | 91.9 km/h | -1.80 km/h |
| Wet BrakingLower is better | 6th / 15 | 48.9 m | +4.50 m |
| Wet HandlingHigher is better | 7th / 15 | 72.2 km/h | -2.30 km/h |
| Wet CircleLower is better | 6th / 15 | 12.17 s | +0.16 s |
| Straight AquaHigher is better | 8th / 15 | 80.3 km/h | -4.60 km/h |
| Curved AquaplaningHigher is better | 14th / 15 | 2.82 m/sec2 | -1.01 m/sec2 |
| Snow BrakingLower is better | 10th / 15 | 28.9 m | +1.70 m |
| Snow TractionHigher is better | 10th / 15 | 2269 N | -305.00 N |
| Snow HandlingHigher is better | 10th / 15 | 55.5 km/h | -2.50 km/h |
| Snow SlalomHigher is better | 12th / 15 | 3.92 m/sec2 | -0.68 m/sec2 |
| NoiseLower is better | 12th / 15 | 72.7 dB | +1.20 dB |
| Tyre WeightLower is better | 6th / 15 | 7669 Kg | +151.00 Kg |
| WearHigher is better | 5th / 15 | 57853 KM | -14,098.00 KM |
| ValueLower is better | 5th / 15 | 7.35 Price/1000 | +3.04 Price/1000 |
| Rolling ResistanceLower is better | 7th / 15 | 7.87 kg/t | +0.74 kg/t |
| Fuel ConsumptionLower is better | 5th / 15 | 5.52 l/100km | +0.20 l/100km |
| AbrasionLower is better | 15th / 15 | 23.5 Gram/1000km | +9.20 Gram/1000km |
- EU Label
- C/B/71
- Price
- 425.00
Toyo Celsius AS2
195/55 R16 91V XL
Category scores (% of best)
All discipline results (18)
Discipline positions compare the ranked tyres in this test, not the whole market. These are individual measurements, not weighted overall scores.
| Test | Position in discipline | Result | Gap to best |
|---|---|---|---|
| Dry BrakingLower is better | 7th / 15 | 43.5 m | +3.60 m |
| Dry HandlingHigher is better | 11th / 15 | 91.8 km/h | -1.90 km/h |
| Wet BrakingLower is better | 14th / 15 | 53.2 m | +8.80 m |
| Wet HandlingHigher is better | 14th / 15 | 70.9 km/h | -3.60 km/h |
| Wet CircleLower is better | 15th / 15 | 12.6 s | +0.59 s |
| Straight AquaHigher is better | 4th / 15 | 82.3 km/h | -2.60 km/h |
| Curved AquaplaningHigher is better | 2nd / 15 | 3.7 m/sec2 | -0.13 m/sec2 |
| Snow BrakingLower is better | 11th / 15 | 29 m | +1.80 m |
| Snow TractionHigher is better | 12th / 15 | 2246 N | -328.00 N |
| Snow HandlingHigher is better | 10th / 15 | 55.5 km/h | -2.50 km/h |
| Snow SlalomHigher is better | 9th / 15 | 4.12 m/sec2 | -0.48 m/sec2 |
| NoiseLower is better | 9th / 15 | 72.6 dB | +1.10 dB |
| Tyre WeightLower is better | 14th / 15 | 8373 Kg | +855.00 Kg |
| WearHigher is better | 2nd / 15 | 62356 KM | -9,595.00 KM |
| ValueLower is better | 2nd / 15 | 5.53 Price/1000 | +1.22 Price/1000 |
| Rolling ResistanceLower is better | 5th / 15 | 7.77 kg/t | +0.64 kg/t |
| Fuel ConsumptionLower is better | 7th / 15 | 5.59 l/100km | +0.27 l/100km |
| AbrasionLower is better | 8th / 15 | 18.4 Gram/1000km | +4.10 Gram/1000km |
- EU Label
- D/B/71
- Price
- 345.00
Continental AllSeasonContact
195/55 R16 91V XL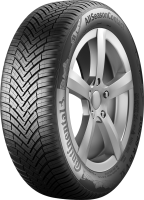
Category scores (% of best)
All discipline results (18)
Discipline positions compare the ranked tyres in this test, not the whole market. These are individual measurements, not weighted overall scores.
| Test | Position in discipline | Result | Gap to best |
|---|---|---|---|
| Dry BrakingLower is better | 13th / 15 | 45.8 m | +5.90 m |
| Dry HandlingHigher is better | 14th / 15 | 91.5 km/h | -2.20 km/h |
| Wet BrakingLower is better | 6th / 15 | 48.9 m | +4.50 m |
| Wet HandlingHigher is better | 5th / 15 | 72.6 km/h | -1.90 km/h |
| Wet CircleLower is better | 2nd / 15 | 12.03 s | +0.02 s |
| Straight AquaHigher is better | 13th / 15 | 78.4 km/h | -6.50 km/h |
| Curved AquaplaningHigher is better | 11th / 15 | 3.08 m/sec2 | -0.75 m/sec2 |
| Snow BrakingLower is better | 6th / 15 | 27.7 m | +0.50 m |
| Snow TractionHigher is better | 3rd / 15 | 2502 N | -72.00 N |
| Snow HandlingHigher is better | 3rd / 15 | 57.3 km/h | -0.70 km/h |
| Snow SlalomHigher is better | 2nd / 15 | 4.5 m/sec2 | -0.10 m/sec2 |
| NoiseLower is better | 12th / 15 | 72.7 dB | +1.20 dB |
| Tyre WeightLower is better | 1st / 15 | 7518 Kg | Best in this discipline |
| WearHigher is better | 14th / 15 | 40997 KM | -30,954.00 KM |
| ValueLower is better | 14th / 15 | 12.07 Price/1000 | +7.76 Price/1000 |
| Rolling ResistanceLower is better | 1st / 15 | 7.13 kg/t | Best in this discipline |
| Fuel ConsumptionLower is better | 1st / 15 | 5.32 l/100km | Best in this discipline |
| AbrasionLower is better | 10th / 15 | 21.4 Gram/1000km | +7.10 Gram/1000km |
- EU Label
- B/B/72
- Price
- 495.00
Maxxis Premitra All Season AP3
195/55 R16 91V XL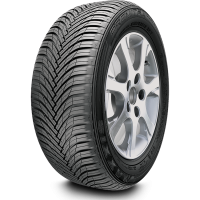
Category scores (% of best)
All discipline results (18)
Discipline positions compare the ranked tyres in this test, not the whole market. These are individual measurements, not weighted overall scores.
| Test | Position in discipline | Result | Gap to best |
|---|---|---|---|
| Dry BrakingLower is better | 6th / 15 | 43.1 m | +3.20 m |
| Dry HandlingHigher is better | 13th / 15 | 91.7 km/h | -2.00 km/h |
| Wet BrakingLower is better | 11th / 15 | 51.8 m | +7.40 m |
| Wet HandlingHigher is better | 13th / 15 | 71.3 km/h | -3.20 km/h |
| Wet CircleLower is better | 4th / 15 | 12.05 s | +0.04 s |
| Straight AquaHigher is better | 5th / 15 | 82.1 km/h | -2.80 km/h |
| Curved AquaplaningHigher is better | 5th / 15 | 3.4 m/sec2 | -0.43 m/sec2 |
| Snow BrakingLower is better | 14th / 15 | 31.8 m | +4.60 m |
| Snow TractionHigher is better | 14th / 15 | 2081 N | -493.00 N |
| Snow HandlingHigher is better | 13th / 15 | 54.7 km/h | -3.30 km/h |
| Snow SlalomHigher is better | 13th / 15 | 3.91 m/sec2 | -0.69 m/sec2 |
| NoiseLower is better | 15th / 15 | 72.9 dB | +1.40 dB |
| Tyre WeightLower is better | 13th / 15 | 8317 Kg | +799.00 Kg |
| WearHigher is better | 15th / 15 | 40664 KM | -31,287.00 KM |
| ValueLower is better | 9th / 15 | 8.73 Price/1000 | +4.42 Price/1000 |
| Rolling ResistanceLower is better | 13th / 15 | 8.97 kg/t | +1.84 kg/t |
| Fuel ConsumptionLower is better | 4th / 15 | 5.5 l/100km | +0.18 l/100km |
| AbrasionLower is better | 13th / 15 | 22.9 Gram/1000km | +8.60 Gram/1000km |
- EU Label
- C/B/70
- Price
- 355.00
Bridgestone Weather Control A005 EVO
195/55 R16 91V XL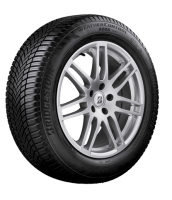
Category scores (% of best)
All discipline results (18)
Discipline positions compare the ranked tyres in this test, not the whole market. These are individual measurements, not weighted overall scores.
| Test | Position in discipline | Result | Gap to best |
|---|---|---|---|
| Dry BrakingLower is better | 3rd / 15 | 41.4 m | +1.50 m |
| Dry HandlingHigher is better | 5th / 15 | 93.1 km/h | -0.60 km/h |
| Wet BrakingLower is better | 1st / 15 | 44.4 m | Best in this discipline |
| Wet HandlingHigher is better | 6th / 15 | 72.5 km/h | -2.00 km/h |
| Wet CircleLower is better | 1st / 15 | 12.01 s | Best in this discipline |
| Straight AquaHigher is better | 11th / 15 | 79.1 km/h | -5.80 km/h |
| Curved AquaplaningHigher is better | 6th / 15 | 3.31 m/sec2 | -0.52 m/sec2 |
| Snow BrakingLower is better | 15th / 15 | 32 m | +4.80 m |
| Snow TractionHigher is better | 15th / 15 | 2068 N | -506.00 N |
| Snow HandlingHigher is better | 15th / 15 | 53 km/h | -5.00 km/h |
| Snow SlalomHigher is better | 15th / 15 | 3.64 m/sec2 | -0.96 m/sec2 |
| NoiseLower is better | 14th / 15 | 72.8 dB | +1.30 dB |
| Tyre WeightLower is better | 2nd / 15 | 7563 Kg | +45.00 Kg |
| WearHigher is better | 10th / 15 | 48420 KM | -23,531.00 KM |
| ValueLower is better | 13th / 15 | 9.19 Price/1000 | +4.88 Price/1000 |
| Rolling ResistanceLower is better | 3rd / 15 | 7.36 kg/t | +0.23 kg/t |
| Fuel ConsumptionLower is better | 3rd / 15 | 5.49 l/100km | +0.17 l/100km |
| AbrasionLower is better | 12th / 15 | 22 Gram/1000km | +7.70 Gram/1000km |
- EU Label
- C/A/71
- Price
- 445.00
wat is more important, dry braking or wet braking? This depends on where you are living .
We, in stuttgart have only 31 rainy days a Year.
And the goodyear is winning the compare. I d'ont understand the conclusion.
Dry braking is usually much closer than wet and there are far more accidents in wet weather which is why most tests put a higher score weight on wet.
When they say projected wear 45.000 km, to what thread depth are they talking? 1.6 mm? Because if you are bellow 4 mm, you can't use that tyre any more during winter in Serbia. And since it is an all season tyre, yeah...
Yes it will be to 1.6mm
Thanks. Well, that is not good, for all season tyres at least...
It's a shame we don't know the temperature these tests were done in. I'm more interested in brake distance in cooler wet weather, than warmer wet.
My all season test last year had braking at 2 temps
Yes, time after time I go back to that one. I presume I've given about 50k in advertising revenue watching all the all season videos :)
I know this is a little of an odd question, probably impossibile to really answer but I'll ask anyway.
I'm looking at getting the Quadratic Pros to replace Nexen NFERA SU1. Would you, in your more expert opinion, think they are better in dry and wet for braking all year round than the Nexens (or at least on parr).
Wet, quite possibly, certainly in cooler conditions.
In the dry, no, summer tyres always have a good lead in dry braking.
All this detailed information has left me with analysis paralysis, so let's see what the comments say. I'm in the UK, will mostly be driving north of Edinburgh with a few jaunts down to the North every year. I don't particularly care about price - if a good set of tyres stop me from hitting someone or skidding into a ditch once, they've paid for themselves a dozen times over.
Thoughts? I've been fiddling around with the custom score weights, and I've cut the list down to: Bridgestone Weather Control A005 EVO, Goodyear Vector 4Seasons Gen 3, Michelin CrossClimate 2.
All of them good choices. I hope this helped :)
Honestly, it's tough. If you plan to use them year round and truly don't care about price I'd go with the Bridgestone, but the wear is high and the snow isn't as good as the other two. Of the other two, you gotta decide if you want dry braking or wet braking I guess. The Goodyear is probably the best all round when you factor in wear too.
Does Auto Bild say what temperature these tyres were tested at? Obviously can't be that high for the Snow tests, but wondering about the Dry and Wet tests.
I've basically accepted that every summer from now on we will be boiled alive in the UK :( so I'm super curious how these tyres fare when the heat is turned all the way up.
I didn't see it, sorry.
Interesting results with rolling resistance vs real world fuel economy.
Perhaps the differences could be explained by:
Tyre weight (there is a weak positive correlation)?
Drag from the tyre sidewalls? I read that Bridgestone purposly designed the sidewalls on the Driveguard runflats to increase drag which would generate more air turbulance to cool the tyre better.
Deflection in the tyre?
Definitely something that needs to be looked into further in future tests if real world fuel economy results are so different than rolling resistance.
All the manufacturers take into account sidewall effects on rolling resistance. It seems the fuel use was done during the wear convoy run which also didn't work out too well for Michelin.
Any thoughts on the differences?
Do you think the supposed real world data is more likely to be realistic?
My theory is: michelin talks abit about re-optimising the smaller gap thread pattern for cc2 compared to cc+, perhaps the rubber deformation during cornering is different to straightline to ensure grip characteristic improves in corner? Was RR done in straight line while fuel consumption test done with cornering ? 🤔
RR is done on a machine and yes the fuel consumption will contain cornering. In this case I believe it was a big circle.
I also struggle to see how the Goodyear which stops 25ft further than the summer tyre in dry braking can be described as exemplary!!!!
I must admit I find German tyre tests a combination of the sublime - the extent and depth of their testing regimes which are truly impressive - and the ridiculous - their conclusions which are frequently frankly bizarre.
For example the Kumho beats the Michelin in only wet handling by one place and wet circle by 7 places. In every other dry, wet, aqua and snow test it is behind the Michelin - often by a margin Yet it is 5th and the French tyre 9th. So this test result is totally dependent on cost, wear and fuel consumption.
To prove my point further let's look at the Falken which is described as good and the Michelin as only fair.
In the dry tests the Michelin beats the Falken comfortably in both braking 1st to 10th and handling 3rd to 7th.
In the wet tests the Michelin beats the Falken in both braking 8th to 10th and handling 10th to 12th. In wet circle the Falken comes out on top 12th to 13th.
In aqua the Falken comes out on top in both straight 3rd to 7th and curved 8th to 12th.
On snow the Michelin wins comfortably across all four categories. In braking 2nd 12th to traction 1st to 13th, handling 5th to 12th and slalom 1st to 11th.
So apart from acqua the Michelin is massivly superior. Yet the Falken is good and the Michelin only fair!!!!!
It's a shame their background scoring system isn't fixed or shown, the German School System scoring brackets move each test. But it's still an amazing test! ANd they do give us all the data unlike ADAC so we can work stuff out for ourselves!
Fascinating. I just put in a 40% dry, 40% wet and 20% snow ratio and nothing for price/wear and guess who came out top.
Michelin.
Clearly the Autobild test massively punishes Michelin and Continental for wear and price. Now these are important but ultimately I want the best tyre for braking, handling, traction etc. Given the cost of an accident both physical and monetary that trumps the cost of the tyre for me (others of course may have different priorities).