This is the most in depth tyre test Tyre Reviews has ever performed! This UHP summer tyre test will compare six of the very best ultra high performance tyres, and including a full wear test, some cooler temperature testing, and worn state testing!
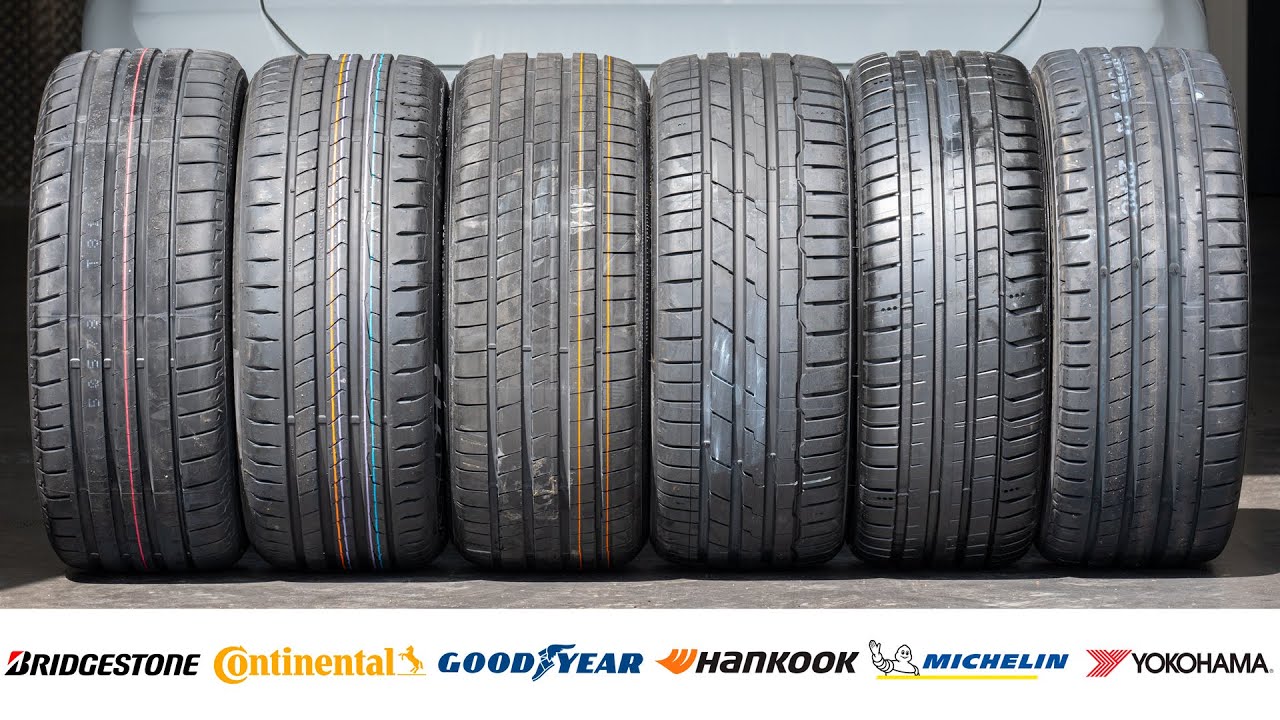
On test we have the latest and greatest 18" sports tyres from Bridgestone, Continental, Goodyear, Hankook, Michelin and Yokohama. As usual we'll be covering every aspect of the tyres performance, including the wet performance, dry grip, internal noise, comfort, rolling resistance and the all important wear!
Testing Methodology
Test Driver
Jonathan Benson
Tyre Size
225/40 R18
Test Location
Professional Proving Ground
Test Year
2023
Tyres Tested
6
Show full testing methodologyHide methodology
Every tyre is tested using calibrated instrumented measurement and structured subjective assessment. Reference tyres are retested throughout each session to correct for changing conditions, ensuring fair, repeatable comparisons. Multiple reference sets are used where needed so that control tyre wear does not affect accuracy.
We use professional-grade testing equipment including GPS data loggers, accelerometers, and calibrated microphones. All tyres are broken in and conditioned before testing begins. For full details on our equipment, preparation process, and calibration procedures, see our complete testing methodology.
Categories Tested
Dry Braking
For dry braking, I drive the test vehicle at an entry speed of 110 km/h and apply full braking effort to a standstill with ABS active on clean, dry asphalt. I typically use an 100–5 km/h measurement window. My standard programme is five runs per tyre set where possible, although the sequence can extend to as many as fifteen runs if conditions and tyre category justify it. I analyse the full set of runs and discard statistical outliers before averaging. Reference tyres are run repeatedly throughout the session to correct for changing conditions.
Dry Handling
For dry handling, I drive at the limit of adhesion around a dedicated handling circuit with ESC disabled where possible so I can assess the tyre's natural balance, transient response, and limit behaviour without electronic intervention masking the result. I usually complete between two and five timed laps per tyre set, depending on the circuit, tyre type, and consistency of conditions. I exclude laps affected by clear driver error or obvious environmental inconsistency. Control runs are carried out frequently throughout the session, and I often use multiple sets of control tyres so that wear on the references does not become a meaningful variable. For more track-focused products, I also do endurance testing, which is a set number of laps at race pace to determine tire wear patterns and heat resistance over longer driving.
Subj. Dry Handling
Objective data is only part of the picture, so I also carry out a structured subjective handling assessment at the limit of adhesion on a dedicated dry handling circuit. I score steering precision, steering response, turn-in behaviour, mid-corner balance, corner-exit traction, breakaway characteristics, and overall confidence using a standardised 1–10 scale used consistently across my testing. The final assessment combines numeric scoring with written technical commentary. I complete familiarisation laps on the control tyre before evaluating each candidate.
Subj. Fun
Some tyres deliver strong measured performance but still feel uninvolving, so I also include an assessment of driving enjoyment during spirited driving. This score considers steering feel, communication, balance, predictability at the limit, driver confidence, and the overall sense of connection between the vehicle and the road. It is intended to capture qualities that matter to enthusiastic drivers but are not always fully described by isolated objective metrics. Rated on a 1–10 scale.
Wet Braking
For wet braking, I drive the test vehicle at an entry speed of 88 km/h and apply full braking effort to a standstill with ABS active on an asphalt surface with a controlled water film. I typically use an 80–5 km/h measurement window to isolate tyre performance from variability in the initial brake application. My standard programme is eight runs per tyre set where possible, although the sequence can extend to as many as fifteen runs if conditions and tyre category justify it. I analyse the full set of runs and discard statistical outliers before averaging. To correct for changing conditions, I run reference tyres repeatedly throughout the session — in wet testing, typically every three candidate test sets.
Wet Braking - Cool
This test follows the same procedure as the standard wet braking test — entry speed of 88 km/h, full ABS braking, VBOX measurement over the 80–5 km/h window — but is conducted at cooler ambient temperatures, typically below 7°C. The lower temperature allows assessment of how each tyre's compound performs when cold, which is particularly relevant for all-season and winter tyre evaluation. Reference tyres are run at the same frequency as the standard wet braking programme.
Wet Braking - Worn
This test follows the same procedure as the standard wet braking test — entry speed of 88 km/h, full ABS braking, VBOX measurement over the 80–5 km/h window — but uses tyres that have been worn to low tread depth, typically around 2mm. This evaluates how each tyre performs as its tread wears down, which is a critical safety metric. Many tyres lose significant wet braking performance at lower tread depths, and this test quantifies that degradation.
Wet Handling
For wet handling, I drive at the limit of adhesion around a dedicated handling circuit. I generally use specialist wet circuits with kerb-watering systems designed to maintain a consistent surface condition. ESC is disabled where possible so I can assess the tyre's natural balance, transient response, and limit behaviour without electronic intervention masking the result. I usually complete between two and five timed laps per tyre set, depending on the circuit, tyre type, and consistency of conditions. I exclude laps affected by clear driver error or obvious environmental inconsistency. Control runs are carried out frequently throughout the session, and I often use multiple sets of control tyres so that wear on the references does not become a meaningful variable.
Subj. Wet Handling
Objective data is only part of the picture, so I also carry out a structured subjective handling assessment at the limit of adhesion on a dedicated wet handling circuit. I score steering precision, steering response, turn-in behaviour, mid-corner balance, aquaplaning resistance, breakaway characteristics, and overall confidence using a standardised 1–10 scale used consistently across my testing. The final assessment combines numeric scoring with written technical commentary. I complete familiarisation laps on the control tyre before evaluating each candidate.
Straight Aqua
To measure straight-line aquaplaning resistance, I drive one side of the vehicle through a water trough of controlled depth, typically around 7 mm, while the opposite side remains on dry pavement. I enter at a fixed speed and then accelerate progressively. I define aquaplaning onset as the point at which the wheel travelling through the water exceeds a specified slip threshold relative to the dry-side reference wheel. I usually perform four runs per tyre set and average the valid results.
Curved Aquaplaning
For curved aquaplaning, I use a circular track, typically around 100 metres in diameter, with a flooded arc of controlled water depth, usually about 7 mm. The vehicle is instrumented with GPS telemetry and a tri-axial accelerometer. I drive through the flooded section at progressively increasing speed, typically in 5 km/h increments, and record the minimum sustained lateral acceleration at each step. The test continues until lateral acceleration collapses, indicating complete aquaplaning. The result is expressed as remaining lateral acceleration in m/s² as speed rises.
Subj. Comfort
To assess comfort, I drive on a wide range of road surfaces (often dedicated comfort tracks at test facilities) at speeds from 50 to 120 km/h, including smooth motorway, coarse surfaces, expansion joints, broken pavement, and sharp-edged obstacles. I evaluate primary ride quality, secondary ride quality, impact harshness, seat-transmitted vibration, and the tyre's ability to absorb sharp inputs. Ratings are assigned on a 1–10 scale relative to the reference tyre.
Noise
For cabin noise assessment, I drive at controlled speeds, typically 50, 80, 100, and 120 km/h, on NVH test surfaces with defined texture characteristics. Calibrated microphones are positioned at ear height within the cabin. Measurements are taken using A-weighting, with one-third octave analysis where required to identify tonal features such as cavity resonance. Windows remain closed, ventilation is off, and ambient conditions are controlled so the data reflects the tyre rather than external interference.
Wear
I do not conduct tread wear testing myself; where wear is included in a programme, it is carried out by a contracted specialist test provider using either an on-road convoy method or an accelerated machine-based method. In convoy wear testing, multiple vehicles run a defined public-road route over an extended distance, with tread depth measured at intervals and tyres rotated methodically to reduce positional and vehicle-specific effects. In accelerated machine wear testing, the tyre is run on a specialised roadwheel or rough-surfaced drum system designed to simulate real-world wear under controlled load, speed, alignment, and force inputs. I then use the contracted provider's measured wear rate relative to the reference tyre to estimate projected tread life.
Rolling Resistance
Rolling resistance is measured under controlled laboratory conditions in accordance with ISO 28580 and UNECE Regulation 117 Annex 6. The tyre is mounted on a test wheel and loaded against a large-diameter steel drum. After thermal stabilisation at the prescribed test speed, rolling resistance force is measured at the spindle and corrected according to the relevant procedure. The result is expressed as rolling resistance coefficient, typically in kg/tonne.
Abrasion
Abrasion is assessed as tyre mass loss over a defined driving distance or test cycle. Tyre mass is measured before and after the test using precision scales, and the result is expressed in the relevant unit for the programme. Where relevant, the methodology follows the latest applicable industry or regulatory development procedures.
How each category is weighted in the overall score:
Dry30%
Dry Braking50%
Dry Handling30%
Subj. Dry Handling20%
Wet40%
Wet Braking15%
Wet Braking - Cool15%
Wet Braking - Worn15%
Wet Handling35%
Subj. Wet Handling10%
Straight Aqua5%
Curved Aquaplaning5%
Comfort5%
Subj. Comfort50%
Noise50%
Value25%
Wear30%
Value30%
Rolling Resistance30%
Abrasion10%
Wet
The wet grip of a tyre is a critical aspect for a driver, especially in adverse weather conditions, and in this test all the tyres showcased great grip around the wet lap, with just a 3-second difference between the top and bottom performers – a small gap for a 93-second lap!
The Yokohama and Michelin tyres were the slowest, albeit with starkly different behaviors. The Michelin offered a comfortable driving experience, characterised by responsive steering and a progressive understeer balance. Despite the cooler testing conditions, Michelin's consistent time and grip over three laps indicates its suitability for real-world applications.
Conversely, Yokohama's performance was distinctive. While its super-quick steering resulted in a fast front axle turn, the rear showed a tendency to swing more. Although this made for a fun track experience, it might not be as enjoyable on the road. Another notable aspect was Yokohama's warm-up time. The tyre's first lap was a second slower than the second, pointing to a temperature-related grip increase. This suggests the Yokohama might shine in dry, race-like conditions. However, for everyday use, the Michelin might be a safer bet.
Next in line was the Hankook. Despite its impressive grip, the tyre felt slow to respond to steering, behaving more like a touring tyre than a sports variant. It shared Michelin's safe understeer balance but lacked the latter's willingness to turn.
Continental and Goodyear's performances were notable, with Continental's new PremiumContact 7 showing a significant improvement in wet conditions compared to its predecessor, the PC6. This model was far less sensitive to load changes and behaved much like the Michelin, albeit with slightly less communication at the limit.
Goodyear’s performance might not have been the fastest, trailing the best by only 0.8%, but it excelled in overall balance. It combined the safe understeer balance of the Michelin and Continental with some sporty handling, proving both predictable and quick. As an all-rounder for this Golf GTI, Goodyear's Asymmetric range was the standout, demonstrating impressive performance in the wet.
Finally, the Bridgestone Potenza Sport took the crown as the fastest tyre, albeit by a small margin. Its lateral grip was exceptional, giving it a sporty feel, second only to the Yokohama. This tyre got grippier as it warmed up, similar to the Yokohama. Drivers seeking an exciting wet drive might find this tyre worth considering.
Wet Handling
Spread: 3.47 s (3.8%)|Avg: 92.96 s
Wet handling time in seconds (Lower is better)
Bridgestone Potenza Sport
91.20 s
Goodyear Eagle F1 Asymmetric 6
91.97 s
Continental PremiumContact 7
92.06 s
Hankook Ventus S1 evo 3
93.25 s
Yokohama Advan Sport V107
94.60 s
Michelin Pilot Sport 5
94.67 s
The standout performer in wet braking was the newest tyre on test, the PremiumContact 7, though the results are nuanced.
We conducted wet braking tests in three different ways, twice at the new state and once at the worn state. For the new state, we tested at different temperatures. Ideally, we wanted the cold temperature test to be at around 5-7°C, but logistical delays meant we tested with an average air temperature of 8°C and water at 12°C. While this was cooler than standard test conditions, it was still warmer than real-world conditions. The warm temperature test was done at an average of 18°C air and 19°C water.
Why are these temperatures significant? It's become increasingly apparent that some tyre manufacturers could be tuning their products for optimal performance at tyre test temperatures, which doesn't always translate to real-world wet conditions.
The third run involved wet braking tests on worn tyres, specifically those machined down to 2mm with a small run-in. While we intended to do more with these worn tyres, weather constraints limited our testing. However, it's worth noting that wet braking is most critical at the worn state, as tyres generally improve in dry conditions as they wear.
So, what do these wet braking tests reveal? The Continental tyre demonstrated superior performance when new, both in cooler and warmer temperatures. However, it shared the most significant performance drop, alongside the Yokohama, when worn.
Bridgestone, Goodyear, and Michelin saw the least performance reduction when worn. However, Bridgestone and Goodyear's performance dipped in cooler conditions. The Hankook tyre registered the smallest performance drop as temperatures cooled, but it was among the most affected when worn. As for the Yokohama, it struggled with wet braking across all tests.
The take-home message here is that no single tyre excelled in all aspects of wet braking, indicating a complex interplay of factors influencing tyre performance under different conditions.
Wet Braking
Spread: 2.60 M (9.6%)|Avg: 28.62 M
Wet braking in meters (80 - 0 km/h) (Lower is better)
Continental PremiumContact 7
27.10 M
Bridgestone Potenza Sport
28.30 M
Goodyear Eagle F1 Asymmetric 6
28.60 M
Hankook Ventus S1 evo 3
28.90 M
Michelin Pilot Sport 5
29.10 M
Yokohama Advan Sport V107
29.70 M
Wet Braking - Cool
Spread: 4.40 M (15.8%)|Avg: 30.55 M
Wet braking at cooler temperature in meters (80 - 0 km/h) (Lower is better)
Continental PremiumContact 7
27.90 M
Hankook Ventus S1 evo 3
29.50 M
Michelin Pilot Sport 5
30.70 M
Goodyear Eagle F1 Asymmetric 6
31.40 M
Bridgestone Potenza Sport
31.50 M
Yokohama Advan Sport V107
32.30 M
Wet Braking - Worn
Spread: 4.40 M (10.9%)|Avg: 42.20 M
Wet braking at Low Tread Depth (80 - 0 km/h) (Lower is better)
Bridgestone Potenza Sport
40.50 M
Goodyear Eagle F1 Asymmetric 6
40.50 M
Michelin Pilot Sport 5
41.70 M
Continental PremiumContact 7
42.20 M
Hankook Ventus S1 evo 3
43.40 M
Yokohama Advan Sport V107
44.90 M
There was a standout tyre in aquaplaning, the Continental finished top in both straight and curved aquaplaning, with the Michelin and Goodyear also very good in deeper water.
Straight Aqua
Spread: 4.10 Km/H (5.1%)|Avg: 78.72 Km/H
Float Speed in Km/H (Higher is better)
Continental PremiumContact 7
80.90 Km/H
Michelin Pilot Sport 5
80.50 Km/H
Goodyear Eagle F1 Asymmetric 6
79.00 Km/H
Bridgestone Potenza Sport
78.30 Km/H
Hankook Ventus S1 evo 3
76.80 Km/H
Yokohama Advan Sport V107
76.80 Km/H
Dry
During the dry braking test, barring Yokohama, all the tyres were within a 2% difference, or 65 cm (25 inches) of each other. Yokohama could benefit from slightly more grip, an issue potentially influenced by the cooler conditions.
Dry Braking
Spread: 1.68 M (5.1%)|Avg: 33.56 M
Dry braking in meters (100 - 5 km/h) (Lower is better)
Dry Braking: Safety Impact: Best vs Worst Tyre
As for handling, all tyres performed within a 2% range on the lap, demonstrating their high-quality performance. However, considering these tyres essentially target the same customer, it's interesting to observe the significant differences in feel.
The tyres can be categorised into three groups, the first group of tyres I'm calling 'sports touring', which includes Hankook, Michelin, and surprisingly, Continental. The surprise is because the PremiumContact 6 was one of my favourites for sporty dry drives, but its successor, the PremiumContact 7, seems more mature and resembles Michelin's performance. Among these, Hankook was the least precise in steering and communication at the limit. Both Michelin and Continental offered lovely initial steering, albeit not the fastest. They offered incredibly safe balances with a predominance of understeer, which as I always point out, is safe, if somewhat unexciting. If I were to recommend a tyre for a fast lap to a novice, say my father, it would be one of these.
Then we have the 'fun' tyres, namely Yokohama and Bridgestone. Both were swift to steer and felt sportier than the others, but the trade-off is a more playful rear end, making them more challenging to handle. Personally, I relish this trait in a tyre, and if I were fitting one for a track day, Yokohama would be my choice. It provided similar steering to Bridgestone but offered better feedback at the limit and better grip. The Bridgestone Potenza Sport, however, seemed to degrade quite quickly after just three laps on this demanding circuit.
Lastly, there's Goodyear, which positioned itself somewhere between the fun tyres and those tending towards understeer. It seemed to perform well in all aspects, and for dry handling at least, it appears to offer the best compromise. All in all, these tyres are excellent performers. For road use, I'd lean towards either the Michelin or Goodyear, depending on your specific preferences.
Dry Handling
Spread: 1.40 s (1.9%)|Avg: 74.13 s
Dry handling time in seconds (Lower is better)
Yokohama Advan Sport V107
73.58 s
Bridgestone Potenza Sport
73.71 s
Goodyear Eagle F1 Asymmetric 6
73.92 s
Continental PremiumContact 7
74.12 s
Michelin Pilot Sport 5
74.44 s
Hankook Ventus S1 evo 3
74.98 s
Wear
In terms of tyre wear, the method utilised in this test is what the industry refers to as the 'gold standard' of wear. The wear experts at Dekra conducted this test, which involved a convoy of cars traversing a carefully planned route for 12,000 kilometres. The tyre wear was monitored and measured by lasers every few thousand kilometres, with results carefully extrapolated to predict end-of-life figures. This method more accurately reflects real-world tyre wear compared to many machine-based tests.
As one might expect, Michelin demonstrated the longest tread life, surpassing Goodyear and Continental by 15%, Hankook by 24%, and Bridgestone and Yokohama by a significant 33%. This aligns with Michelin's reputation for longevity, and importantly, it allows us to include a 'value' metric in our testing. This metric - cost per 1,000 kilometres - helps to determine whether a more expensive, long-lasting tyre offers better value than a cheaper, quicker-wearing alternative.
Bear in mind that prices will fluctuate depending on your location, so feel free to crunch your own numbers and share your findings in the comments. However, based on the prices we paid, Hankook offered the best value at €3.16 per 1,000 kilometres, closely followed by Continental at €3.30. Michelin and Goodyear tied at €3.50, while the quick-wearing and more costly Bridgestone was the least economical at €4.53 per 1,000 kilometres.
The test revealed a noticeable inverse relationship between the 'fun' factor of a tyre and its rolling resistance. Both the Bridgestone and Yokohama tyres significantly underperformed in comparison to the other four tyres in terms of rolling resistance, with Continental slightly outperforming the rest.
Rolling Resistance
Spread: 1.90 kg / t (22.6%)|Avg: 9.12 kg / t
Rolling resistance in kg t (Lower is better)
Continental PremiumContact 7
8.40 kg / t
Hankook Ventus S1 evo 3
8.60 kg / t
Goodyear Eagle F1 Asymmetric 6
8.60 kg / t
Michelin Pilot Sport 5
8.60 kg / t
Yokohama Advan Sport V107
10.20 kg / t
Bridgestone Potenza Sport
10.30 kg / t
19,000 km
£1.45/L
8.0 L/100km
--
Annual Difference
--
Lifetime Savings
--
Extra Fuel/Energy
--
Extra CO2
Estimates based on typical driving conditions. Rolling resistance accounts for approximately 20% of IC vehicle fuel consumption and 25% of EV energy consumption. Actual savings vary based on driving style, vehicle weight, road conditions, and tyre age. For comparative purposes only. Lifetime savings based on a 40,000km / 25,000 mile tread life.
Regarding the comfort level of the tyres, as anticipated, most demonstrated an inverse correlation with handling. The Continental, Michelin, and Goodyear tyres performed best across various surface types tested. Hankook showed exceptional performance over larger impacts but was somewhat more jittery on smoother surfaces. Bridgestone began to show signs of firmness, while Yokohama was particularly jarring over potholes.
Noise
Spread: 1.00 dB (1.4%)|Avg: 72.37 dB
Internal noise in dB (Lower is better)
Continental PremiumContact 7
71.90 dB
Hankook Ventus S1 evo 3
72.00 dB
Bridgestone Potenza Sport
72.20 dB
Goodyear Eagle F1 Asymmetric 6
72.40 dB
Michelin Pilot Sport 5
72.80 dB
Yokohama Advan Sport V107
72.90 dB
We did measure internal noise levels; however, as is often the case, the results were closely matched, and due to weather constraints, we were unable to conduct a subjective assessment of the tyres noise.
Finally, we looked at abrasion figures, which measure the amount of tyre tread lost per kilometre, normalised to a one-tonne vehicle. While this data doesn't directly impact tyre performance or your wallet, it does have environmental implications. This figure represents the amount of rubber dust your tyres produce while driving.
Michelin led in this category, producing over 9% less rubber particulate matter. On the other hand, Hankook generated 32% more. This is an aspect I believe the industry should focus on more in the future, and it's something Michelin is advocating. Let's be kinder to our environment, folks.
Abrasion
Spread: 31.30 mg/km/t (47.6%)|Avg: 79.22 mg/km/t
Weight of Tyre Wear Particles Lost (mg/km/t) (Lower is better)
Michelin Pilot Sport 5
65.70 mg/km/t
Bridgestone Potenza Sport
72.30 mg/km/t
Goodyear Eagle F1 Asymmetric 6
72.40 mg/km/t
Continental PremiumContact 7
75.90 mg/km/t
Yokohama Advan Sport V107
92.00 mg/km/t
Hankook Ventus S1 evo 3
97.00 mg/km/t
Results
The final order of results follow, and as always you can use the link below to adjust the score weighting based on your own driving style and requirements and select the best tyre for you.
The Continental PremiumContact 7 impressively managed wet conditions and energy use, proving to have the best wet braking, be less sensitive to load changes compared to its predecessor and the lowest rolling resistance on test. The PC7 was also the best tyre in the deeper water of the aquaplaning tests.
Despite its solid performance in new state wet braking, the Continental tyre dropped off more than the competition when worn. In addition, while it showed improved maturity over its predecessor, it lost some of its sporty appeal, making it less engaging for those seeking a more spirited drive.
The Continental PremiumContact 7 demonstrated impressive abilities in handling wet conditions and excelled in new state braking in both cooler and warmer temperatures. While it couldn't quite match the Michelin in the wear test, it proved to be better value thanks to the lower purchase price. Despite its strong overall performance, it has lost some of its sporty appeal in favour of increased maturity, which might disappoint drivers seeking a more spirited experience, but that maturity has brought improvements in rolling resistance, noise and comfort, proving to be one of the best on test. An impressive second win for the new PremiumContact 7.
The Michelin Pilot Sport 5 stood out for its durability, with the longest tread life among all tyres tested. It also maintained consistent performance across various conditions, offering good steering and a progressive understeer balance, and was the tyre with the lowest eco impact.
The Pilot Sport 5 was the most expensive tyre to buy, and would benefit from a little more grip in wet conditions.
As you would expect from the Michelin brand, the Pilot Sport 5 stood out for it's impressive longevity, boasting the longest tread life among all the tyres tested. It offered a great driving experience with good steering and a progressive understeer balance. The Michelin was also the kindest to the environment, producing the least amount of rubber particulate matter. This isn't a tyre we'd rush to take on track, but on the road it is an excellent all round tyre.
The Goodyear Eagle F1 Asymmetric 6 showcased its versatility by blending the safe understeer balance of the Michelin and Continental with sporty handling. Its predictable and fast performance made it a strong all-round choice, particularly for the Golf GTI. It was also the best tyre at worn state during the wet braking test, had great comfort and low wear.
The Asymmetric 6 is a hard tyre to find a negative about, but on track it doesn't seem to have the heat resistance the Asymmetric 5 had.
Another very impressive result for the Goodyear Eagle F1 Asymmetric 6, proving to be the most consistent tyre across all categories
The Hankook Ventus S1 evo3 offered excellent value for money and commendable wet grip, with low energy use.
The Hankook had the slowest steering response of the test, feeling more like a comfort bias tyre than an outright sports tyre. It also has one of the lowest aquaplaning resistances on test.
The Hankook excelled in terms of value for money and offered commendable grip. They were particularly impressive in handling larger impacts but were less precise to steer and provided less feedback at the limit. Recommended if you're looking for a well priced tyre with excellent wet grip and good levels of comfort
The Bridgestone Potenza Sport showed significant grip in wet conditions and a sporty feel, achieving the fastest lap time among the group, and had excellent wet braking when new and worn and produced a low amount of rubber particulate matter making it an environmental choice.
The Bridgestone dropped more than some competitors in the cooler wet braking test, and despite its impressive performance on the track, the Bridgestone displayed considerable wear after just three laps on a demanding circuit, indicating potential longevity issues when used on circuits. The Potenza Sport also had a high rolling resistance and struggled in the deeper water of the aquaplaning tests. the Bridgestone also proved to be the worst value on test, costing over 30% more per KM driven than the best in the test.
The Potenza Sport is an impressive sports tyre with excellent grip in the wet and dry. The tyre certainly does better when it's warm, which could be an issue for cooler wet running on the road, and it has high rolling resistance, but as a sports tyre for the road, its steering feel and speed is excellent. It is a costly tyre to run, but the tradeoff in driving enjoyment will be worth it for many driving enthusiasts
The Yokohama Advan Sport V107 offered a uniquely fun and sporty driving experience for those who appreciate a thrill in their drive. The quick steering and greater feedback at the limit distinguished them from the others and was the only tyre of the six that took the hot agressive dry handling circuit without showing a considerable amount of wear.
the V107 tyres struggled with stopping in wet conditions across all tests and required more time to warm up, potentially impacting their performance in cooler climates. They were also significantly rougher over potholes, indicating potential comfort issues and had a high rolling resistance.
The Advan Sport V107 provided a uniquely sporty and fun driving experience, with quick steering and greater feedback at the limit. However, they struggled with stopping in wet conditions and required more time to warm up, which makes it less ideal than some of the other tyres in this test for use on the road. Furthermore, they were significantly rougher over potholes, indicating potential comfort issues for everyday driving. A charming tyre and the best road tyre of the group if you plan on doing track days
Would michelin pilot sport 5 be an overkill for a 95bhp 125nm small hatchback weighting 1ton? I see they offer them in 205/45r16 dimension. I was thinking of getting them, but I am skeptical because of high price and my low power/low weight car. Any suggestions?
I don't think so. You might not trouble them with acceleration but you can easily reach max grip in cornering and braking. They'll possibly last forever on your car too.
Would they have trouble reaching operating temperature in a lightweight and underpowered car like mine? Tyre dimensions are 205-45-r16-87w- and car is ~1050kg/95bhp fwd.
Thanks for the reply, I ordered yokohama advan fleva v701 after all. They cost me about 400€, while ps5 were 570€. I will put them on this Tuesday most probably. I will write a review about my current Bridgestone Turanzas t005 soon. (105k kms on those!)
Hi. Really nice test - as always. When I drive BMW iX3 with Yokohama Advan Sport 107 (BMW OE) with tire sizes 245/45/20 front and 275/40/20 rear, how will the Yokohama compare to the others in the same tire size, if available, because I have the impression they are not made in these tire sizes? I think my Yokohama can seem stiff/hard in some situations, but it is very quiet even with a 275 rear tire (I come from Mercedes E220d with 245/45/18). Do you have an advice to me: All tires will definitely cover my needs, but which is best specifically on comfort: how stiff/hard/potholes and how noisy is it inside the car itself, which is an electric car that is quiet in the cabin? Thank you in advance.
Thank you for your answer. Then we are almost in agreement I think, regarding the 107's stiffness and comfort. The BMW iX3 was always delivered with either Bridgestone Alenza BMW OE or the Yokohama. With your knowledge of Bridgestone, would you say the Alenza is more comfortable?
The Yokohama Advan Sport V107 is called the trackmaster. I'm looking for a tyre to use on my BMW125i Coupe, I will use the car on track most of the time just to have fun. So direct steeringfeel is very important. Would the V107 be a better choice then the Advan Neova AD08 RS or the Bridgestone Potenza Sport?
Thanks for your reply. I think the AD08RS is not as good as the older AD08 which is not been sold in the Netherlands anymore. I also saw your test "2022 Tyre Reviews UUHP Summer Tyre Test" where the Goodyear Eagle F1 SuperSport comes out as the Trackmaster. It seems this ones suits me even better in my search for the best Road Legal track tire for my BMW 125i coupe, do you agree with that or can I better save some money and buy the Yoko'hama V107 ?
I've not tested them back to back so I can't comment with any real certainty. If there was a big price difference I would go with the cheaper, if there was no price difference I would go with the goodyear.
Thank you for your quick reply! Your advice is very helpful and I will definitely take it into my final decision. I will let you know what it turned out to be.
I finally bought and mounted the V107, made my first ride today and my first impression is very good on wet and dry. Tomorrow I'm going to a track day at the Zandvoort GP circuit. What do you guys recommend as tyre pressure? Outside temperature is about 15 degrees and it promises to be a dry day. I read many different stories ranging from the recommended tyre pressure for street use to 0.5 bar higher or lower.
Glad you like them, let me know how they do on the track day.
Pressure is a tricky one. Assuming your car has stock suspension I would suggest aiming for sticker HOT. Go out a few PSI under sticker, warm up, do a few laps then come in and reset them.
If your car has a high sticker pressure for rolling resistance reasons, you can go under.
Not sure how this will sound but I currently have an Audi a5 b9.5 and it has the OE Bridgestone potenza s005 which I don't think are very great, im torn between the Michelin PS5 and Eagle f1 Asym 6, sure the Goodyear is cheaper and arguably slightly better but what is swaying me is that the Michelin is just such an attractive tyre compared to the completely dull asym 6, would you say this is stupid and the asym 6 would be the logical choice because im finding it so hard to decide because of all the factors, I also had the ps5 on a ford fiesta and they were superb but ofc now it'll be a completely different size and car.
Hello I have a Mercedes a class w176 A200d 4matic Amg Line 225/40 r18
I was undecided between Michelin Conti and Goodyear But I avoided Michelin because you rated 98 on comfort
My car is so stiff I live in Sicily with a lot of photoles
So I purchased continental because is the last product on the market
So you think are more comfortable pc7 or as6? And yeah I purchased pc7 because they are the winner Than I read Goodyear are subj winner .. ??? Next time maybe ahah
You did the right thing by buying Continental tyres. I used Goodyear Eagle F1s before, they are too soft. Damaged a wheel thanks to a pothole. Bought Continentals for winter (winter tyres are softer than summer tyres) and have no problem at all with potholes. https://uploads.disquscdn.c...
Sorry about the wheel. What about other aspects of Goodyear? Steering feel and precision on highway? From the test it looks the best for everyday sporty driving...
Thank you, I appreciate it ? Went thru 3 storms and never had a problem with aquaplaning. They were very suitable for high speed driving (drove a lot of German highways). About steering feel, don't know what to say since everybody has different expectations but I just couldn't click with them. Now I have Continentals and can corner faster than I did with Goodyears, and I feel like they are more responsive (AWD car on drift mode). Hope it helps, finding the right tyre is challenging ?
Yeah, tyres... Even the same tyre feels different on different car or/and size... I have Pilot Sport 4 and corners are very fast, good tyre in all aspects, but I dont feel anything at higher speeds, like am just playing computer game with keyboard. Since I am not racing anyone except me, I would like to have more joy from driving.
You talking about winter Continentals? They are better then super duper summer Goodyear? Particularly recommended in this test for GTI ;) Oh man, I need to start from scratch my search!
Haha yes, GTI, we traded ours in last year ? Had chance to drive it with Goodyear Eagle F1, Continental summer and winter tyres on. Goodyears were nowhere next to being super duper especially when accelerating or cornering. When they were on, I was constantly battling with electronic differential lock. I wonder if the test results of Goodyear is very good since they had 225/40 R18 and I had 235/35 R19. I know what you mean about Pilot Sports, was many times in a car with them on and it felt boring. They are very track oriented just like their racing counterparts. Good luck with your search ?
Hi, I am looking for a tyre for M2 F87. The PS5 and Asymmetric 6 are not available in M2 sizes, so I was thinking of trying the Hankook S1 EVO 3? I like the comfort aspect of it, but not sure if it is too soft for a car like M2. Should I just go for the PS 4S for double the price? Or any other suggestions would be much appreciated. Currently on Dunlop SportMaxx RT2, good dry grip, but it feel quite harsh on the road, so am looking for something softer. Thanks!
Hi, Firstly many thanks for your hard work! Keep things going! Looking for the set of summer tyres for 2019 Skoda Superb 2.0 TDI 190HP in 235/40/19 size. What would be your suggestion choosing from below? 1. GY F1 ASSY 6 2. Conti Sport Contact 7 3. Michelin Pilot Sport 5 What is your personal ranking basing on your own experience? Thx in adv.
Is the Bridgestone Potenza sport the same tire as the Bridgestone Potenza S005 over in the European market? I cannot find any information about this tire which is currently on my car. I have my own opinion of it which is not that great, but I’m conscious to find out other people’s perception of it?
No, the S005 is a different product. I think it was mostly OE only, never really made in a lot of sizes which is why there's limited information on it. I think the closest tyre would be the S001
I thought I'd replied to this somewhere. No, the s005 was likely a low size model for OE, like the S007. The Potenza Sport officially replaced the S001. The S005 might have elements of the Potenza sport in but i'm fairly sure they are not the same tyre with differing names.
My daily driver is a BMW E90 330i (with an aftermarket Torsen differential). Tyre size: 225/45/17. I'm living in Bordeaux, south west of France, so mainly dry and warm conditions.
My last 2 sets of tyres have been Michelin PS4. Excellent : very good grip and treadlife (40000km/set). However, subjectively, I find their reactions quite sharp at the limit: feeling like losing and recovering grip is quite ON/OFF. Not easy to play with the oversteer.
My tyres are worn, I need to change them. The Michelin PS5 would be the "natural" choice, but I guess they will have similar handling/reactions as the PS4 ?
I would like to consider a more progressive / predictable tyre. I have thought about trying the Michelin Primacy 4+. Less sporty, but maybe be funny to drive on my car ? A friend who sells tyres also recommended me the Goodyear Assymetric 6 as good compromise between tyre response and progressivity.
Would you have any recommendation between these choices ? or other recommendations ?
Are they runflats? Generally the PS4/5 is one of the less reactive uhp summer tyres so if you find it too much moving to something like the Primacy range would be the logical step.
My PS4 aren't runflats, I removed the runflats (bridgestone) very soon after buying this car.
To be a bit more accurate on my question: no problem with the front end, the steering response is fine, but when oversteering/sliding the car, I feel the rear end looses and recovers the grip abruptly.
My former M3 E36 3.2 was much more progressive and easy to control. (it had new Dunlop Sport Maxx, this was in 2010).
Both cars have a well balanced 50/50 front/rear weight distribution. I'm wondering if the difference of handling between both may be mainly caused by the different nature of the limited slip differential (discs on the M3 VS torsen on my 330i), maybe the way the Torsen transfers the torque to the outside wheel creates these reactions. Or if it's just the difference of chassis between the 2 generations of cars. If you have any opinion on this, I'd be glad to read it.
One thing I find a bit odd is that the conti premium contact 7 has come first in the tyre reviews UHP test AND premium touring tyre test. @TyreReviews:disqus - does this mean that the CP7 is the best regardless of whether one wants to prioritise comfort or sportiness (without considering UUHP segment)? I would have thought a tyre needs to trade off between these two characteristics?
Genuinely struggling to find a replacement tyre for my Mazda MX5 ND2. So many of the performance tyre options exclude 17 inch rims. My tyres are 205/45 17 and would prefer to keep this size but could consider 215/45 17 for my 7.0 width rims. I was keen on the Conti Extreme Contact Sport 02, but they don’t supply them in Australia. Here we get the Conti Max Control 7 which has the same tread pattern as the ECS, but a different compound and construction. There are very few independent, knowledgeable reviews of the MC7, so I’m wary of assuming they’re as good as the ECS. My primary aim for the tyres is to provide enjoyment during spirited road driving. Any suggestions would be greatly appreciated.
I am looking for a new set of tyres for my 2019 Alpina B5 biturbo touring. The Alpina comes with Alpina spec Pirelli pzero’s. https://www.pirelli.com/global/en-ww/road/cars/tyres/the-art-of-perfect-fit-51038/ I am now on the second set and want to try something else because I am not entirely satisfied with the Pirelli’s. The alpina is a powerful heavy car. It is often described as the ultimate autobahn cruiser (I am in fact spending quite some time at 230 km/h cruising speeds on the German autobahn) But I also do appreciate dynamic steering behaviour. I am deciding now between conti sportcontact 7, Michelin pilot sport 5, or the Michelin pilot sport 4s. The Goodyear Eagle F1 Asymmetric 6 is not available in my size otherwise I would have considered that as well. I can also wait a bit longer for the pilot sport 5s to come out for non oem. Or wait for the new Pzero to come out. (I have about 6000km of tread life left on the Pirelli’s) 255/35 ZR20 on the front axle and 285/30 ZR20 on the rear
My experience with the Asymmetric 6 after approximately 6 months driving is that it’s a good tyre on the road, predictable and grippy. It’s not a good choice if you want to do the occasional track day. In a GTi on a relatively cool day (18 Celsius) they looked shredded from the first 12 minute run on track, and overheated noticeably after a few fast laps, I regretted taking them that day.
I've got a pair of Goodyer Eagle F1 Asymetric 6 on my Peugeot 207 (same category as you) They grip a lot on both dry and wet (I can't manage to make to tire scream during corners if I don't jam the throttle like a noob)
But their wear isn't that good :/ When I go for a more spirited drive I can see the same stuff you described on my tires :/ Plus, after about 8 000km, the tire has about 2 000 to 5 000km of remaining life. My car and driving style plays a lot for this (207 RC is known to eat through tires !) but still I would have expected a lifetime of about 20 000km :)
I've been offered Conti SC7 - they didn't have PC7, GY AS6 or Michelin PS5 available. My preference are the AS6 for my 440i. Is the SC7 more of a compromise?
I'd say it would be slightly better grip, sharper turn in but less wear and less comfortable and possibly a little more noise than either the PC7 or AS6. All four of those I'm considering getting when it's time for me to replace all four tyres probably around October on my mk7.5 golf GTi performance. I've been getting goodyear consistently for years and I do like them. My old car, now my wife's has Asymmetric 6 all round and they are good and seem to be wearing well. Although I felt the turn in was slightly sharper on the old asymmetric 5 and they lasted 20k (miles) on the front of a 2017 Seat Leon 1.4 tsi 150 excellence tech.
Well, I went for the SC7. Much better than the Bridgestone S001 RFT, less bump and thump over ridges and imperfections. More comfortable. Steering is about the same. They feel like Michelin PSS to me, perhaps quieter, but difficult to tell on different cars. Seem good in the wet and dry. No regrets so far, but still think GY AS6 or Continental PC7 would've been better suited to my 440i.
I bought the GY Asymetric 6 and have done some road trips now. 205/45 17. I am totally happy with my choice. The tyres feel very reassuring in dry conditions and heavy rain, have lots of feeling and grip.
I have run the Hankook Ventus evo 2 and evo 3 over the last few seasons of track days here in Illinois, and they are incredible value for money. The evo 3 seems to have overcorrected some complaints with the evo 2 by improving comfort at the expense of on-center wandering and initial turn-in vagueness but you quickly (and I mean quickly) get used to it on a track. Interestingly they don't seem to be any more vague on a hot track than a cooler one, consistency indicating quite a bit of silica and good belt and block engineering. Considering the durability, predictability and dry traction for the money, its financially reckless not to consider at least trying these tires on a daily driver or track car because they offer a dual personality few ultra high performance tires can. While the evo 2 is a slightly better track tire, the evo 3 is an overall better tire that sacrifices very little.
So after 20 years of getting GY's (loved most of them), Continental (loved all of them), Pirelli (hated most of them) and Bridgestone hated all of them, I got first time ever Michelin PS5 2 years ago on my 4 series coupe Bmw, they're 225/45/18 size. After that I was so amazed by Michelin that I changed to them on all of my cars including 911 997 and as long as they make them this good I'll keep buying them. The wear is amazing and like they told me in the tire shop that they will stay the same all their life. So after 60k km, yes 60k km they were done and just today I put a set of new ones. The GY and Continental always performed well at the beginning but after half of the life it would go significantly down. This performed 50% better than ever before. Yes compared to OEM Pirelli Cinturato P7 run flats the car was equipped from new there is a hint of less steering precision but my God have well they keep corners at Dolomiti mountain roads both in wet and dry and all the way at 50k km. I was so blown away by them that I got for the same car Alpine 5 winter tires and was amazed as well.
A bit of an apples to oranges comparison but still, per Jonathan old reviews of contis pc6 I bought them to replace my worn eagle 5s in 245/45 r18 size, and was unpleasantly surprised by their lack of sportinnes and steering feel as he always underlined how very sporty they feel compared to it's competitors. They actually feel very touring like, being pretty soft and noticeably more quiet than eagles, but very much feeling mushy in steering response. Goes to show how different tires can be depending on their sizes.
Sorry it didn't work out, I've not tested that size so it's interesting feedback. Generally there aren't huge differences between sizes, especially if you're matching load ratings when swapping tyres, but the Asymmetric 5 is a gem.
That said, I had asymmetric 5 and PC6 in 225/40 R18 on my personal vehicle, and I kept the Contis as I prefered the handling.
So, on the back of Jonathan's excellent and detailed reviews we have now put Continental PremiumContact 7 tyres (235/35 R19) on our Audi S3. Replacing some old Goodyear tyres. The difference is Night and Day - the car feels more planted, you feel more connected to the road and the handling in both wet and dry is superb. Breaking is exceptionally good and I highly recommend making the switch to the CPC7 Kudos Jonathan and many thanks!
I've been following this site for years and this'll be my first comment ever. My car is BMW 3.20D (F30) and I'm using 225/45/17 size. Tests here helped me a lot deciding a tire set. Last tires I bought was Hankook Ventus Prime 4 and it's time to replace them. Hankook did good but i want to give a chance to others and still couldn't decide between Continental PremiumContact 7 and Goodyear Eagle F1 Asymmetric 6. Michelin tires' life is no good, that's why it's not an option. I'm not using the car up to the limits all the time, but sometimes yeah it feels good to hit the throttle a bit Especially at the turns/corners I really like to do the max I can, and see the car keeping its line. City I live at is a summer city and so hot and humidity is so high, plus the roads are eehhh.
A little help, an idea or an opinion would really help me to choose the next tire set. conti or goody??..or any other ?.
First of all, great test and thanks for the detailed information and comparison!
I've been following your tests for years. In 2021, I bought a 2018 Volvo S60 T3 (152 hp FWD) and after reviewing your test results, i bought Michelin Pilot Sport 4. I had great experience with them, no complains overall except they wore down pretty fast.
It is time to get a new set of summer tyres. Since my volvo is a heavy car and I like to push it to its limits, I think another UHP summer tire is the one to get. My first question is, am I buying more capable tyres than my car (note: in the long distance travels, I usually drive around 200 kmh speed). If so, for sporty (good handling but not for track use) but safe driving what would you recommend as summer tyre?
If you think UHP is the way to go, I'm between Michelin PS5 and Continental PC7. I wonder what you recommend for my car?
I looked for the asymmetric 6 also, but after a quick search I'm not sure if there is any asymmetric 6 for my tyre size which is 215/50r17, at least in my region.
Would you recommend the asymmetric 6 over Michelin PS5 and Continental PC7?
This is a great review. I am still having trouble choosing my next summer tyres. I've had default Pirelli P Zero's (which for some reason are not included in the test?) on my hothatch so far, and they seemed pretty good, but I was wondering if I can get something purely grip oriented because those Pirrelis are done. I don't care about the noise or fuel economy, I do less than 10 000 km per year, so I am also not looking for a particulary long lasting tyre. I was curious to know what would be the best summer tyre, oriented for dry conditions sports performance. Seems I should go with Yokohamas, but I am slightly biased against this brand... Any advice?
Thanks for doing the internal cabin noise testing. It's a measurement that few tyre reviews seem to include, but I feel it is very important in choosing the right tyre.
I know there was only 1 decibel between the tyres, but as decibels is a logarithmic scale, this is still significant.
Pitch is just as importnat, which is why I've tried to get better at subjective noise. There's been times where a 70db internal tyre has a high pitch and is really annoying, and a 71db tyre has a low pitch which is way nicer to live with. Obviously low DB and nice noise is the holy grail.
Hi there, Quick questions Currently have the S1 Evo 3 all round (255/35 20 front and 275/35/20 rear) on my S-class (v8 twin turbo S500). They’re okay but not tried any other tyres on this vehicle and I find them a little rough riding and loud. Both fronts are relatively new but rears are up for replacement. Should I go with the same or Pilot Sport 4S or Eagle F1 Asy 6? Wear not a priority, just handling and comfort. If no difference likely to be noticeable I will stick with the Evo3 as that way they will match front and rear. Thanks!
I've run the Evo 3 in a non-staggered front\rear and notice the rears wear quicker than the front as well. At least they're (really) cheap. But it's surprising you find them riding rough and loud. I think they are among the best daily driver UHP summer tires I've owned, especially compared to the ContiExtremeContact DW's and Goodyear F1's, both tires I'll never run again on a car I drive on the street. Unfortunately the ExtremeContact are not in this review, and it seems the new Conti's are greatly improved. The ExtremeContact DW was outclassed by the DWS06 back in the day anyway, a tire that offered nearly the performance of the DW with superior comfort, four-season drivability, double the treadwear and a lower price.
Hey! Finally my staggered CLS setup is done. I thought it is fair to share my experience. I had S1EVO3 all around 255front, 285 rear. It grips like hell and wonderful in rain, but hated it because the steeringwhhel is laggy, lazy, dull. And the back of the car feels loosen and wobble at hard cornering. I made a decision to replace them right away, and a lil bit narrower ones since they will be better in every aspect. I chose Asy6 for fronts in 245. They are mindblowing! Much more comfy, even with a slight decrease in sidewall thickness. The difference is surprisingly big. Asy makes the road much muhc smoother. Huge plots felt significantly less. The noise is also a bit less. And, a huge AND, the steeringwheel reaction is day and night much better. Still not a tracktire, but awesome for road spirited drive. My mind is blown, that Asy6 is more comf and also sharper...most of the cases is a choose between those....and the S1EVO3 is a good tire, but still destroyed. I chose PS4 for the rears in 275. Wanted the PS4S but it is not available anymore. And there is no other fine tire available in 275/35r18. The PS4 surprised me, since the sidewall is pretty stiff. The wobbly losen and is gone, the car is very very confident in the corners, finally I am confident and not terrified that rear grip is lost. It is a bit quieter (expected even more since there is 4dB difference, but maybe needs some more miles to blend in) and everything is more or less the same. so in conclusion, the PS4 is not a dull tourer tire, it is advised to buy for a sporty but not uncomfortable tire. basically it delivers the same comf, grip, etc as the S1EVO3, but with perfect precision and sidewall-stability (which is dealbreaker) and more silence, and a supersexy sidewall. :D The dry and wet grip is not tested yet to the limits...both are perfect.
Summary: S1EVO3 is not really ideal in wide sizes, Asy6 is magic, PS4 is not a lazy tourer tire, be brave to use it for road-spirited usage. AND: This setup is a very well balanced combination, love it. IMO the only diff with asy6 all aorund would be a very minor extra addition in comfort, noise comfort.
I'm curious about the wear vs abrasion results for the Bridgestone as it placed on the opposite ends of the scale (6th & 2nd respectively). From what I've gather from reading this article, both tests use tread depth loss as a key parameter and therefore expect similar comparative resultsl. All the other tyres had very similar wear vs abrasion rankings, any ideas why the Bridgestones ranks poorly for wear yet performed well for abrasion?
Wear is tread depth loss, abrasion is total compound lost. If a tyre with a good wearing compound starts with a smaller amount of compound on the tyre, it will have a lower predicted mileage but better abrasion results. This is usually Michelins trick, apparently they balance it better than Bridgestone does currently.
Amazing test and channel, so much passion as well ! Thank you !
I don't see any info regarding fuel consumption of each tyre especially in regards to the fuel cost nowadays (unless I'm not interpreting some values properly, in that case that would be great to know). I've also didn't find information about rim protection as it's a disaster with my current MPS3 monted on Mazda3 18" rims navigating between parisian sidewalks ;) Could you advise on these two points between CPC7 VS MPS5 please ?
Rolling resistance results are on the page which is the tyres direct affect on your fuel consumption. Rim protection is also listed under each tyre in the results.
Another amazing review that makes the maze of searching for tyres a lot easier to run through! I've currently got an Evo 9 with stock rims ( 235/45/17) , the only size that the new PS5s don't support :( Would you recommend the Conti or the Eagle F1 ? I've seen a lot of people also go with Yokohamas for JDM cars but im in living in pothole heaven so im afraid the Hard sidewall of the Yoko's won't last much. Thanks again!
Regarding potholes, a harder sidewall should do a little better as it will be more resistant to pinch flats. Obviously this transfers impact up into your wheel / suspension.
I promise, it's my last question regarding my topic. Currently i have a 18" 255/285 setup on my C218 CLS, S1Evo3 all around. Fine tyre, but the steering is dead, i hate it. And the back is wobbly as well, makes me unconfident. And the comfort level is not that good... So my new setup is 18" 245/275 . Option A: Assy6 on front and PS4 or PS4s on back (no assy6 in this size) Option B: PS4s all around (ps4 has crap steering as well AFAIK)
What do you suggest? I want a fine tyre which is a bit less noisy, and more enjoyable to drive than S1Evo3. Option A or B? If option A, which tyre to put in rear? And regarding PS4 and PS4s. Is the PS4s louder, firmer, etc? or its just better all around?
It´s great you give the Yokohama a change, Yokohama is still not made for the wet but they had/have tyres which gives you much fun on dry and hot days.
The mention of (no) RPB is also nice but I hope next time you show more detailed pictures and maybe a measure of the width.
The tyres I miss are the Pirelli PZ4 (real Premium tyre) and the new Toyo Proxes Sport 2. The Hankook is no new tyre and reviewed to often IMHO.
I wanted PZ4 but there is a big update coming to it soon so didn't seem worth testing. The Toyo has been tested 3 times now and doesn't seem that special sadly - https://www.tyrereviews.com...
Toyo isn´t great overall, true, but the AutoBild Sportscar magazine list them on wet handling in front of Conti SC7 and in wet circle on 3rd place. This is very good for Toyo, maybe one of the best results in almost 20 years. I don´t think he will overall a top competitor but maybe good for the price.
Oh, the PZ4 gets renewed, that´s nice. I remember some Pirelli tyres made a bit jump up after a "facelift"
I would say that's more down to the Conti being out of position than the Toyo having jumped the SC7 in the wet (wet braking confirms this) but I do agree it seems to be a good step forward. I miss the days when the T1R used to rule the roost. And the FK452!
I´m not sure if you also remember the Toyo 600F1 (which was often to see on BMW 3-series in old days even if a review mentioned that this tyre is a bit critical on RWDs), the Roadpro R610 (test winner) and Snowprox S940 (best value for price).
In my archive the oldest tyre test is from 1992, I would say the tyres in the 90s looks much better than most actual tyres.
Never had the FK452 (found some reviews from 2006, wet brake was not good) but the ZE-502. In dry conditions almost Yokohama-like but in the wet mediocre and very noisy
Wow, that's some archive! I started driving in 2002 I Think so my tyre knowledge goes from there. My first set was the Michelin Pilot Sport. My first love was the Bridgestone Potenza S02.
That only means I´m old ;). BTW, I saw I have also tests from 1991. But from years before 2000 I have some single magazines digitzed which don´t exist anymore (MOT, Rallye Racing).
My first tyres (which was fit on the car as I bought it) where Michelin XZX which also works on snow, at least with that car. My first new tyres were Hankook in 1991, sold to me as All Season Tyres, but Hankook told me they sold no AS-tyres in Europe so long ago :\ . Sadly I have no photo, the only thing I remember is that these tyres were similar to the 1st Goodyear Vector. But oldest review I found have the Vector 2 which was very different from Vector 1.
My 1st love was Semperit Top Speed (very grippy tyre, only the mileage was bad), on my next car it was the Firestone SZ40
Now both companies have no interesting summer tyre, Firestone is general uninteresting, Semperit have sometimes still good winter tyres.
Lets face it, we're both old ?? I'd love to see some of those tests / share them on social media if you don't mind sharing them? You can email me at [email protected] or ping me on any social channel.
Hankook is a superb deal for it's price, I think its great for its price. Im only switching from it because the steering-feedback is too lazy for my taste, and a lil bit noisy in huge sizes (285). But other than that, its kind of half price than another UUHP, Always good to have it in a test. :)
Maybe the Bridgestone is nearly an UUHP, but not official.
I don´t doubt that Hankook is good for the price, but the S1 EVo³ is more a Touring Tyre and not an UHP. 2nd thing I don´t like about Hankook is the missing RPB.
I was leaning towards the continental but with that wear rate and a price difference of 40 euros for a set of 4 right now, guess the Michelin ps5 is back on the table.
It is a pity that the Falken FK520 tire was missing from the test. I am very curious about your opinion on this tire. Nevertheless, great job with this test.
I have seen. I also have these Falken tires on my car and am very satisfied with their performance. :) I'm just curious how they would perform in your test, as I think they are the most detailed and objective. Although my guess is that they would probably perform at the level of Hankook Ventus S1 evo3 or minimally behind them.
Can we maybe picking top 3 from each categories and have a head to head fight, could be interesting to the comfort of a UUHP tyres vs sportiness of a touring one when they are the best from their cat
Great test! And a real added value that you also share your personal opinion about the tyres. Thanks.
Just a question: In the 2023 AutoBild UHP Summer Tyre Test, the predicted mileage of the tyres is about the double of the results in this test. What could explain this difference?
Great question. I can't speak with any accuracy as I've never done a drum test like theirs was, but from what I understand when you do a drum test you don't have a real baseline to set as the 100% so they have to guess it and then work backwards. It seems like they were optimistic in the guess. Or perhaps they were predicting highway miles only and the Dekra test covered every type of driving style.
Very! Very grateful for your hard work. No one does this kind of job. But it is really important to know the tyres, and find the best fitting for our needs. Without you it is kind of impossible. :) (for me, it seems Assy6 is the way since I'm looking for a smooth touring tyre with sharp steering-feel and awesome dry grip, after the wobbly EVO3) Only one open question. Can the SportContact 7 beat the Assy6 on steering feel, sportiness feel? :D
they remind me of a good trekking boot: the right amount of damping, very good feeling for the surface, while beeing relatively light and comfortable, they offer lots of grip and every step feels safely planted.
Before the Goodyear I had the Michelin Pilot supersport, then the PS 4. The Michelins have a strong connection to the road surface, whereas the Eagle F1 in comparison feels a bit more connected to the car. Very good feeling, responsive, easy and uncomplicated, no matter if its hot or cold, rainy or dry. And there is always more than enough grip and precision.
Because you like the premiumcontact 6, I was waiting for this test, how the pc7 compares to the Asy6. Thank you for that, the Asy6 is my winner.
Hi, many thanks from my side on the incredible testing you always do and the way you report it is very nice, interesting and entertaining all at the same time. For my Mk7 GTE with a stage1 tune and 18inch Fuchs Belvedere wheels I am debating between the Asy6 and the SC7 as well. Wondering how you will compare these 2 tires against each other. For my car, which tyre/side wall will handle the extra weight of the batteries in the car better you think?


Would michelin pilot sport 5 be an overkill for a 95bhp 125nm small hatchback weighting 1ton? I see they offer them in 205/45r16 dimension. I was thinking of getting them, but I am skeptical because of high price and my low power/low weight car.
Any suggestions?
I don't think so. You might not trouble them with acceleration but you can easily reach max grip in cornering and braking. They'll possibly last forever on your car too.
Would they have trouble reaching operating temperature in a lightweight and underpowered car like mine? Tyre dimensions are 205-45-r16-87w- and car is ~1050kg/95bhp fwd.
They should not
Thanks for the reply, I ordered yokohama advan fleva v701 after all. They cost me about 400€, while ps5 were 570€. I will put them on this Tuesday most probably. I will write a review about my current Bridgestone Turanzas t005 soon. (105k kms on those!)
Thanks for the review and wow that's a lot of miles!
Hi. Really nice test - as always. When I drive BMW iX3 with Yokohama Advan Sport 107 (BMW OE) with tire sizes 245/45/20 front and 275/40/20 rear, how will the Yokohama compare to the others in the same tire size, if available, because I have the impression they are not made in these tire sizes? I think my Yokohama can seem stiff/hard in some situations, but it is very quiet even with a 275 rear tire (I come from Mercedes E220d with 245/45/18). Do you have an advice to me: All tires will definitely cover my needs, but which is best specifically on comfort: how stiff/hard/potholes and how noisy is it inside the car itself, which is an electric car that is quiet in the cabin? Thank you in advance.
As that is an OE tuned tire I don't know what they've done with the comfort of it. Traditoinally the 107 is not the most comfortable of the segment.
Thank you for your answer. Then we are almost in agreement I think, regarding the 107's stiffness and comfort. The BMW iX3 was always delivered with either Bridgestone Alenza BMW OE or the Yokohama. With your knowledge of Bridgestone, would you say the Alenza is more comfortable?
I've never driven on an alenza, but I believe that's their touring range.
The Yokohama Advan Sport V107 is called the trackmaster. I'm looking for a tyre to use on my BMW125i Coupe, I will use the car on track most of the time just to have fun. So direct steeringfeel is very important.
Would the V107 be a better choice then the Advan Neova AD08 RS or the Bridgestone Potenza Sport?
Probably not better than AD08, though I've never tried it. Definitely better than Potenza Sport as that melts on track.
Thanks for your reply. I think the AD08RS is not as good as the older AD08 which is not been sold in the Netherlands anymore. I also saw your test "2022 Tyre Reviews UUHP Summer Tyre Test" where the Goodyear Eagle F1 SuperSport comes out as the Trackmaster. It seems this ones suits me even better in my search for the best Road Legal track tire for my BMW 125i coupe, do you agree with that or can I better save some money and buy the Yoko'hama V107 ?
I've not tested them back to back so I can't comment with any real certainty. If there was a big price difference I would go with the cheaper, if there was no price difference I would go with the goodyear.
Thank you for your quick reply! Your advice is very helpful and I will definitely take it into my final decision. I will let you know what it turned out to be.
I finally bought and mounted the V107, made my first ride today and my first impression is very good on wet and dry.
Tomorrow I'm going to a track day at the Zandvoort GP circuit.
What do you guys recommend as tyre pressure? Outside temperature is about 15 degrees and it promises to be a dry day. I read many different stories ranging from the recommended tyre pressure for street use to 0.5 bar higher or lower.
Glad you like them, let me know how they do on the track day.
Pressure is a tricky one. Assuming your car has stock suspension I would suggest aiming for sticker HOT. Go out a few PSI under sticker, warm up, do a few laps then come in and reset them.
If your car has a high sticker pressure for rolling resistance reasons, you can go under.
Not sure how this will sound but I currently have an Audi a5 b9.5 and it has the OE Bridgestone potenza s005 which I don't think are very great, im torn between the Michelin PS5 and Eagle f1 Asym 6, sure the Goodyear is cheaper and arguably slightly better but what is swaying me is that the Michelin is just such an attractive tyre compared to the completely dull asym 6, would you say this is stupid and the asym 6 would be the logical choice because im finding it so hard to decide because of all the factors, I also had the ps5 on a ford fiesta and they were superb but ofc now it'll be a completely different size and car.
??? I think I say in a few videos the size wall is enough to win some people over.
Both great tyres, I think the goodyear is slightly better value however if you want that Michelin sidewall no one will blame you.
Hello I have a Mercedes a class w176
A200d 4matic
Amg Line
225/40 r18
I was undecided between Michelin Conti and Goodyear
But I avoided Michelin because you rated 98 on comfort
My car is so stiff I live in Sicily with a lot of photoles
So I purchased continental because is the last product on the market
So you think are more comfortable pc7 or as6?
And yeah I purchased pc7 because they are the winner
Than I read Goodyear are subj winner .. ???
Next time maybe ahah
The comfort differences between the two are very close, the pc7 is a comfortable tyre so you should enjoy your new purchase :)
But for my car what tire would you choose?
I've never driven your car so I don't know, sorry.
Fair enough
Thank you so much for your responses ??
Btw yeah for comfort for sure
As6 or pc7
I also read other comments it’s really difficult choose between the two
Pc7 are more new in the market
Here is why I choose them
I will give you my experience after 1000km ??
Hi Emanuele
You did the right thing by buying Continental tyres. I used Goodyear Eagle F1s before, they are too soft. Damaged a wheel thanks to a pothole. Bought Continentals for winter (winter tyres are softer than summer tyres) and have no problem at all with potholes. https://uploads.disquscdn.c...
Sorry about the wheel. What about other aspects of Goodyear? Steering feel and precision on highway? From the test it looks the best for everyday sporty driving...
Thank you, I appreciate it ? Went thru 3 storms and never had a problem with aquaplaning. They were very suitable for high speed driving (drove a lot of German highways). About steering feel, don't know what to say since everybody has different expectations but I just couldn't click with them. Now I have Continentals and can corner faster than I did with Goodyears, and I feel like they are more responsive (AWD car on drift mode). Hope it helps, finding the right tyre is challenging ?
Yeah, tyres... Even the same tyre feels different on different car or/and size... I have Pilot Sport 4 and corners are very fast, good tyre in all aspects, but I dont feel anything at higher speeds, like am just playing computer game with keyboard. Since I am not racing anyone except me, I would like to have more joy from driving.
You talking about winter Continentals? They are better then super duper summer Goodyear? Particularly recommended in this test for GTI ;) Oh man, I need to start from scratch my search!
Haha yes, GTI, we traded ours in last year ? Had chance to drive it with Goodyear Eagle F1, Continental summer and winter tyres on. Goodyears were nowhere next to being super duper especially when accelerating or cornering. When they were on, I was constantly battling with electronic differential lock. I wonder if the test results of Goodyear is very good since they had 225/40 R18 and I had 235/35 R19. I know what you mean about Pilot Sports, was many times in a car with them on and it felt boring. They are very track oriented just like their racing counterparts. Good luck with your search ?
Hi, I am looking for a tyre for M2 F87. The PS5 and Asymmetric 6 are not available in M2 sizes, so I was thinking of trying the Hankook S1 EVO 3? I like the comfort aspect of it, but not sure if it is too soft for a car like M2. Should I just go for the PS 4S for double the price? Or any other suggestions would be much appreciated. Currently on Dunlop SportMaxx RT2, good dry grip, but it feel quite harsh on the road, so am looking for something softer.
Thanks!
SportContact 7 is the default choice for the m2, but will be expensive. The hankook is a fine choice at half the price.
Thanks! I will go with the SC7, price is in the middle between PS 4S and the S1 EVO3.
let us know how you find them
Hi,
Firstly many thanks for your hard work! Keep things going!
Looking for the set of summer tyres for 2019 Skoda Superb 2.0 TDI 190HP in 235/40/19 size.
What would be your suggestion choosing from below?
1. GY F1 ASSY 6
2. Conti Sport Contact 7
3. Michelin Pilot Sport 5
What is your personal ranking basing on your own experience?
Thx in adv.
I've not driven a Superb but I'm a big fan of the Asymmetric 6 on VAG products as it's usually better prices than the other two.
Is the Bridgestone Potenza sport the same tire as the Bridgestone Potenza S005 over in the European market? I cannot find any information about this tire which is currently on my car. I have my own opinion of it which is not that great, but I’m conscious to find out other people’s perception of it?
No, the S005 is a different product. I think it was mostly OE only, never really made in a lot of sizes which is why there's limited information on it. I think the closest tyre would be the S001
I thought I'd replied to this somewhere. No, the s005 was likely a low size model for OE, like the S007. The Potenza Sport officially replaced the S001. The S005 might have elements of the Potenza sport in but i'm fairly sure they are not the same tyre with differing names.
My daily driver is a BMW E90 330i (with an aftermarket Torsen differential). Tyre size: 225/45/17. I'm living in Bordeaux, south west of France, so mainly dry and warm conditions.
My last 2 sets of tyres have been Michelin PS4. Excellent : very good grip and treadlife (40000km/set). However, subjectively, I find their reactions quite sharp at the limit: feeling like losing and recovering grip is quite ON/OFF. Not easy to play with the oversteer.
My tyres are worn, I need to change them. The Michelin PS5 would be the "natural" choice, but I guess they will have similar handling/reactions as the PS4 ?
I would like to consider a more progressive / predictable tyre.
I have thought about trying the Michelin Primacy 4+. Less sporty, but maybe be funny to drive on my car ?
A friend who sells tyres also recommended me the Goodyear Assymetric 6 as good compromise between tyre response and progressivity.
Would you have any recommendation between these choices ? or other recommendations ?
Thanks
Are they runflats? Generally the PS4/5 is one of the less reactive uhp summer tyres so if you find it too much moving to something like the Primacy range would be the logical step.
Thanks for your answer.
My PS4 aren't runflats, I removed the runflats (bridgestone) very soon after buying this car.
To be a bit more accurate on my question: no problem with the front end, the steering response is fine, but when oversteering/sliding the car, I feel the rear end looses and recovers the grip abruptly.
My former M3 E36 3.2 was much more progressive and easy to control. (it had new Dunlop Sport Maxx, this was in 2010).
Both cars have a well balanced 50/50 front/rear weight distribution. I'm wondering if the difference of handling between both may be mainly caused by the different nature of the limited slip differential (discs on the M3 VS torsen on my 330i), maybe the way the Torsen transfers the torque to the outside wheel creates these reactions. Or if it's just the difference of chassis between the 2 generations of cars. If you have any opinion on this, I'd be glad to read it.
I own a Puma 2019 215/50/19 and I'm so confused choosing between PremiumContact 7 and F1 Asymmetric 6
Which one you thing would be the best pick?
I'd have the Goodyear
One thing I find a bit odd is that the conti premium contact 7 has come first in the tyre reviews UHP test AND premium touring tyre test. @TyreReviews:disqus - does this mean that the CP7 is the best regardless of whether one wants to prioritise comfort or sportiness (without considering UUHP segment)? I would have thought a tyre needs to trade off between these two characteristics?
I think what it probably means is that in the larger wheel sizes the PC7 is closer to the SC7, but in the smaller wheel sizes it's more comfort bias
That’s interesting that relative characteristics can change between sizes
Genuinely struggling to find a replacement tyre for my Mazda MX5 ND2. So many of the performance tyre options exclude 17 inch rims. My tyres are 205/45 17 and would prefer to keep this size but could consider 215/45 17 for my 7.0 width rims.
I was keen on the Conti Extreme Contact Sport 02, but they don’t supply them in Australia. Here we get the Conti Max Control 7 which has the same tread pattern as the ECS, but a different compound and construction. There are very few independent, knowledgeable reviews of the MC7, so I’m wary of assuming they’re as good as the ECS.
My primary aim for the tyres is to provide enjoyment during spirited road driving.
Any suggestions would be greatly appreciated.
I should note that the Michelin Pilot Sport Cup 2 comes in the required size. Is this tyre too track focused for spirited road use?
If you're just having fun on the road and not planning on being out in cold wet conditions, it's a very run road tyre
I am looking for a new set of tyres for my 2019 Alpina B5 biturbo touring. The Alpina comes with Alpina spec Pirelli pzero’s.
https://www.pirelli.com/global/en-ww/road/cars/tyres/the-art-of-perfect-fit-51038/
I am now on the second set and want to try something else because I am not entirely satisfied with the Pirelli’s. The alpina is a powerful heavy car. It is often described as the ultimate autobahn cruiser (I am in fact spending quite some time at 230 km/h cruising speeds on the German autobahn)
But I also do appreciate dynamic steering behaviour.
I am deciding now between conti sportcontact 7, Michelin pilot sport 5, or the Michelin pilot sport 4s. The Goodyear Eagle F1 Asymmetric 6 is not available in my size otherwise I would have considered that as well. I can also wait a bit longer for the pilot sport 5s to come out for non oem. Or wait for the new Pzero to come out. (I have about 6000km of tread life left on the Pirelli’s)
255/35 ZR20 on the front axle and 285/30 ZR20 on the rear
SC7 is the best of the three you listed.
My experience with the Asymmetric 6 after approximately 6 months driving is that it’s a good tyre on the road, predictable and grippy. It’s not a good choice if you want to do the occasional track day. In a GTi on a relatively cool day (18 Celsius) they looked shredded from the first 12 minute run on track, and overheated noticeably after a few fast laps, I regretted taking them that day.
Yikes, they usually do ok compared to most tyres in that category too!
I've got a pair of Goodyer Eagle F1 Asymetric 6 on my Peugeot 207 (same category as you)
They grip a lot on both dry and wet (I can't manage to make to tire scream during corners if I don't jam the throttle like a noob)
But their wear isn't that good :/
When I go for a more spirited drive I can see the same stuff you described on my tires :/
Plus, after about 8 000km, the tire has about 2 000 to 5 000km of remaining life. My car and driving style plays a lot for this (207 RC is known to eat through tires !) but still I would have expected a lifetime of about 20 000km :)
I've been offered Conti SC7 - they didn't have PC7, GY AS6 or Michelin PS5 available.
My preference are the AS6 for my 440i.
Is the SC7 more of a compromise?
I'd say it would be slightly better grip, sharper turn in but less wear and less comfortable and possibly a little more noise than either the PC7 or AS6. All four of those I'm considering getting when it's time for me to replace all four tyres probably around October on my mk7.5 golf GTi performance. I've been getting goodyear consistently for years and I do like them. My old car, now my wife's has Asymmetric 6 all round and they are good and seem to be wearing well. Although I felt the turn in was slightly sharper on the old asymmetric 5 and they lasted 20k (miles) on the front of a 2017 Seat Leon 1.4 tsi 150 excellence tech.
Well, I went for the SC7. Much better than the Bridgestone S001 RFT, less bump and thump over ridges and imperfections. More comfortable.
Steering is about the same. They feel like Michelin PSS to me, perhaps quieter, but difficult to tell on different cars. Seem good in the wet and dry.
No regrets so far, but still think GY AS6 or Continental PC7 would've been better suited to my 440i.
No, it's a great tyre
I'm between the Pilot Sport 5 and Asymmetric 6 for a Tesla Model 3, what would you recommend?
If the Goodyear is cheaper, it's a no brainer. If they're the same price, the sidewall on the PS5 sure is nice.
I bought the GY Asymetric 6 and have done some road trips now. 205/45 17.
I am totally happy with my choice. The tyres feel very reassuring in dry conditions and heavy rain, have lots of feeling and grip.
Glad you're enjoying them!
I have run the Hankook Ventus evo 2 and evo 3 over the last few seasons of track days here in Illinois, and they are incredible value for money. The evo 3 seems to have overcorrected some complaints with the evo 2 by improving comfort at the expense of on-center wandering and initial turn-in vagueness but you quickly (and I mean quickly) get used to it on a track. Interestingly they don't seem to be any more vague on a hot track than a cooler one, consistency indicating quite a bit of silica and good belt and block engineering. Considering the durability, predictability and dry traction for the money, its financially reckless not to consider at least trying these tires on a daily driver or track car because they offer a dual personality few ultra high performance tires can. While the evo 2 is a slightly better track tire, the evo 3 is an overall better tire that sacrifices very little.
How's the wear on track when they get really hot?
Hi, I need to replace the old Bridgestone on my DB7 Vantage (original AM choice).
I am tempted by the Eagle Asymetric 6 (245/40 and 265/35 18").
Do you think that'd be a good choice? I think the Eagles look similar but superior to the Potenzas?
I notice you refer to the Asymetric 5 as a gem! I can still get them here in France - better than the 6?
Not better, but if they're cheaper then that could be a win
So after 20 years of getting GY's (loved most of them), Continental (loved all of them), Pirelli (hated most of them) and Bridgestone hated all of them, I got first time ever Michelin PS5 2 years ago on my 4 series coupe Bmw, they're 225/45/18 size. After that I was so amazed by Michelin that I changed to them on all of my cars including 911 997 and as long as they make them this good I'll keep buying them. The wear is amazing and like they told me in the tire shop that they will stay the same all their life. So after 60k km, yes 60k km they were done and just today I put a set of new ones. The GY and Continental always performed well at the beginning but after half of the life it would go significantly down. This performed 50% better than ever before. Yes compared to OEM Pirelli Cinturato P7 run flats the car was equipped from new there is a hint of less steering precision but my God have well they keep corners at Dolomiti mountain roads both in wet and dry and all the way at 50k km. I was so blown away by them that I got for the same car Alpine 5 winter tires and was amazed as well.
60k! That's impressive!
A bit of an apples to oranges comparison but still, per Jonathan old reviews of contis pc6 I bought them to replace my worn eagle 5s in 245/45 r18 size, and was unpleasantly surprised by their lack of sportinnes and steering feel as he always underlined how very sporty they feel compared to it's competitors. They actually feel very touring like, being pretty soft and noticeably more quiet than eagles, but very much feeling mushy in steering response. Goes to show how different tires can be depending on their sizes.
Sorry it didn't work out, I've not tested that size so it's interesting feedback. Generally there aren't huge differences between sizes, especially if you're matching load ratings when swapping tyres, but the Asymmetric 5 is a gem.
That said, I had asymmetric 5 and PC6 in 225/40 R18 on my personal vehicle, and I kept the Contis as I prefered the handling.
So, on the back of Jonathan's excellent and detailed reviews we have now put Continental PremiumContact 7 tyres (235/35 R19) on our Audi S3. Replacing some old Goodyear tyres. The difference is Night and Day - the car feels more planted, you feel more connected to the road and the handling in both wet and dry is superb. Breaking is exceptionally good and I highly recommend making the switch to the CPC7
Kudos Jonathan and many thanks!
Glad you like them :) If you get some time please leave a review on the site
How would Yokohama Advan Sport V107 compare to Goodyear Eagle F1 SuperSport in terms of dry handling (both subjective and actual performance)?
I've not directly compared them so it would be a guess, I think they would be close, perhaps the Yokohama a small edge in dry.
I've been following this site for years and this'll be my first comment ever.
My car is BMW 3.20D (F30) and I'm using 225/45/17 size.
Tests here helped me a lot deciding a tire set.
Last tires I bought was Hankook Ventus Prime 4 and it's time to replace them.
Hankook did good but i want to give a chance to others and still couldn't decide between Continental PremiumContact 7 and Goodyear Eagle F1 Asymmetric 6. Michelin tires' life is no good, that's why it's not an option.
I'm not using the car up to the limits all the time, but sometimes yeah it feels good to hit the throttle a bit
Especially at the turns/corners I really like to do the max I can, and see the car keeping its line.
City I live at is a summer city and so hot and humidity is so high, plus the roads are eehhh.
A little help, an idea or an opinion would really help me to choose the next tire set.
conti or goody??..or any other ?.
I wish I could help, but I like both the tyres equally! If there's a cost saving with one set that would swing the decision for me.
Thanks for the reply. Well if you said so, looks like I'll go to the cheaper
First of all, great test and thanks for the detailed information and comparison!
I've been following your tests for years. In 2021, I bought a 2018 Volvo S60 T3 (152 hp FWD) and after reviewing your test results, i bought Michelin Pilot Sport 4. I had great experience with them, no complains overall except they wore down pretty fast.
It is time to get a new set of summer tyres. Since my volvo is a heavy car and I like to push it to its limits, I think another UHP summer tire is the one to get. My first question is, am I buying more capable tyres than my car (note: in the long distance travels, I usually drive around 200 kmh speed). If so, for sporty (good handling but not for track use) but safe driving what would you recommend as summer tyre?
If you think UHP is the way to go, I'm between Michelin PS5 and Continental PC7. I wonder what you recommend for my car?
Thanks in advance.
Why is the asymmetric 6 not in your short list?
I looked for the asymmetric 6 also, but after a quick search I'm not sure if there is any asymmetric 6 for my tyre size which is 215/50r17, at least in my region.
Would you recommend the asymmetric 6 over Michelin PS5 and Continental PC7?
This is a great review.
I am still having trouble choosing my next summer tyres.
I've had default Pirelli P Zero's (which for some reason are not included in the test?) on my hothatch so far, and they seemed pretty good, but I was wondering if I can get something purely grip oriented because those Pirrelis are done.
I don't care about the noise or fuel economy, I do less than 10 000 km per year, so I am also not looking for a particulary long lasting tyre. I was curious to know what would be the best summer tyre, oriented for dry conditions sports performance. Seems I should go with Yokohamas, but I am slightly biased against this brand... Any advice?
If you don't care about mileage, Potenza Sport
But what about Sport Contact 7 on a hot hatch?
It's about the same price as Potenza Sport.
Also a very good tire.
Thanks for doing the internal cabin noise testing. It's a measurement that few tyre reviews seem to include, but I feel it is very important in choosing the right tyre.
I know there was only 1 decibel between the tyres, but as decibels is a logarithmic scale, this is still significant.
Pitch is just as importnat, which is why I've tried to get better at subjective noise. There's been times where a 70db internal tyre has a high pitch and is really annoying, and a 71db tyre has a low pitch which is way nicer to live with. Obviously low DB and nice noise is the holy grail.
Hi there,
Quick questions
Currently have the S1 Evo 3 all round (255/35 20 front and 275/35/20 rear) on my S-class (v8 twin turbo S500). They’re okay but not tried any other tyres on this vehicle and I find them a little rough riding and loud. Both fronts are relatively new but rears are up for replacement. Should I go with the same or Pilot Sport 4S or Eagle F1 Asy 6? Wear not a priority, just handling and comfort. If no difference likely to be noticeable I will stick with the Evo3 as that way they will match front and rear.
Thanks!
I've run the Evo 3 in a non-staggered front\rear and notice the rears wear quicker than the front as well. At least they're (really) cheap. But it's surprising you find them riding rough and loud. I think they are among the best daily driver UHP summer tires I've owned, especially compared to the ContiExtremeContact DW's and Goodyear F1's, both tires I'll never run again on a car I drive on the street. Unfortunately the ExtremeContact are not in this review, and it seems the new Conti's are greatly improved. The ExtremeContact DW was outclassed by the DWS06 back in the day anyway, a tire that offered nearly the performance of the DW with superior comfort, four-season drivability, double the treadwear and a lower price.
So I'm after some advice on UUP tyre choice. I have an Audi A5. Its been modified some so now running 350bhp, It's also FWD.
I have 20 inch wheels on and want to know what's the recommendation for fast road and occasional track use please. Thanks.
Hey!
Finally my staggered CLS setup is done. I thought it is fair to share my experience. I had S1EVO3 all around 255front, 285 rear.
It grips like hell and wonderful in rain, but hated it because the steeringwhhel is laggy, lazy, dull. And the back of the car feels loosen and wobble at hard cornering. I made a decision to replace them right away, and a lil bit narrower ones since they will be better in every aspect.
I chose Asy6 for fronts in 245. They are mindblowing! Much more comfy, even with a slight decrease in sidewall thickness. The difference is surprisingly big. Asy makes the road much muhc smoother. Huge plots felt significantly less. The noise is also a bit less. And, a huge AND, the steeringwheel reaction is day and night much better. Still not a tracktire, but awesome for road spirited drive. My mind is blown, that Asy6 is more comf and also sharper...most of the cases is a choose between those....and the S1EVO3 is a good tire, but still destroyed.
I chose PS4 for the rears in 275. Wanted the PS4S but it is not available anymore. And there is no other fine tire available in 275/35r18. The PS4 surprised me, since the sidewall is pretty stiff. The wobbly losen and is gone, the car is very very confident in the corners, finally I am confident and not terrified that rear grip is lost.
It is a bit quieter (expected even more since there is 4dB difference, but maybe needs some more miles to blend in) and everything is more or less the same. so in conclusion, the PS4 is not a dull tourer tire, it is advised to buy for a sporty but not uncomfortable tire. basically it delivers the same comf, grip, etc as the S1EVO3, but with perfect precision and sidewall-stability (which is dealbreaker) and more silence, and a supersexy sidewall. :D The dry and wet grip is not tested yet to the limits...both are perfect.
Summary: S1EVO3 is not really ideal in wide sizes, Asy6 is magic, PS4 is not a lazy tourer tire, be brave to use it for road-spirited usage.
AND: This setup is a very well balanced combination, love it. IMO the only diff with asy6 all aorund would be a very minor extra addition in comfort, noise comfort.
Mate , with 285 rear you can easily down 400bhp and around 800 nm . . . what kind of engine is on you CLS - W12 ?
I'm curious about the wear vs abrasion results for the Bridgestone as it placed on the opposite ends of the scale (6th & 2nd respectively). From what I've gather from reading this article, both tests use tread depth loss as a key parameter and therefore expect similar comparative resultsl. All the other tyres had very similar wear vs abrasion rankings, any ideas why the Bridgestones ranks poorly for wear yet performed well for abrasion?
Wear is tread depth loss, abrasion is total compound lost. If a tyre with a good wearing compound starts with a smaller amount of compound on the tyre, it will have a lower predicted mileage but better abrasion results. This is usually Michelins trick, apparently they balance it better than Bridgestone does currently.
Amazing test and channel, so much passion as well ! Thank you !
I don't see any info regarding fuel consumption of each tyre especially in regards to the fuel cost nowadays (unless I'm not interpreting some values properly, in that case that would be great to know). I've also didn't find information about rim protection as it's a disaster with my current MPS3 monted on Mazda3 18" rims navigating between parisian sidewalks ;)
Could you advise on these two points between CPC7 VS MPS5 please ?
Rolling resistance results are on the page which is the tyres direct affect on your fuel consumption. Rim protection is also listed under each tyre in the results.
Another amazing review that makes the maze of searching for tyres a lot easier to run through!
I've currently got an Evo 9 with stock rims ( 235/45/17) , the only size that the new PS5s don't support :(
Would you recommend the Conti or the Eagle F1 ? I've seen a lot of people also go with Yokohamas for JDM cars but im in living in pothole heaven so im afraid the Hard sidewall of the Yoko's won't last much.
Thanks again!
Asym 6 over the PC7 for an EVO
Regarding potholes, a harder sidewall should do a little better as it will be more resistant to pinch flats. Obviously this transfers impact up into your wheel / suspension.
I promise, it's my last question regarding my topic.
Currently i have a 18" 255/285 setup on my C218 CLS, S1Evo3 all around. Fine tyre, but the steering is dead, i hate it. And the back is wobbly as well, makes me unconfident. And the comfort level is not that good...
So my new setup is 18" 245/275 . Option A: Assy6 on front and PS4 or PS4s on back (no assy6 in this size)
Option B: PS4s all around (ps4 has crap steering as well AFAIK)
What do you suggest? I want a fine tyre which is a bit less noisy, and more enjoyable to drive than S1Evo3.
Option A or B?
If option A, which tyre to put in rear?
And regarding PS4 and PS4s. Is the PS4s louder, firmer, etc? or its just better all around?
Option a with PS4S all round?
Very nice tyre-review, big Thanks for it :)
It´s great you give the Yokohama a change, Yokohama is still not made for the wet but they had/have tyres which gives you much fun on dry and hot days.
The mention of (no) RPB is also nice but I hope next time you show more detailed pictures and maybe a measure of the width.
The tyres I miss are the Pirelli PZ4 (real Premium tyre) and the new Toyo Proxes Sport 2. The Hankook is no new tyre and reviewed to often IMHO.
Thanks :)
There's some more detailed content on instagram - https://www.instagram.com/t...
I wanted PZ4 but there is a big update coming to it soon so didn't seem worth testing. The Toyo has been tested 3 times now and doesn't seem that special sadly - https://www.tyrereviews.com...
Toyo isn´t great overall, true, but the AutoBild Sportscar magazine list them on wet handling in front of Conti SC7 and in wet circle on 3rd place. This is very good for Toyo, maybe one of the best results in almost 20 years. I don´t think he will overall a top competitor but maybe good for the price.
Oh, the PZ4 gets renewed, that´s nice. I remember some Pirelli tyres made a bit jump up after a "facelift"
I would say that's more down to the Conti being out of position than the Toyo having jumped the SC7 in the wet (wet braking confirms this) but I do agree it seems to be a good step forward. I miss the days when the T1R used to rule the roost. And the FK452!
I´m not sure if you also remember the Toyo 600F1 (which was often to see on BMW 3-series in old days even if a review mentioned that this tyre is a bit critical on RWDs), the Roadpro R610 (test winner) and Snowprox S940 (best value for price).
In my archive the oldest tyre test is from 1992, I would say the tyres in the 90s looks much better than most actual tyres.
Never had the FK452 (found some reviews from 2006, wet brake was not good) but the ZE-502. In dry conditions almost Yokohama-like but in the wet mediocre and very noisy
Wow, that's some archive! I started driving in 2002 I Think so my tyre knowledge goes from there. My first set was the Michelin Pilot Sport. My first love was the Bridgestone Potenza S02.
That only means I´m old ;). BTW, I saw I have also tests from 1991. But from years before 2000 I have some single magazines digitzed which don´t exist anymore (MOT, Rallye Racing).
My first tyres (which was fit on the car as I bought it) where Michelin XZX which also works on snow, at least with that car. My first new tyres were Hankook in 1991, sold to me as All Season Tyres, but Hankook told me they sold no AS-tyres in Europe so long ago :\ . Sadly I have no photo, the only thing I remember is that these tyres were similar to the 1st Goodyear Vector. But oldest review I found have the Vector 2 which was very different from Vector 1.
My 1st love was Semperit Top Speed (very grippy tyre, only the mileage was bad), on my next car it was the Firestone SZ40
Now both companies have no interesting summer tyre, Firestone is general uninteresting, Semperit have sometimes still good winter tyres.
Lets face it, we're both old ?? I'd love to see some of those tests / share them on social media if you don't mind sharing them? You can email me at [email protected] or ping me on any social channel.
I can email you if you can read german reviews ;)
I´m not on social media, too old for it :o
Ich kann! Mein Deutsch ist ziemlich nutzlos, aber Google Translate ist sehr hilfreich :)
Hankook is a superb deal for it's price, I think its great for its price. Im only switching from it because the steering-feedback is too lazy for my taste, and a lil bit noisy in huge sizes (285). But other than that, its kind of half price than another UUHP, Always good to have it in a test. :)
This Hankook is no UUHP IMHO :)
Maybe the Bridgestone is nearly an UUHP, but not official.
I don´t doubt that Hankook is good for the price, but the S1 EVo³ is more a Touring Tyre and not an UHP. 2nd thing I don´t like about Hankook is the missing RPB.
That lines up with the test findings :)
Ah, the test I've been waiting for!
I was leaning towards the continental but with that wear rate and a price difference of 40 euros for a set of 4 right now, guess the Michelin ps5 is back on the table.
Plus, that sidewall ?
Well, changed over to the ps5 from the 3, after about 100km, subjectively more comfortable (ride and noise) vs the ps3. Phew.
Also, dat sidewall.
Aiii, missing a photo here. https://uploads.disquscdn.c...
Pretty difficult to beat ?
No love for P Zero?
https://uploads.disquscdn.c...
It is a pity that the Falken FK520 tire was missing from the test. I am very curious about your opinion on this tire. Nevertheless, great job with this test.
Have you seen the tests of it on this site already, they mostly seem to agree on its performance.
I have seen. I also have these Falken tires on my car and am very satisfied with their performance. :)
I'm just curious how they would perform in your test, as I think they are the most detailed and objective. Although my guess is that they would probably perform at the level of Hankook Ventus S1 evo3 or minimally behind them.
That's certainly what the data from other tests would imply but i'm keen to find out myself sometime!
Can we maybe picking top 3 from each categories and have a head to head fight, could be interesting to the comfort of a UUHP tyres vs sportiness of a touring one when they are the best from their cat
https://www.youtube.com/wat... and https://www.youtube.com/wat... might interest you
Great test! And a real added value that you also share your personal opinion about the tyres. Thanks.
Just a question: In the 2023 AutoBild UHP Summer Tyre Test, the predicted mileage of the tyres is about the double of the results in this test. What could explain this difference?
Great question. I can't speak with any accuracy as I've never done a drum test like theirs was, but from what I understand when you do a drum test you don't have a real baseline to set as the 100% so they have to guess it and then work backwards. It seems like they were optimistic in the guess. Or perhaps they were predicting highway miles only and the Dekra test covered every type of driving style.
Very! Very grateful for your hard work. No one does this kind of job. But it is really important to know the tyres, and find the best fitting for our needs. Without you it is kind of impossible. :)
(for me, it seems Assy6 is the way since I'm looking for a smooth touring tyre with sharp steering-feel and awesome dry grip, after the wobbly EVO3)
Only one open question. Can the SportContact 7 beat the Assy6 on steering feel, sportiness feel? :D
Thank you!
I've never had them in the same test but I believe the SC7 would have the edge in steering. At least it should!
The sport auto tyre test compares SC7 and Asy6.
The Asy6 will be my next tyre, I just waited for this tyre reviews test, now I am sure.
I really love my Asymmetric 5 , and the 6 should be a little more focused on dry conditions, which is fine.
Let me know how you like them!
they remind me of a good trekking boot:
the right amount of damping, very good feeling for the surface, while beeing relatively light and comfortable, they offer lots of grip and every step feels safely planted.
Before the Goodyear I had the Michelin Pilot supersport, then the PS 4.
The Michelins have a strong connection to the road surface, whereas the Eagle F1 in comparison feels a bit more connected to the car. Very good feeling, responsive, easy and uncomplicated, no matter if its hot or cold, rainy or dry. And there is always more than enough grip and precision.
Because you like the premiumcontact 6, I was waiting for this test, how the pc7 compares to the Asy6. Thank you for that, the Asy6 is my winner.
:)
I bought the Asy6 now and am very pleased with this tyre after ca. 3000km.
:D
Hi, many thanks from my side on the incredible testing you always do and the way you report it is very nice, interesting and entertaining all at the same time. For my Mk7 GTE with a stage1 tune and 18inch Fuchs Belvedere wheels I am debating between the Asy6 and the SC7 as well. Wondering how you will compare these 2 tires against each other. For my car, which tyre/side wall will handle the extra weight of the batteries in the car better you think?
They're both so good, I'm not sure what I'd pick myself! Whatever is cheaper probably