




In this article we'll be finding out what the best cheap tyre on the market is!

Times are hard, and now more so than ever people are asking me what the best budget tyre they can buy is. As these have never been tested against each other properly, I usually don't have an answer, but all that is about to change!
Sadly I've not been able to test every budget available, there are literally hundreds of tyre brands coming out of the far east, most of them from just a handful of factories. In fact, I've got over 300 tyre brands on the tyre reviews website, and as much as I love big tests, even that's too much for me.
Instead, I've bought eight of the most common and cheapest tyres available I could find, and because I've never tested a retread tyre, I bought one of those too. Naturally they'll all be going through a full tyre reviews tyre test to see which is best.
Obviously, there's no point in seeing what's best if we have no reference point to know how best that is, so to see if any of them can match a premium tyre, I've have a benchmark tyre in the test. It's not going to be easy as it's the brand new, and already multiple test winning, Continental PremiumContact 7.
Can any of these eight cheap tyres get anywhere near one of the best tyres on the market in this segment?! Let's find out.
Test setup & methodology
The test setting, the conditions recorded and how the results contribute to the score.
Show full testing methodology
Recorded test conditions
- Dry Braking
- 100 → 5 km/h
- Wet Braking
- 80 → 5 km/h
Score Weighting
Weights express the scoring priorities, not how much each discipline actually changed the finishing order. The size of the performance gaps matters too. Category weights contribute to the overall score. Within each category, discipline weights divide that category’s share. Published finishing positions also need to be read alongside the editorial verdict.
| Test | Within category | Share of overall score |
|---|---|---|
| Dry · 35% | ||
| Dry Braking | 45% | 15.75% |
| Dry Handling | 45% | 15.75% |
| Subj. Dry Handling | 10% | 3.5% |
| Wet · 50% | ||
| Wet Braking | 40% | 20% |
| Wet Handling | 35% | 17.5% |
| Subj. Wet Handling | 10% | 5% |
| Wet Circle | 5% | 2.5% |
| Straight Aqua | 5% | 2.5% |
| Curved Aquaplaning | 5% | 2.5% |
| Comfort · 5% | ||
| Subj. Comfort | 50% | 2.5% |
| Noise | 50% | 2.5% |
| Value · 10% | ||
| Rolling Resistance | 100% | 10% |
Our standard methods
The conditions above are recorded for this test. The descriptions below explain our standard procedures; measurement windows and run counts can vary by test.
Dry Braking
For dry braking, I drive the test vehicle at an entry speed of 110 km/h and apply full braking effort to a standstill with ABS active on clean, dry asphalt. I typically use an 100–5 km/h measurement window. My standard programme is five runs per tyre set where possible, although the sequence can extend to as many as fifteen runs if conditions and tyre category justify it. I analyse the full set of runs and discard statistical outliers before averaging. Reference tyres are run repeatedly throughout the session to correct for changing conditions.
Dry Handling
For dry handling, I drive at the limit of adhesion around a dedicated handling circuit with ESC disabled where possible so I can assess the tyre's natural balance, transient response, and limit behaviour without electronic intervention masking the result. I usually complete between two and five timed laps per tyre set, depending on the circuit, tyre type, and consistency of conditions. I exclude laps affected by clear driver error or obvious environmental inconsistency. Control runs are carried out frequently throughout the session, and I often use multiple sets of control tyres so that wear on the references does not become a meaningful variable. For more track-focused products, I also do endurance testing, which is a set number of laps at race pace to determine tire wear patterns and heat resistance over longer driving.
Subj. Dry Handling
I also carry out a structured subjective handling assessment at the limit of adhesion on a dedicated dry handling circuit. I score steering precision, steering response, turn-in behaviour, mid-corner balance, corner-exit traction, breakaway characteristics, and overall confidence using a standardised 1–10 scale used consistently across my testing. The final assessment combines numeric scoring with written technical commentary. I complete familiarisation laps on the control tyre before evaluating each candidate.
Wet Braking
For wet braking, I drive the test vehicle at an entry speed of 88 km/h and apply full braking effort to a standstill with ABS active on an asphalt surface with a controlled water film. I typically use an 80–5 km/h measurement window to isolate tyre performance from variability in the initial brake application. My standard programme is eight runs per tyre set where possible, although the sequence can extend to as many as fifteen runs if conditions and tyre category justify it. I analyse the full set of runs and discard statistical outliers before averaging. To correct for changing conditions, I run reference tyres repeatedly throughout the session — in wet testing, typically every three candidate test sets.
Wet Handling
For wet handling, I drive at the limit of adhesion around a dedicated handling circuit. I generally use specialist wet circuits with kerb-watering systems designed to maintain a consistent surface condition. ESC is disabled where possible so I can assess the tyre's natural balance, transient response, and limit behaviour without electronic intervention masking the result. I usually complete between two and five timed laps per tyre set, depending on the circuit, tyre type, and consistency of conditions. I exclude laps affected by clear driver error or obvious environmental inconsistency. Control runs are carried out frequently throughout the session, and I often use multiple sets of control tyres so that wear on the references does not become a meaningful variable.
Subj. Wet Handling
I also carry out a structured subjective handling assessment at the limit of adhesion on a dedicated wet handling circuit. I score steering precision, steering response, turn-in behaviour, mid-corner balance, aquaplaning resistance, breakaway characteristics, and overall confidence using a standardised 1–10 scale used consistently across my testing. The final assessment combines numeric scoring with written technical commentary. I complete familiarisation laps on the control tyre before evaluating each candidate.
Wet Circle
For wet lateral grip testing, I use a circular track of fixed radius, typically between 30 and 50 metres, broadly aligned with ISO 4138 principles. The surface is wetted in a controlled and repeatable manner. I progressively increase speed until the maximum sustainable cornering speed is reached. I normally record multiple laps in both clockwise and counterclockwise directions to reduce the influence of camber, banking, or directional track bias. I then calculate average lateral acceleration and compare the result with the reference tyre.
Straight Aqua
To measure straight-line aquaplaning resistance, I drive one side of the vehicle through a water trough of controlled depth, typically around 7 mm, while the opposite side remains on dry pavement. I enter at a fixed speed and then accelerate progressively. I define aquaplaning onset as the point at which the wheel travelling through the water exceeds a specified slip threshold relative to the dry-side reference wheel. I usually perform four runs per tyre set and average the valid results.
Curved Aquaplaning
For curved aquaplaning, I use a circular track, typically around 100 metres in diameter, with a flooded arc of controlled water depth, usually about 7 mm. The vehicle is instrumented with GPS telemetry and a tri-axial accelerometer. I drive through the flooded section at progressively increasing speed, typically in 5 km/h increments, and record the minimum sustained lateral acceleration at each step. The test continues until lateral acceleration collapses, indicating complete aquaplaning. The result is expressed as remaining lateral acceleration in m/s² as speed rises.
Subj. Comfort
To assess comfort, I drive on a wide range of road surfaces (often dedicated comfort tracks at test facilities) at speeds from 50 to 120 km/h, including smooth motorway, coarse surfaces, expansion joints, broken pavement, and sharp-edged obstacles. I evaluate primary ride quality, secondary ride quality, impact harshness, seat-transmitted vibration, and the tyre's ability to absorb sharp inputs. Ratings are assigned on a 1–10 scale relative to the reference tyre.
Noise
I measure external pass-by noise in accordance with UNECE Regulation 117 and ISO 13325 using the coast-by method on a compliant test surface. Calibrated microphones are positioned beside the test lane, and the vehicle coasts through the measurement zone under controlled conditions. I record the maximum A-weighted sound pressure level in dB(A), complete multiple runs over the relevant speed range, and normalise the result to the reference speed required by the procedure.
Rolling Resistance
Rolling resistance is measured under controlled laboratory conditions in accordance with ISO 28580 and UNECE Regulation 117 Annex 6. The tyre is mounted on a test wheel and loaded against a large-diameter steel drum. After thermal stabilisation at the prescribed test speed, rolling resistance force is measured at the spindle and corrected according to the relevant procedure. The result is expressed as rolling resistance coefficient, typically in kg/tonne.
Wet
Naturally the premium tyre had a huge advantage in wet braking, stopping the Golf over 7 meters shorter from the 80 km/h than the best budget tyre, and over 14 meters shorter than the worst!
Wet Braking
Wet braking in meters (80 - 5 km/h)
Lower is better ↓| Position / Tyre | Result | Gap to best | Residual speed |
|---|---|---|---|
| 31.58 m | Best | 0 km/h | |
| 38.69 m | +7.11 m | 56 km/h | |
| 39.61 m | +8.03 m | 59 km/h | |
| 40.75 m | +9.17 m | 62 km/h | |
| 40.91 m | +9.33 m | 62 km/h | |
| 43.45 m | +11.87 m | 68 km/h | |
| 43.6 m | +12.02 m | 68 km/h | |
| 43.93 m | +12.35 m | 69 km/h | |
| 46.04 m | +14.46 m | 73 km/h |
The difference between best and worst was 45.8% (14.46 m ≈ 3.2 Car Lengths). From 130 km/h, the Double Coin DC99 would still be travelling at 73 km/h when the Continental PremiumContact 7 had stopped.
Residual speed is calculated from the measured braking distances, assuming constant deceleration; it is not a separate measurement.
Like in wet braking, the Continental was in a in a league of its own during the wet handling test, it's a brand new premium tyre and one of the best in its class in the wet, so that's no surprise.
The next best tyre was the Tomket, 4.4 seconds behind the Continental, but the worst budget tyre, which was the Doublecoin, was another 7.1 seconds behind the tomket! The spread inside the cheap end of the market can be as big as it is between premium and budget tyres!
While the Tomket couldn't match the poise and balance of the Continental, it was pretty easy to drive, with nice steering, a good balance and predictable levels of grip. Predictability in tyre in the wet is underrated as people tend to focus on lap times, but having a well balanced tyre is a very important quality.
This was highlighted by the Nankang, which was almost as fast over the lap but wanted to oversteer you off the track at every opportunity. I've said it before about Nankang products, the grip levels aren't bad, and they certainly make for some entertaining tyres as track day tyres, but they need to work on the balance they give the vehicle.
Davanti, Winrun, Triangle and Maxtrex were the next group, all struggling to really communicate what was happening to the driver, they'd push into understeer quite quickly then you'd spend a lot of time off power waiting for the tyre to come back to you.
The retreaded King Meiler was next. This was my first experience with a retreaded tyre so I had no idea what to expect, and in the wet at least, it didn't feel any different to any of the other tyres at this end of the market.
And finally, the Doublecoin. Not only was it the slowest, but it was also the hardest to drive. I couldn't quite work out when or why or what caused the sudden oversteer, but there it was. It was the worst tyre in wet braking, wet handling, and straight and curved aquaplaning.
Wet Handling
Wet handling time in seconds
Lower is better ↓| Position / Tyre | Result | Gap to best |
|---|---|---|
| 84.85 s | Best | |
| 89.21 s | +4.36 s | |
| 89.36 s | +4.51 s | |
| 92.19 s | +7.34 s | |
| 92.25 s | +7.40 s | |
| 93.11 s | +8.26 s | |
| 93.93 s | +9.08 s | |
| 95.24 s | +10.39 s | |
| 96.27 s | +11.42 s |
The difference between best and worst was 13.5% (11.42 s).
Straight Aqua
Float Speed in Km/H
Higher is better ↑| Position / Tyre | Result | Gap to best |
|---|---|---|
| 74.91 km/h | Best | |
| 74.13 km/h | -0.78 km/h | |
| 70.98 km/h | -3.93 km/h | |
| 70.83 km/h | -4.08 km/h | |
| 70.52 km/h | -4.39 km/h | |
| 69.61 km/h | -5.30 km/h | |
| 69.51 km/h | -5.40 km/h | |
| 67.3 km/h | -7.61 km/h | |
| 64.55 km/h | -10.36 km/h |
The difference between best and worst was 13.8% (10.36 Km/H).
Dry
Dry conditions usually means much closer results than in the wet, and while dry braking was closer, there was still a significant gap between the Continental and the best budget tyre, which was once again the Tomket. The difference, around 7% or nearly a car length, means when you're stopped on the Continental you're "only" doing 26kmh on the tomket, and 34 km/h on the triangle! That would be an expensive crash.
Dry Braking
Dry braking in meters (100 - 5 km/h)
Lower is better ↓| Position / Tyre | Result | Gap to best | Residual speed |
|---|---|---|---|
| 35.27 m | Best | 0 km/h | |
| 37.83 m | +2.56 m | 34 km/h | |
| 38.45 m | +3.18 m | 37 km/h | |
| 39.08 m | +3.81 m | 41 km/h | |
| 39.32 m | +4.05 m | 42 km/h | |
| 39.41 m | +4.14 m | 42 km/h | |
| 39.48 m | +4.21 m | 42 km/h | |
| 39.62 m | +4.35 m | 43 km/h | |
| 40.01 m | +4.74 m | 45 km/h |
The difference between best and worst was 13.4% (4.74 m ≈ 1.1 Car Lengths). From 130 km/h, the Triangle SporteX TH201 would still be travelling at 45 km/h when the Continental PremiumContact 7 had stopped.
Residual speed is calculated from the measured braking distances, assuming constant deceleration; it is not a separate measurement.
The dry handling lap times were relatively close, but it's a short track and the VW Golf test vehicle doesn't have the most power, and while the Continental was the nicest to drive, there were also some good tyres in the group.
The Winrun was my favorite, it had good steering and stable handling making it easy to drive fast, helped by a little understeer. The Tomket was also nice during lane changes and the lap, the Nankang felt sporty for a 16" tyre with quick turn in, but once again the rear wasn't very stable meaning oversteer. Fun for a track, but perhaps not the best on the road.
As for the retreaded King Meiler, well that felt good in steering and balance, but the compound couldn't seem to keep up with the demands of the car meaning the lap time wasn't great.
The Doublecoin and Davanti were the slowest of the group, the Davanti steering felt fine sublimit and was noticeably more comfortable on the way to track than some of its competitors, but once going quickly there was little feedback and a lot of understeer, and finally the Doublecoin continued to be a really messy tyre, difficult to control and subjectively by far the worse of the group.
Dry Handling
Dry handling time in seconds
Lower is better ↓| Position / Tyre | Result | Gap to best |
|---|---|---|
| 51.73 s | Best | |
| 52.23 s | +0.50 s | |
| 52.78 s | +1.05 s | |
| 52.84 s | +1.11 s | |
| 52.85 s | +1.12 s | |
| 52.97 s | +1.24 s | |
| 53.21 s | +1.48 s | |
| 53.32 s | +1.59 s | |
| 53.39 s | +1.66 s |
The difference between best and worst was 3.2% (1.66 s).

Environment
Echoing my subjective experience, the Doublecoin and Davanti were the quietest during the passby noise test, with the premium Continental finishing midpack. While external noise does have an impact on the noise in the cabin, it is not a direct correlation as tyre manufacturers can direct the sound into the vehicle to achieve a slightly better external noise test, and this reading doesn't account for pitch.
Noise
External noise in dB
Lower is better ↓| Position / Tyre | Result | Gap to best |
|---|---|---|
| 70.2 dB | Best | |
| 70.3 dB | +0.10 dB | |
| 71.9 dB | +1.70 dB | |
| 72 dB | +1.80 dB | |
| 72.2 dB | +2.00 dB | |
| 72.6 dB | +2.40 dB | |
| 72.9 dB | +2.70 dB | |
| 73.2 dB | +3.00 dB | |
| 74.4 dB | +4.20 dB |
The difference between best and worst was 6% (4.2 dB).
The Winrun and Tomket also had better a rolling resistance than the Continental, though it was less than 2%, and we've seen in the other test that the Continental was also 20% behind the best premium, so this isn't a huge win for the cheap tyres.
Rolling Resistance
Rolling resistance in kg t
Lower is better ↓| Position / Tyre | Result | Gap to best | Extra fuel / year |
|---|---|---|---|
| 8.28 kg/t | Best | £0 | |
| 8.37 kg/t | +0.09 kg/t | £5 | |
| 8.38 kg/t | +0.10 kg/t | £5 | |
| 8.56 kg/t | +0.28 kg/t | £15 | |
| 8.63 kg/t | +0.35 kg/t | £19 | |
| 8.71 kg/t | +0.43 kg/t | £23 | |
| 9.18 kg/t | +0.90 kg/t | £48 | |
| 9.42 kg/t | +1.14 kg/t | £61 | |
| 9.82 kg/t | +1.54 kg/t | £82 |
The difference between best and worst was 18.6% (1.54 kg / t). Over 19,000 km a year at £1.45/L, the Maxtrek MAXIMUS M1 uses about 57 L (£82) more fuel than the Tomket Sport Series 1.
Adjust the assumptions
Calculated estimates, not additional measurements. Use the controls to explore the assumptions.
Shockingly, the Continental was the most expensive tyre on test.
Results
Continental PremiumContact 7
205/55 R16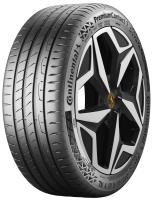
Category scores (% of best)
All discipline results (12)
Discipline positions compare the ranked tyres in this test, not the whole market. These are individual measurements, not weighted overall scores.
| Test | Position in discipline | Result | Gap to best |
|---|---|---|---|
| Dry BrakingLower is better | 1st / 9 | 35.27 m | Best in this discipline |
| Dry HandlingLower is better | 1st / 9 | 51.73 s | Best in this discipline |
| Subj. Dry HandlingHigher is better | 1st / 9 | 100 Points | Best in this discipline |
| Wet BrakingLower is better | 1st / 9 | 31.58 m | Best in this discipline |
| Wet HandlingLower is better | 1st / 9 | 84.85 s | Best in this discipline |
| Subj. Wet HandlingHigher is better | 1st / 9 | 100 Points | Best in this discipline |
| Wet CircleLower is better | 1st / 9 | 11.5 s | Best in this discipline |
| Straight AquaHigher is better | 1st / 9 | 74.91 km/h | Best in this discipline |
| Curved AquaplaningHigher is better | 1st / 9 | 3.3 m/sec2 | Best in this discipline |
| Subj. ComfortHigher is better | 2nd / 9 | 92 Points | -8.00 Points |
| NoiseLower is better | 4th / 9 | 72 dB | +1.80 dB |
| Rolling ResistanceLower is better | 3rd / 9 | 8.38 kg/t | +0.10 kg/t |
- Price
- 86.19
Tomket Sport Series 1
205/55 R16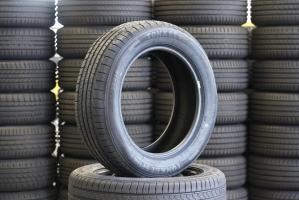
Category scores (% of best)
All discipline results (12)
Discipline positions compare the ranked tyres in this test, not the whole market. These are individual measurements, not weighted overall scores.
| Test | Position in discipline | Result | Gap to best |
|---|---|---|---|
| Dry BrakingLower is better | 2nd / 9 | 37.83 m | +2.56 m |
| Dry HandlingLower is better | 3rd / 9 | 52.78 s | +1.05 s |
| Subj. Dry HandlingHigher is better | 3rd / 9 | 85 Points | -15.00 Points |
| Wet BrakingLower is better | 2nd / 9 | 38.69 m | +7.11 m |
| Wet HandlingLower is better | 2nd / 9 | 89.21 s | +4.36 s |
| Subj. Wet HandlingHigher is better | 2nd / 9 | 90 Points | -10.00 Points |
| Wet CircleLower is better | 3rd / 9 | 12 s | +0.50 s |
| Straight AquaHigher is better | 5th / 9 | 70.52 km/h | -4.39 km/h |
| Curved AquaplaningHigher is better | 5th / 9 | 2.8 m/sec2 | -0.50 m/sec2 |
| Subj. ComfortHigher is better | 3rd / 9 | 91 Points | -9.00 Points |
| NoiseLower is better | 6th / 9 | 72.6 dB | +2.40 dB |
| Rolling ResistanceLower is better | 1st / 9 | 8.28 kg/t | Best in this discipline |
- Price
- 50.49
Nankang Econex NA1
205/55 R16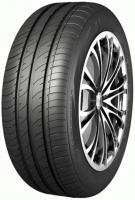
Category scores (% of best)
All discipline results (12)
Discipline positions compare the ranked tyres in this test, not the whole market. These are individual measurements, not weighted overall scores.
| Test | Position in discipline | Result | Gap to best |
|---|---|---|---|
| Dry BrakingLower is better | 3rd / 9 | 38.45 m | +3.18 m |
| Dry HandlingLower is better | 2nd / 9 | 52.23 s | +0.50 s |
| Subj. Dry HandlingHigher is better | 6th / 9 | 75 Points | -25.00 Points |
| Wet BrakingLower is better | 3rd / 9 | 39.61 m | +8.03 m |
| Wet HandlingLower is better | 3rd / 9 | 89.36 s | +4.51 s |
| Subj. Wet HandlingHigher is better | 4th / 9 | 70 Points | -30.00 Points |
| Wet CircleLower is better | 2nd / 9 | 11.9 s | +0.40 s |
| Straight AquaHigher is better | 2nd / 9 | 74.13 km/h | -0.78 km/h |
| Curved AquaplaningHigher is better | 2nd / 9 | 3.2 m/sec2 | -0.10 m/sec2 |
| Subj. ComfortHigher is better | 8th / 9 | 90 Points | -10.00 Points |
| NoiseLower is better | 3rd / 9 | 71.9 dB | +1.70 dB |
| Rolling ResistanceLower is better | 7th / 9 | 9.18 kg/t | +0.90 kg/t |
- Price
- 46.69
Winrun R330
205/55 R16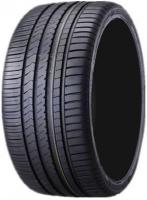
Category scores (% of best)
All discipline results (12)
Discipline positions compare the ranked tyres in this test, not the whole market. These are individual measurements, not weighted overall scores.
| Test | Position in discipline | Result | Gap to best |
|---|---|---|---|
| Dry BrakingLower is better | 6th / 9 | 39.41 m | +4.14 m |
| Dry HandlingLower is better | 5th / 9 | 52.85 s | +1.12 s |
| Subj. Dry HandlingHigher is better | 2nd / 9 | 90 Points | -10.00 Points |
| Wet BrakingLower is better | 5th / 9 | 40.91 m | +9.33 m |
| Wet HandlingLower is better | 5th / 9 | 92.25 s | +7.40 s |
| Subj. Wet HandlingHigher is better | 4th / 9 | 70 Points | -30.00 Points |
| Wet CircleLower is better | 4th / 9 | 12.4 s | +0.90 s |
| Straight AquaHigher is better | 4th / 9 | 70.83 km/h | -4.08 km/h |
| Curved AquaplaningHigher is better | 4th / 9 | 3 m/sec2 | -0.30 m/sec2 |
| Subj. ComfortHigher is better | 1st / 9 | 100 Points | Best in this discipline |
| NoiseLower is better | 5th / 9 | 72.2 dB | +2.00 dB |
| Rolling ResistanceLower is better | 2nd / 9 | 8.37 kg/t | +0.09 kg/t |
- Price
- 46.59
Davanti DX390
205/55 R16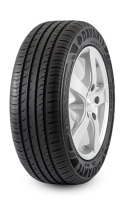
Category scores (% of best)
All discipline results (12)
Discipline positions compare the ranked tyres in this test, not the whole market. These are individual measurements, not weighted overall scores.
| Test | Position in discipline | Result | Gap to best |
|---|---|---|---|
| Dry BrakingLower is better | 4th / 9 | 39.08 m | +3.81 m |
| Dry HandlingLower is better | 8th / 9 | 53.32 s | +1.59 s |
| Subj. Dry HandlingHigher is better | 8th / 9 | 70 Points | -30.00 Points |
| Wet BrakingLower is better | 4th / 9 | 40.75 m | +9.17 m |
| Wet HandlingLower is better | 4th / 9 | 92.19 s | +7.34 s |
| Subj. Wet HandlingHigher is better | 7th / 9 | 65 Points | -35.00 Points |
| Wet CircleLower is better | 4th / 9 | 12.4 s | +0.90 s |
| Straight AquaHigher is better | 3rd / 9 | 70.98 km/h | -3.93 km/h |
| Curved AquaplaningHigher is better | 3rd / 9 | 3.1 m/sec2 | -0.20 m/sec2 |
| Subj. ComfortHigher is better | 3rd / 9 | 91 Points | -9.00 Points |
| NoiseLower is better | 2nd / 9 | 70.3 dB | +0.10 dB |
| Rolling ResistanceLower is better | 4th / 9 | 8.56 kg/t | +0.28 kg/t |
- Price
- 57.78
Triangle SporteX TH201
205/55 R16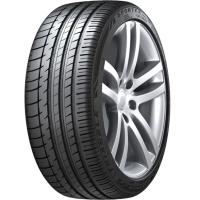
Category scores (% of best)
All discipline results (12)
Discipline positions compare the ranked tyres in this test, not the whole market. These are individual measurements, not weighted overall scores.
| Test | Position in discipline | Result | Gap to best |
|---|---|---|---|
| Dry BrakingLower is better | 9th / 9 | 40.01 m | +4.74 m |
| Dry HandlingLower is better | 6th / 9 | 52.97 s | +1.24 s |
| Subj. Dry HandlingHigher is better | 5th / 9 | 80 Points | -20.00 Points |
| Wet BrakingLower is better | 7th / 9 | 43.6 m | +12.02 m |
| Wet HandlingLower is better | 6th / 9 | 93.11 s | +8.26 s |
| Subj. Wet HandlingHigher is better | 4th / 9 | 70 Points | -30.00 Points |
| Wet CircleLower is better | 6th / 9 | 12.7 s | +1.20 s |
| Straight AquaHigher is better | 7th / 9 | 69.51 km/h | -5.40 km/h |
| Curved AquaplaningHigher is better | 7th / 9 | 2.7 m/sec2 | -0.60 m/sec2 |
| Subj. ComfortHigher is better | 3rd / 9 | 91 Points | -9.00 Points |
| NoiseLower is better | 8th / 9 | 73.2 dB | +3.00 dB |
| Rolling ResistanceLower is better | 6th / 9 | 8.71 kg/t | +0.43 kg/t |
- Price
- 56.08
King Meiler Sport 1 KM
205/55 R16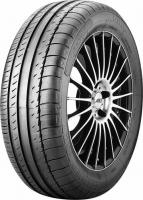
Category scores (% of best)
All discipline results (12)
Discipline positions compare the ranked tyres in this test, not the whole market. These are individual measurements, not weighted overall scores.
| Test | Position in discipline | Result | Gap to best |
|---|---|---|---|
| Dry BrakingLower is better | 7th / 9 | 39.48 m | +4.21 m |
| Dry HandlingLower is better | 4th / 9 | 52.84 s | +1.11 s |
| Subj. Dry HandlingHigher is better | 3rd / 9 | 85 Points | -15.00 Points |
| Wet BrakingLower is better | 8th / 9 | 43.93 m | +12.35 m |
| Wet HandlingLower is better | 8th / 9 | 95.24 s | +10.39 s |
| Subj. Wet HandlingHigher is better | 7th / 9 | 65 Points | -35.00 Points |
| Wet CircleLower is better | 6th / 9 | 12.7 s | +1.20 s |
| Straight AquaHigher is better | 6th / 9 | 69.61 km/h | -5.30 km/h |
| Curved AquaplaningHigher is better | 5th / 9 | 2.8 m/sec2 | -0.50 m/sec2 |
| Subj. ComfortHigher is better | 3rd / 9 | 91 Points | -9.00 Points |
| NoiseLower is better | 7th / 9 | 72.9 dB | +2.70 dB |
| Rolling ResistanceLower is better | 8th / 9 | 9.42 kg/t | +1.14 kg/t |
- Price
- 54.30
Maxtrek MAXIMUS M1
205/55 R16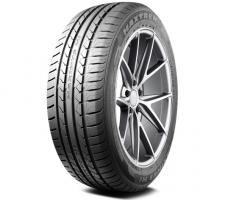
Category scores (% of best)
All discipline results (12)
Discipline positions compare the ranked tyres in this test, not the whole market. These are individual measurements, not weighted overall scores.
| Test | Position in discipline | Result | Gap to best |
|---|---|---|---|
| Dry BrakingLower is better | 5th / 9 | 39.32 m | +4.05 m |
| Dry HandlingLower is better | 7th / 9 | 53.21 s | +1.48 s |
| Subj. Dry HandlingHigher is better | 6th / 9 | 75 Points | -25.00 Points |
| Wet BrakingLower is better | 6th / 9 | 43.45 m | +11.87 m |
| Wet HandlingLower is better | 7th / 9 | 93.93 s | +9.08 s |
| Subj. Wet HandlingHigher is better | 3rd / 9 | 75 Points | -25.00 Points |
| Wet CircleLower is better | 6th / 9 | 12.7 s | +1.20 s |
| Straight AquaHigher is better | 8th / 9 | 67.3 km/h | -7.61 km/h |
| Curved AquaplaningHigher is better | 8th / 9 | 2.6 m/sec2 | -0.70 m/sec2 |
| Subj. ComfortHigher is better | 3rd / 9 | 91 Points | -9.00 Points |
| NoiseLower is better | 9th / 9 | 74.4 dB | +4.20 dB |
| Rolling ResistanceLower is better | 9th / 9 | 9.82 kg/t | +1.54 kg/t |
- Price
- 55.18
Double Coin DC99
205/55 R16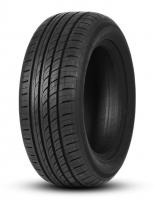
Category scores (% of best)
All discipline results (12)
Discipline positions compare the ranked tyres in this test, not the whole market. These are individual measurements, not weighted overall scores.
| Test | Position in discipline | Result | Gap to best |
|---|---|---|---|
| Dry BrakingLower is better | 8th / 9 | 39.62 m | +4.35 m |
| Dry HandlingLower is better | 9th / 9 | 53.39 s | +1.66 s |
| Subj. Dry HandlingHigher is better | 9th / 9 | 30 Points | -70.00 Points |
| Wet BrakingLower is better | 9th / 9 | 46.04 m | +14.46 m |
| Wet HandlingLower is better | 9th / 9 | 96.27 s | +11.42 s |
| Subj. Wet HandlingHigher is better | 9th / 9 | 50 Points | -50.00 Points |
| Wet CircleLower is better | 9th / 9 | 12.8 s | +1.30 s |
| Straight AquaHigher is better | 9th / 9 | 64.55 km/h | -10.36 km/h |
| Curved AquaplaningHigher is better | 9th / 9 | 2.3 m/sec2 | -1.00 m/sec2 |
| Subj. ComfortHigher is better | 8th / 9 | 90 Points | -10.00 Points |
| NoiseLower is better | 1st / 9 | 70.2 dB | Best in this discipline |
| Rolling ResistanceLower is better | 5th / 9 | 8.63 kg/t | +0.35 kg/t |
- Price
- 45.87
How bad is the ice performance of the current crop of all-seasons (& more specifically, the best) vs, say, a reference winter tire (blizzak/870/etc)?
I'm looking at moving to all-seasons (the contis, in particular) for my winter set of tires on a gs450h (currently 225/50/17 alpin 6 about to start its 4th season - might replace early). Winters here are generally mild (Sofia, Bulgaria), but I do drive in conditions that sometimes form the worst kind of ice (a few below subzero + wet weather + road with basically no sunlight = smooth, slick... you know) - plus the hard ice at winter resort parkings, of course. Same day I can be driving on a highway (140kph) in 15+ degrees dry & sunny weather (say, going to the seaside or to Greece or anywhere southern and/or generally flat), which sounds like the perfect way to degrade winter tires (both compound and thread) - or am I perhaps worrying too much and should stick with winters? And yes, I do see snow regularly, but the snow performance of today's all-seasons seems almost indistinguishable from a non-X-Ice-type winter tires.
I've only done ice traction and braking but it was broadly similar. Data out in next few weeks.
...and I guess I should've posted under the correct article. Not sure how I ended up here, I was looking at the "best 2024 all-seasons" one. Sorry and please move if you're able - my bad.
I'd be very interested to know the relative effect of tyre wear. We all know that a 50% worn tyre does not perform as well as it did when it was new. What we dont know is how does a 50% worn premium tyre compare against a brand new budget tyre...?
Maybe if you buy budget but change at 50% wear, you might be overall safer than if you buy premium but run it til it's not legal anymore, I don't know?
A purist will buy premium AND change well within the limit but not all of us have the budget to do that, so I'd love to see some hard facts on the topic.
thanks, Mark
In aquaplaning you likely would be safer with two budget tyres, but in every other way I would rather be on the premium tyre.
all your tests are done at high speeds. i am interested in the slow speed dry/wet braking test. does that also translate to cars driven inside the city at slow speeds (30 to 40 km/h)?
Trends continue but naturally things are much closer as distances are shorter
I would compare budget summer tyres with the European winter tyres, as this should be the case. Those who wants to save some money, they would not even change non-studded winter tyres. I'm working in tyre online store in Latvia, mostly this is the issue - most of the drivers does not see the benefit in switching tyres, European winter tyres are considered as All season tyres: www.jaunasriepas.lv
« While external noise does have an impact on », https://media1.giphy.com/me...
lol, top gif.
External noise is a factor, however tyre companies can direct the noise of the tyre with tread pattern design, meaning some companies can direct the noise into the wheel arch to get a better EU label score, but have worse internal noise. I don't think it makes a massive difference.
Pitch is also another thing you notice a lot more inside which isn't recorded on the external noise tests.
Not sure if it’s being on mobile, but the formatting cuts of whatever external noise has an impact on https://uploads.disquscdn.c...
Ah thanks, that's a copy and paste issue on my part!
Did you try putting 4 different budget tyres on the car - some part worn etc. The number of times while I've been waiting for a tyre change someone has come in and asked for a single tyre change with the cheapest replacement going.
I've not done all 4 but there's a video on the channel comparing budgets on the rear and premium on front of an M2
Best thinking face emoji in video thumbnail yet! :D
I would add another recent test, where they compare set of premium tyres vs set of budget brands (some maybe rather known midrange brands, not necessarily Asian unknown brands):
https://autozurnal.com/test...
I know it is in Slovak, but nowadays with google translate available... anyway, it is mostly about graphs and numbers :)
Btw, the test also confirms CPC7's great wet road abilities. I think the test was done in cooperation with Czech car club, as they have the same results in different graphic design on their web.
There's a bunch of similar tests on the site from this year, all very similar results. It's nice when tyre testers agree.
Though you are correct, I wouldn't call any of those tyres budget at all, lowest is mid range / tier 2. This is a true budget test!
Sorry, I realised there was a page 2 with lots of budget tyres on too, but I realised that as I was taking off on a flight so just got around to replying now :)
Thanks for the link!
Retreaded passenger car tires are sometimes good for slow moving low load vehicles that travel on dirt roads. Farm cars, hunting cars we call them. In the USA the last company to offer retail retreaded passenger car tires finally went out of business recently. They produced lots of junk tires that failed at highway speeds and were a nightmare to own. Their off road low speed low load tires performed much better.
Agreed! Truck and bus tires also often get re-treaded, but they're designed to be!