



The 2025 ADAC summer tyre test has been published, and it follows this years trend of testing in the sporty 225/40 R18 tyre size!
As always with ADAC they sadly don't give us all the data for the test, but they do give us some interesting insights, including wear, and they do a great job summarising each tyres performance overall.
Test setup & methodology
The test setting, the conditions recorded and how the results contribute to the score.
Recorded test conditions
Recorded test conditions
- Dry Braking
- 100 → 0 km/h
- Wet Braking
- 80 → 0 km/h
- Wet Braking - Concrete
- 80 → 0 km/h
So, what are the surprises from this years test? There's nothing significantly unusual, but as is usually the case with tyre testing, some of the result do not line up with expectations.
Most notably was the wear test for the Bridgestone Potenza Sport. The Potenza Sport is traditionally one of the higher wearing tyres, but in this test it had the fourth best mileage overall which is a dramatic improvement from its usual result!
Also on the subject of wear, the Doublecoin budget tyre put in an incredible result, 25% ahead of the next best (Michelin) however the testers could still not recommend the tyre, mostly due to the incredibly bad wet grip. In fact, braking down from 130 km/h in the wet, where you'd be stopped on the Continental you'd still be doing 79.1 km/h on the Double Coin. That's a big accident.
It would be nice to have insight to the rest of the data, but below is what we have. Be sure to check out the summary of the tyres performance at the bottom of the page, or on the full article over on the ADAC website.
Wet
Wet braking was as you'd expect on both asphalt and concrete. Continental, Bridgestone, Michelin and Goodyear took the top four places in both tests, with the Doublecoin performing horribly. From now on, we will be ignoring the Double Coin in the results summary.
Wet Braking
Wet braking in meters (80 - 0 km/h)
Lower is better ↓| Position / Tyre | Result | Gap to best | Residual speed |
|---|---|---|---|
| 28.4 m | Best | 0 km/h | |
| 28.8 m | +0.40 m | 15 km/h | |
| 29.2 m | +0.80 m | 22 km/h | |
| 29.5 m | +1.10 m | 25 km/h | |
| 30.2 m | +1.80 m | 32 km/h | |
| 30.5 m | +2.10 m | 34 km/h | |
| 30.9 m | +2.50 m | 37 km/h | |
| 30.9 m | +2.50 m | 37 km/h | |
| 31 m | +2.60 m | 38 km/h | |
| 31 m | +2.60 m | 38 km/h | |
| 31 m | +2.60 m | 38 km/h | |
| 31.2 m | +2.80 m | 39 km/h | |
| 31.5 m | +3.10 m | 41 km/h | |
| 31.5 m | +3.10 m | 41 km/h | |
| 32.3 m | +3.90 m | 45 km/h | |
| 33.3 m | +4.90 m | 50 km/h | |
| 34.6 m | +6.20 m | 55 km/h | |
| 45.1 m | +16.70 m | 79 km/h |
The difference between best and worst was 58.8% (16.7 m ≈ 3.7 Car Lengths). From 130 km/h, the Double Coin DC 100 would still be travelling at 79 km/h when the Continental SportContact 7 had stopped.
Residual speed is calculated from the measured braking distances, assuming constant deceleration; it is not a separate measurement.
Wet Braking - Concrete
Wet braking on Concrete in meters (80 - 0 km/h)
Lower is better ↓| Position / Tyre | Result | Gap to best | Residual speed |
|---|---|---|---|
| 34.2 m | Best | 0 km/h | |
| 34.6 m | +0.40 m | 14 km/h | |
| 35.3 m | +1.10 m | 23 km/h | |
| 35.8 m | +1.60 m | 27 km/h | |
| 36 m | +1.80 m | 29 km/h | |
| 37.5 m | +3.30 m | 39 km/h | |
| 37.7 m | +3.50 m | 40 km/h | |
| 37.7 m | +3.50 m | 40 km/h | |
| 37.8 m | +3.60 m | 40 km/h | |
| 38 m | +3.80 m | 41 km/h | |
| 38.1 m | +3.90 m | 42 km/h | |
| 38.4 m | +4.20 m | 43 km/h | |
| 38.5 m | +4.30 m | 43 km/h | |
| 39 m | +4.80 m | 46 km/h | |
| 40.9 m | +6.70 m | 53 km/h | |
| 42 m | +7.80 m | 56 km/h | |
| 44.4 m | +10.20 m | 62 km/h | |
| 55.2 m | +21.00 m | 80 km/h |
The difference between best and worst was 61.4% (21 m ≈ 4.7 Car Lengths). From 130 km/h, the Double Coin DC 100 would still be travelling at 80 km/h when the Continental SportContact 7 had stopped.
Residual speed is calculated from the measured braking distances, assuming constant deceleration; it is not a separate measurement.
In the deeper water of the aquaplaning tests the Dunlop and Giti performing consistently across the straight and curved tests.
Straight Aqua
Float Speed in Km/H
Higher is better ↑| Position / Tyre | Result | Gap to best |
|---|---|---|
| 83.7 km/h | Best | |
| 82.6 km/h | -1.10 km/h | |
| 81.2 km/h | -2.50 km/h | |
| 79.9 km/h | -3.80 km/h | |
| 79.6 km/h | -4.10 km/h | |
| 79.4 km/h | -4.30 km/h | |
| 79.1 km/h | -4.60 km/h | |
| 79.1 km/h | -4.60 km/h | |
| 78.9 km/h | -4.80 km/h | |
| 78.7 km/h | -5.00 km/h | |
| 78.3 km/h | -5.40 km/h | |
| 78 km/h | -5.70 km/h | |
| 77.5 km/h | -6.20 km/h | |
| 77.1 km/h | -6.60 km/h | |
| 76 km/h | -7.70 km/h | |
| 75.9 km/h | -7.80 km/h | |
| 73.2 km/h | -10.50 km/h | |
| 69.3 km/h | -14.40 km/h |
The difference between best and worst was 17.2% (14.4 Km/H).
Curved Aquaplaning
Remaining lateral acceleration
Higher is better ↑| Position / Tyre | Result | Gap to best |
|---|---|---|
| 3.5 m/sec2 | Best | |
| 3.4 m/sec2 | -0.10 m/sec2 | |
| 3.2 m/sec2 | -0.30 m/sec2 | |
| 3.1 m/sec2 | -0.40 m/sec2 | |
| 3.1 m/sec2 | -0.40 m/sec2 | |
| 3 m/sec2 | -0.50 m/sec2 | |
| 3 m/sec2 | -0.50 m/sec2 | |
| 3 m/sec2 | -0.50 m/sec2 | |
| 3 m/sec2 | -0.50 m/sec2 | |
| 3 m/sec2 | -0.50 m/sec2 | |
| 3 m/sec2 | -0.50 m/sec2 | |
| 2.9 m/sec2 | -0.60 m/sec2 | |
| 2.9 m/sec2 | -0.60 m/sec2 | |
| 2.9 m/sec2 | -0.60 m/sec2 | |
| 2.8 m/sec2 | -0.70 m/sec2 | |
| 2.8 m/sec2 | -0.70 m/sec2 | |
| 2.5 m/sec2 | -1.00 m/sec2 | |
| 1.9 m/sec2 | -1.60 m/sec2 |
The difference between best and worst was 45.7% (1.6 m/sec2).
Dry
The Yokohama Advan V107 narrowly beat the Bridgestone Potenza Sport for the best in dry braking, with an unusually large spread for dry.
Dry Braking
Dry braking in meters (100 - 0 km/h)
Lower is better ↓| Position / Tyre | Result | Gap to best | Residual speed |
|---|---|---|---|
| 34.8 m | Best | 0 km/h | |
| 34.8 m | Best | 0 km/h | |
| 34.9 m | +0.10 m | 7 km/h | |
| 35.2 m | +0.40 m | 14 km/h | |
| 35.4 m | +0.60 m | 17 km/h | |
| 35.5 m | +0.70 m | 18 km/h | |
| 35.5 m | +0.70 m | 18 km/h | |
| 35.8 m | +1.00 m | 22 km/h | |
| 35.9 m | +1.10 m | 23 km/h | |
| 36.5 m | +1.70 m | 28 km/h | |
| 36.6 m | +1.80 m | 29 km/h | |
| 37.2 m | +2.40 m | 33 km/h | |
| 37.3 m | +2.50 m | 34 km/h | |
| 37.5 m | +2.70 m | 35 km/h | |
| 37.8 m | +3.00 m | 37 km/h | |
| 38.4 m | +3.60 m | 40 km/h | |
| 39.4 m | +4.60 m | 44 km/h | |
| 39.5 m | +4.70 m | 45 km/h |
The difference between best and worst was 13.5% (4.7 m ≈ 1 Car Lengths). From 130 km/h, the Double Coin DC 100 would still be travelling at 45 km/h when the Kumho Ecsta PS71 had stopped.
Residual speed is calculated from the measured braking distances, assuming constant deceleration; it is not a separate measurement.
Comfort
The external noise test had the Goodyear the best of the tyres that you'd consider buying, with the Michelin and Bridgestone noisier during the pass by noise test.
Noise
External noise in dB
Lower is better ↓| Position / Tyre | Result | Gap to best |
|---|---|---|
| 71.1 dB | Best | |
| 71.2 dB | +0.10 dB | |
| 71.3 dB | +0.20 dB | |
| 71.5 dB | +0.40 dB | |
| 71.7 dB | +0.60 dB | |
| 71.8 dB | +0.70 dB | |
| 72 dB | +0.90 dB | |
| 72.3 dB | +1.20 dB | |
| 72.3 dB | +1.20 dB | |
| 72.4 dB | +1.30 dB | |
| 72.4 dB | +1.30 dB | |
| 72.4 dB | +1.30 dB | |
| 72.4 dB | +1.30 dB | |
| 72.8 dB | +1.70 dB | |
| 72.9 dB | +1.80 dB | |
| 73.1 dB | +2.00 dB | |
| 73.6 dB | +2.50 dB | |
| 73.8 dB | +2.70 dB |
The difference between best and worst was 3.8% (2.7 dB).

Value
The Michelin, Goodyear and Bridgestone performed well in the wear test, the test winning Continental finished midpack.
Wear
Predicted tread life in KM
Higher is better ↑| Position / Tyre | Result | Gap to best |
|---|---|---|
| 74,400 KM | Best | |
| 56,400 KM | -18,000 KM | |
| 50,800 KM | -23,600 KM | |
| 50,500 KM | -23,900 KM | |
| 46,700 KM | -27,700 KM | |
| 45,100 KM | -29,300 KM | |
| 44,700 KM | -29,700 KM | |
| 43,700 KM | -30,700 KM | |
| 43,400 KM | -31,000 KM | |
| 42,500 KM | -31,900 KM | |
| 41,700 KM | -32,700 KM | |
| 41,500 KM | -32,900 KM | |
| 40,100 KM | -34,300 KM | |
| 37,300 KM | -37,100 KM | |
| 36,600 KM | -37,800 KM | |
| 34,500 KM | -39,900 KM | |
| 34,300 KM | -40,100 KM | |
| 33,600 KM | -40,800 KM |
The difference between best and worst was 54.8% (40,800 KM).
Naturally the low wearing, cheap to buy Double Coin was the best value tyre, but the best value of the usable tyres was the Falken and Bridgestone.
Value
Euros/1000km based on cost/wear
Lower is better ↓| Position / Tyre | Result | Gap to best |
|---|---|---|
| 1.02 Price/1000 | Best | |
| 2 Price/1000 | +0.98 Price/1000 | |
| 2.02 Price/1000 | +1.00 Price/1000 | |
| 2.1 Price/1000 | +1.08 Price/1000 | |
| 2.26 Price/1000 | +1.24 Price/1000 | |
| 2.35 Price/1000 | +1.33 Price/1000 | |
| 2.36 Price/1000 | +1.34 Price/1000 | |
| 2.4 Price/1000 | +1.38 Price/1000 | |
| 2.52 Price/1000 | +1.50 Price/1000 | |
| 2.59 Price/1000 | +1.57 Price/1000 | |
| 2.76 Price/1000 | +1.74 Price/1000 | |
| 2.89 Price/1000 | +1.87 Price/1000 | |
| 2.92 Price/1000 | +1.90 Price/1000 | |
| 3.03 Price/1000 | +2.01 Price/1000 | |
| 3.06 Price/1000 | +2.04 Price/1000 | |
| 3.19 Price/1000 | +2.17 Price/1000 | |
| 3.3 Price/1000 | +2.28 Price/1000 | |
| 3.39 Price/1000 | +2.37 Price/1000 |
The difference between best and worst was 232.4% (2.37 Price/1000).
The Bridgestone used about 10% more fuel in the on-road fuel consumption test.
Fuel Consumption
Fuel consumption in Litres per 100 km
Lower is better ↓| Position / Tyre | Result | Gap to best | Extra fuel / year |
|---|---|---|---|
| 5.3 l/100km | Best | £0 | |
| 5.4 l/100km | +0.10 l/100km | £28 | |
| 5.5 l/100km | +0.20 l/100km | £55 | |
| 5.5 l/100km | +0.20 l/100km | £55 | |
| 5.5 l/100km | +0.20 l/100km | £55 | |
| 5.5 l/100km | +0.20 l/100km | £55 | |
| 5.5 l/100km | +0.20 l/100km | £55 | |
| 5.6 l/100km | +0.30 l/100km | £83 | |
| 5.6 l/100km | +0.30 l/100km | £83 | |
| 5.6 l/100km | +0.30 l/100km | £83 | |
| 5.6 l/100km | +0.30 l/100km | £83 | |
| 5.6 l/100km | +0.30 l/100km | £83 | |
| 5.6 l/100km | +0.30 l/100km | £83 | |
| 5.6 l/100km | +0.30 l/100km | £83 | |
| 5.7 l/100km | +0.40 l/100km | £110 | |
| 5.7 l/100km | +0.40 l/100km | £110 | |
| 5.7 l/100km | +0.40 l/100km | £110 | |
| 5.8 l/100km | +0.50 l/100km | £138 |
The difference between best and worst was 9.4% (0.5 l/100km). Over 19,000 km a year at £1.45/L, the Bridgestone Potenza Sport uses about 95 L (£138) more fuel than the Double Coin DC 100.
Adjust the assumptions
Calculated estimates, not additional measurements. Use the controls to explore the assumptions.
The Michelin had the best wearing compound when you calculate how much compound was worn away during the wear test.
Abrasion
Weight of Tyre Wear Particles Lost (mg/km/t)
Lower is better ↓| Position / Tyre | Result | Gap to best |
|---|---|---|
| 43.9 mg/km/t | Best | |
| 56.1 mg/km/t | +12.20 mg/km/t | |
| 61.9 mg/km/t | +18.00 mg/km/t | |
| 63.4 mg/km/t | +19.50 mg/km/t | |
| 63.8 mg/km/t | +19.90 mg/km/t | |
| 67.7 mg/km/t | +23.80 mg/km/t | |
| 74.2 mg/km/t | +30.30 mg/km/t | |
| 74.7 mg/km/t | +30.80 mg/km/t | |
| 75.5 mg/km/t | +31.60 mg/km/t | |
| 76.3 mg/km/t | +32.40 mg/km/t | |
| 80.5 mg/km/t | +36.60 mg/km/t | |
| 80.5 mg/km/t | +36.60 mg/km/t | |
| 81.1 mg/km/t | +37.20 mg/km/t | |
| 85.7 mg/km/t | +41.80 mg/km/t | |
| 85.9 mg/km/t | +42.00 mg/km/t | |
| 91 mg/km/t | +47.10 mg/km/t | |
| 95 mg/km/t | +51.10 mg/km/t | |
| 97.7 mg/km/t | +53.80 mg/km/t |
The difference between best and worst was 122.6% (53.8 mg/km/t).
Results
Continental SportContact 7
225/40 R18 92Y XL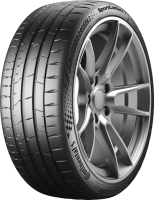
Category scores (% of best)
All discipline results (10)
Discipline positions compare the ranked tyres in this test, not the whole market. These are individual measurements, not weighted overall scores.
| Test | Position in discipline | Result | Gap to best |
|---|---|---|---|
| Dry BrakingLower is better | 4th / 18 | 35.2 m | +0.40 m |
| Wet BrakingLower is better | 1st / 18 | 28.4 m | Best in this discipline |
| Wet Braking - ConcreteLower is better | 1st / 18 | 34.2 m | Best in this discipline |
| Straight AquaHigher is better | 5th / 18 | 79.6 km/h | -4.10 km/h |
| Curved AquaplaningHigher is better | 12th / 18 | 2.9 m/sec2 | -0.60 m/sec2 |
| NoiseLower is better | 8th / 18 | 72.3 dB | +1.20 dB |
| WearHigher is better | 9th / 18 | 43400 KM | -31,000.00 KM |
| ValueLower is better | 15th / 18 | 3.06 Price/1000 | +2.04 Price/1000 |
| Fuel ConsumptionLower is better | 3rd / 18 | 5.5 l/100km | +0.20 l/100km |
| AbrasionLower is better | 4th / 18 | 63.4 mg/km/t | +19.50 mg/km/t |
- EU Label
- C/A/72
- Weight
- 9.6 kgs
- Price
- 133.00
Bridgestone Potenza Sport
225/40 R18 92Y XL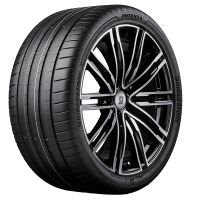
Category scores (% of best)
All discipline results (10)
Discipline positions compare the ranked tyres in this test, not the whole market. These are individual measurements, not weighted overall scores.
| Test | Position in discipline | Result | Gap to best |
|---|---|---|---|
| Dry BrakingLower is better | 3rd / 18 | 34.9 m | +0.10 m |
| Wet BrakingLower is better | 2nd / 18 | 28.8 m | +0.40 m |
| Wet Braking - ConcreteLower is better | 2nd / 18 | 34.6 m | +0.40 m |
| Straight AquaHigher is better | 9th / 18 | 78.9 km/h | -4.80 km/h |
| Curved AquaplaningHigher is better | 4th / 18 | 3.1 m/sec2 | -0.40 m/sec2 |
| NoiseLower is better | 18th / 18 | 73.8 dB | +2.70 dB |
| WearHigher is better | 4th / 18 | 50500 KM | -23,900.00 KM |
| ValueLower is better | 8th / 18 | 2.4 Price/1000 | +1.38 Price/1000 |
| Fuel ConsumptionLower is better | 18th / 18 | 5.8 l/100km | +0.50 l/100km |
| AbrasionLower is better | 5th / 18 | 63.8 mg/km/t | +19.90 mg/km/t |
- EU Label
- D/A/72
- Weight
- 9.9 kgs
- Price
- 121.00
Michelin Pilot Sport 5
225/40 R18 92Y XL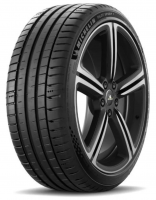
Category scores (% of best)
All discipline results (10)
Discipline positions compare the ranked tyres in this test, not the whole market. These are individual measurements, not weighted overall scores.
| Test | Position in discipline | Result | Gap to best |
|---|---|---|---|
| Dry BrakingLower is better | 6th / 18 | 35.5 m | +0.70 m |
| Wet BrakingLower is better | 3rd / 18 | 29.2 m | +0.80 m |
| Wet Braking - ConcreteLower is better | 3rd / 18 | 35.3 m | +1.10 m |
| Straight AquaHigher is better | 4th / 18 | 79.9 km/h | -3.80 km/h |
| Curved AquaplaningHigher is better | 6th / 18 | 3 m/sec2 | -0.50 m/sec2 |
| NoiseLower is better | 16th / 18 | 73.1 dB | +2.00 dB |
| WearHigher is better | 2nd / 18 | 56400 KM | -18,000.00 KM |
| ValueLower is better | 10th / 18 | 2.59 Price/1000 | +1.57 Price/1000 |
| Fuel ConsumptionLower is better | 8th / 18 | 5.6 l/100km | +0.30 l/100km |
| AbrasionLower is better | 2nd / 18 | 56.1 mg/km/t | +12.20 mg/km/t |
- EU Label
- C/A/72
- Weight
- 9.5 kgs
- Price
- 146.00
Goodyear Eagle F1 Asymmetric 6
225/40 R18 92Y XL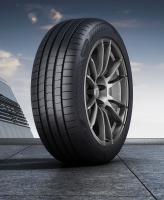
Category scores (% of best)
All discipline results (10)
Discipline positions compare the ranked tyres in this test, not the whole market. These are individual measurements, not weighted overall scores.
| Test | Position in discipline | Result | Gap to best |
|---|---|---|---|
| Dry BrakingLower is better | 6th / 18 | 35.5 m | +0.70 m |
| Wet BrakingLower is better | 4th / 18 | 29.5 m | +1.10 m |
| Wet Braking - ConcreteLower is better | 4th / 18 | 35.8 m | +1.60 m |
| Straight AquaHigher is better | 6th / 18 | 79.4 km/h | -4.30 km/h |
| Curved AquaplaningHigher is better | 4th / 18 | 3.1 m/sec2 | -0.40 m/sec2 |
| NoiseLower is better | 2nd / 18 | 71.2 dB | +0.10 dB |
| WearHigher is better | 3rd / 18 | 50800 KM | -23,600.00 KM |
| ValueLower is better | 9th / 18 | 2.52 Price/1000 | +1.50 Price/1000 |
| Fuel ConsumptionLower is better | 8th / 18 | 5.6 l/100km | +0.30 l/100km |
| AbrasionLower is better | 7th / 18 | 74.2 mg/km/t | +30.30 mg/km/t |
- EU Label
- C/A/70
- Weight
- 9.2 kgs
- Price
- 128.00
Vredestein Ultrac Pro
225/40 R18 92Y XL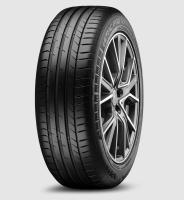
Category scores (% of best)
All discipline results (10)
Discipline positions compare the ranked tyres in this test, not the whole market. These are individual measurements, not weighted overall scores.
| Test | Position in discipline | Result | Gap to best |
|---|---|---|---|
| Dry BrakingLower is better | 11th / 18 | 36.6 m | +1.80 m |
| Wet BrakingLower is better | 9th / 18 | 31 m | +2.60 m |
| Wet Braking - ConcreteLower is better | 6th / 18 | 37.5 m | +3.30 m |
| Straight AquaHigher is better | 7th / 18 | 79.1 km/h | -4.60 km/h |
| Curved AquaplaningHigher is better | 6th / 18 | 3 m/sec2 | -0.50 m/sec2 |
| NoiseLower is better | 6th / 18 | 71.8 dB | +0.70 dB |
| WearHigher is better | 13th / 18 | 40100 KM | -34,300.00 KM |
| ValueLower is better | 12th / 18 | 2.89 Price/1000 | +1.87 Price/1000 |
| Fuel ConsumptionLower is better | 15th / 18 | 5.7 l/100km | +0.40 l/100km |
| AbrasionLower is better | 9th / 18 | 75.5 mg/km/t | +31.60 mg/km/t |
- EU Label
- D/A/72
- Weight
- 10 kgs
- Price
- 116.00
Yokohama Advan Sport V107
225/40 R18 92Y XL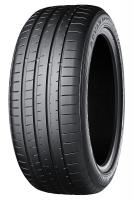
Category scores (% of best)
All discipline results (10)
Discipline positions compare the ranked tyres in this test, not the whole market. These are individual measurements, not weighted overall scores.
| Test | Position in discipline | Result | Gap to best |
|---|---|---|---|
| Dry BrakingLower is better | 1st / 18 | 34.8 m | Best in this discipline |
| Wet BrakingLower is better | 12th / 18 | 31.2 m | +2.80 m |
| Wet Braking - ConcreteLower is better | 7th / 18 | 37.7 m | +3.50 m |
| Straight AquaHigher is better | 16th / 18 | 75.9 km/h | -7.80 km/h |
| Curved AquaplaningHigher is better | 12th / 18 | 2.9 m/sec2 | -0.60 m/sec2 |
| NoiseLower is better | 15th / 18 | 72.9 dB | +1.80 dB |
| WearHigher is better | 17th / 18 | 34300 KM | -40,100.00 KM |
| ValueLower is better | 17th / 18 | 3.3 Price/1000 | +2.28 Price/1000 |
| Fuel ConsumptionLower is better | 15th / 18 | 5.7 l/100km | +0.40 l/100km |
| AbrasionLower is better | 17th / 18 | 95 mg/km/t | +51.10 mg/km/t |
- EU Label
- D/A/71
- Weight
- 10 kgs
- Price
- 113.00
Firestone Firehawk Sport
225/40 R18 92Y XL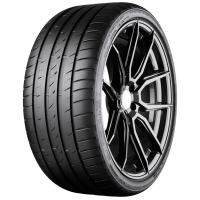
Category scores (% of best)
All discipline results (10)
Discipline positions compare the ranked tyres in this test, not the whole market. These are individual measurements, not weighted overall scores.
| Test | Position in discipline | Result | Gap to best |
|---|---|---|---|
| Dry BrakingLower is better | 9th / 18 | 35.9 m | +1.10 m |
| Wet BrakingLower is better | 7th / 18 | 30.9 m | +2.50 m |
| Wet Braking - ConcreteLower is better | 10th / 18 | 38 m | +3.80 m |
| Straight AquaHigher is better | 13th / 18 | 77.5 km/h | -6.20 km/h |
| Curved AquaplaningHigher is better | 15th / 18 | 2.8 m/sec2 | -0.70 m/sec2 |
| NoiseLower is better | 8th / 18 | 72.3 dB | +1.20 dB |
| WearHigher is better | 16th / 18 | 34500 KM | -39,900.00 KM |
| ValueLower is better | 16th / 18 | 3.19 Price/1000 | +2.17 Price/1000 |
| Fuel ConsumptionLower is better | 3rd / 18 | 5.5 l/100km | +0.20 l/100km |
| AbrasionLower is better | 13th / 18 | 81.1 mg/km/t | +37.20 mg/km/t |
- EU Label
- B/A/70
- Weight
- 9.3 kgs
- Price
- 110.00
Falken Azenis FK520
225/40 R18 92Y XL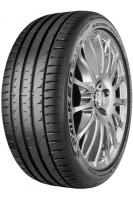
Category scores (% of best)
All discipline results (10)
Discipline positions compare the ranked tyres in this test, not the whole market. These are individual measurements, not weighted overall scores.
| Test | Position in discipline | Result | Gap to best |
|---|---|---|---|
| Dry BrakingLower is better | 8th / 18 | 35.8 m | +1.00 m |
| Wet BrakingLower is better | 6th / 18 | 30.5 m | +2.10 m |
| Wet Braking - ConcreteLower is better | 7th / 18 | 37.7 m | +3.50 m |
| Straight AquaHigher is better | 10th / 18 | 78.7 km/h | -5.00 km/h |
| Curved AquaplaningHigher is better | 15th / 18 | 2.8 m/sec2 | -0.70 m/sec2 |
| NoiseLower is better | 5th / 18 | 71.7 dB | +0.60 dB |
| WearHigher is better | 5th / 18 | 46700 KM | -27,700.00 KM |
| ValueLower is better | 7th / 18 | 2.36 Price/1000 | +1.34 Price/1000 |
| Fuel ConsumptionLower is better | 8th / 18 | 5.6 l/100km | +0.30 l/100km |
| AbrasionLower is better | 3rd / 18 | 61.9 mg/km/t | +18.00 mg/km/t |
- EU Label
- C/A/70
- Weight
- 9.8 kgs
- Price
- 110.00
Dunlop SportMaxx RT 2
225/40 R18 92Y XL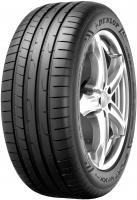
Category scores (% of best)
All discipline results (10)
Discipline positions compare the ranked tyres in this test, not the whole market. These are individual measurements, not weighted overall scores.
| Test | Position in discipline | Result | Gap to best |
|---|---|---|---|
| Dry BrakingLower is better | 13th / 18 | 37.3 m | +2.50 m |
| Wet BrakingLower is better | 13th / 18 | 31.5 m | +3.10 m |
| Wet Braking - ConcreteLower is better | 11th / 18 | 38.1 m | +3.90 m |
| Straight AquaHigher is better | 3rd / 18 | 81.2 km/h | -2.50 km/h |
| Curved AquaplaningHigher is better | 1st / 18 | 3.5 m/sec2 | Best in this discipline |
| NoiseLower is better | 14th / 18 | 72.8 dB | +1.70 dB |
| WearHigher is better | 11th / 18 | 41700 KM | -32,700.00 KM |
| ValueLower is better | 13th / 18 | 2.92 Price/1000 | +1.90 Price/1000 |
| Fuel ConsumptionLower is better | 8th / 18 | 5.6 l/100km | +0.30 l/100km |
| AbrasionLower is better | 16th / 18 | 91 mg/km/t | +47.10 mg/km/t |
- EU Label
- C/A/71
- Weight
- 9.1 kgs
- Price
- 122.00
Nexen N Fera Sport SU2
225/40 R18 92Y XL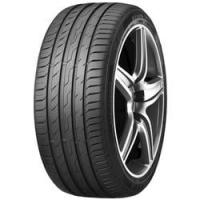
Category scores (% of best)
All discipline results (10)
Discipline positions compare the ranked tyres in this test, not the whole market. These are individual measurements, not weighted overall scores.
| Test | Position in discipline | Result | Gap to best |
|---|---|---|---|
| Dry BrakingLower is better | 10th / 18 | 36.5 m | +1.70 m |
| Wet BrakingLower is better | 9th / 18 | 31 m | +2.60 m |
| Wet Braking - ConcreteLower is better | 13th / 18 | 38.5 m | +4.30 m |
| Straight AquaHigher is better | 11th / 18 | 78.3 km/h | -5.40 km/h |
| Curved AquaplaningHigher is better | 6th / 18 | 3 m/sec2 | -0.50 m/sec2 |
| NoiseLower is better | 3rd / 18 | 71.3 dB | +0.20 dB |
| WearHigher is better | 8th / 18 | 43700 KM | -30,700.00 KM |
| ValueLower is better | 5th / 18 | 2.26 Price/1000 | +1.24 Price/1000 |
| Fuel ConsumptionLower is better | 8th / 18 | 5.6 l/100km | +0.30 l/100km |
| AbrasionLower is better | 8th / 18 | 74.7 mg/km/t | +30.80 mg/km/t |
- EU Label
- D/A/71
- Weight
- 9.6 kgs
- Price
- 99.00
Toyo Proxes Sport 2
225/40 R18 92Y XL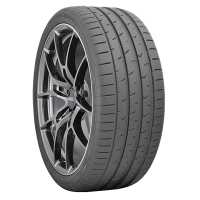
Category scores (% of best)
All discipline results (10)
Discipline positions compare the ranked tyres in this test, not the whole market. These are individual measurements, not weighted overall scores.
| Test | Position in discipline | Result | Gap to best |
|---|---|---|---|
| Dry BrakingLower is better | 5th / 18 | 35.4 m | +0.60 m |
| Wet BrakingLower is better | 9th / 18 | 31 m | +2.60 m |
| Wet Braking - ConcreteLower is better | 9th / 18 | 37.8 m | +3.60 m |
| Straight AquaHigher is better | 12th / 18 | 78 km/h | -5.70 km/h |
| Curved AquaplaningHigher is better | 6th / 18 | 3 m/sec2 | -0.50 m/sec2 |
| NoiseLower is better | 10th / 18 | 72.4 dB | +1.30 dB |
| WearHigher is better | 15th / 18 | 36600 KM | -37,800.00 KM |
| ValueLower is better | 14th / 18 | 3.03 Price/1000 | +2.01 Price/1000 |
| Fuel ConsumptionLower is better | 8th / 18 | 5.6 l/100km | +0.30 l/100km |
| AbrasionLower is better | 15th / 18 | 85.9 mg/km/t | +42.00 mg/km/t |
- EU Label
- D/A/71
- Weight
- 10 kgs
- Price
- 109.00
Ceat SportDrive
225/40 R18 92Y XL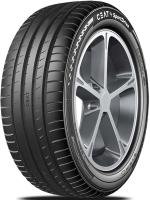
Category scores (% of best)
All discipline results (10)
Discipline positions compare the ranked tyres in this test, not the whole market. These are individual measurements, not weighted overall scores.
| Test | Position in discipline | Result | Gap to best |
|---|---|---|---|
| Dry BrakingLower is better | 12th / 18 | 37.2 m | +2.40 m |
| Wet BrakingLower is better | 16th / 18 | 33.3 m | +4.90 m |
| Wet Braking - ConcreteLower is better | 16th / 18 | 42 m | +7.80 m |
| Straight AquaHigher is better | 15th / 18 | 76 km/h | -7.70 km/h |
| Curved AquaplaningHigher is better | 12th / 18 | 2.9 m/sec2 | -0.60 m/sec2 |
| NoiseLower is better | 4th / 18 | 71.5 dB | +0.40 dB |
| WearHigher is better | 6th / 18 | 45100 KM | -29,300.00 KM |
| ValueLower is better | 2nd / 18 | 2 Price/1000 | +0.98 Price/1000 |
| Fuel ConsumptionLower is better | 3rd / 18 | 5.5 l/100km | +0.20 l/100km |
| AbrasionLower is better | 11th / 18 | 80.5 mg/km/t | +36.60 mg/km/t |
- EU Label
- D/A/71
- Weight
- 9.7 kgs
- Price
- 90.00
Kumho Ecsta PS71
225/40 R18 92Y XL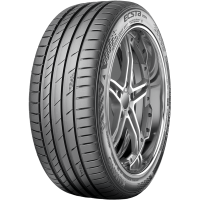
Category scores (% of best)
All discipline results (10)
Discipline positions compare the ranked tyres in this test, not the whole market. These are individual measurements, not weighted overall scores.
| Test | Position in discipline | Result | Gap to best |
|---|---|---|---|
| Dry BrakingLower is better | 1st / 18 | 34.8 m | Best in this discipline |
| Wet BrakingLower is better | 5th / 18 | 30.2 m | +1.80 m |
| Wet Braking - ConcreteLower is better | 5th / 18 | 36 m | +1.80 m |
| Straight AquaHigher is better | 1st / 18 | 83.7 km/h | Best in this discipline |
| Curved AquaplaningHigher is better | 6th / 18 | 3 m/sec2 | -0.50 m/sec2 |
| NoiseLower is better | 17th / 18 | 73.6 dB | +2.50 dB |
| WearHigher is better | 14th / 18 | 37300 KM | -37,100.00 KM |
| ValueLower is better | 11th / 18 | 2.76 Price/1000 | +1.74 Price/1000 |
| Fuel ConsumptionLower is better | 15th / 18 | 5.7 l/100km | +0.40 l/100km |
| AbrasionLower is better | 14th / 18 | 85.7 mg/km/t | +41.80 mg/km/t |
- EU Label
- D/A/72
- Weight
- 9.8 kgs
- Price
- 103.00
Nokian Powerproof 1
225/40 R18 92Y XL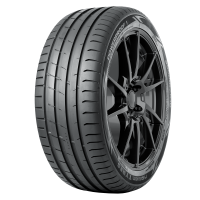
Category scores (% of best)
All discipline results (10)
Discipline positions compare the ranked tyres in this test, not the whole market. These are individual measurements, not weighted overall scores.
| Test | Position in discipline | Result | Gap to best |
|---|---|---|---|
| Dry BrakingLower is better | 15th / 18 | 37.8 m | +3.00 m |
| Wet BrakingLower is better | 13th / 18 | 31.5 m | +3.10 m |
| Wet Braking - ConcreteLower is better | 14th / 18 | 39 m | +4.80 m |
| Straight AquaHigher is better | 7th / 18 | 79.1 km/h | -4.60 km/h |
| Curved AquaplaningHigher is better | 3rd / 18 | 3.2 m/sec2 | -0.30 m/sec2 |
| NoiseLower is better | 10th / 18 | 72.4 dB | +1.30 dB |
| WearHigher is better | 10th / 18 | 42500 KM | -31,900.00 KM |
| ValueLower is better | 6th / 18 | 2.35 Price/1000 | +1.33 Price/1000 |
| Fuel ConsumptionLower is better | 3rd / 18 | 5.5 l/100km | +0.20 l/100km |
| AbrasionLower is better | 6th / 18 | 67.7 mg/km/t | +23.80 mg/km/t |
- EU Label
- C/A/69
- Weight
- 9.4 kgs
- Price
- 100.00
Giti GitiSportS2
225/40 R18 92Y XL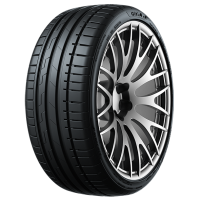
Category scores (% of best)
All discipline results (10)
Discipline positions compare the ranked tyres in this test, not the whole market. These are individual measurements, not weighted overall scores.
| Test | Position in discipline | Result | Gap to best |
|---|---|---|---|
| Dry BrakingLower is better | 17th / 18 | 39.4 m | +4.60 m |
| Wet BrakingLower is better | 17th / 18 | 34.6 m | +6.20 m |
| Wet Braking - ConcreteLower is better | 17th / 18 | 44.4 m | +10.20 m |
| Straight AquaHigher is better | 2nd / 18 | 82.6 km/h | -1.10 km/h |
| Curved AquaplaningHigher is better | 2nd / 18 | 3.4 m/sec2 | -0.10 m/sec2 |
| NoiseLower is better | 7th / 18 | 72 dB | +0.90 dB |
| WearHigher is better | 18th / 18 | 33600 KM | -40,800.00 KM |
| ValueLower is better | 18th / 18 | 3.39 Price/1000 | +2.37 Price/1000 |
| Fuel ConsumptionLower is better | 3rd / 18 | 5.5 l/100km | +0.20 l/100km |
| AbrasionLower is better | 18th / 18 | 97.7 mg/km/t | +53.80 mg/km/t |
- EU Label
- D/A/70
- Weight
- 9.8 kgs
- Price
- 114.00
Norauto Prevensys 4
225/40 R18 92Y XL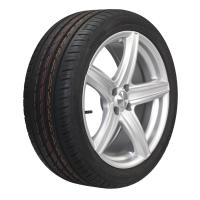
Category scores (% of best)
All discipline results (10)
Discipline positions compare the ranked tyres in this test, not the whole market. These are individual measurements, not weighted overall scores.
| Test | Position in discipline | Result | Gap to best |
|---|---|---|---|
| Dry BrakingLower is better | 16th / 18 | 38.4 m | +3.60 m |
| Wet BrakingLower is better | 7th / 18 | 30.9 m | +2.50 m |
| Wet Braking - ConcreteLower is better | 12th / 18 | 38.4 m | +4.20 m |
| Straight AquaHigher is better | 14th / 18 | 77.1 km/h | -6.60 km/h |
| Curved AquaplaningHigher is better | 6th / 18 | 3 m/sec2 | -0.50 m/sec2 |
| NoiseLower is better | 10th / 18 | 72.4 dB | +1.30 dB |
| WearHigher is better | 7th / 18 | 44700 KM | -29,700.00 KM |
| ValueLower is better | 4th / 18 | 2.1 Price/1000 | +1.08 Price/1000 |
| Fuel ConsumptionLower is better | 8th / 18 | 5.6 l/100km | +0.30 l/100km |
| AbrasionLower is better | 11th / 18 | 80.5 mg/km/t | +36.60 mg/km/t |
- EU Label
- D/A/70
- Weight
- 9.6 kgs
- Price
- 94.00
Syron Premium Performance
225/40 R18 92Y XL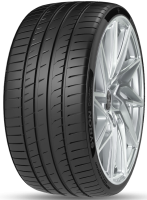
Category scores (% of best)
All discipline results (10)
Discipline positions compare the ranked tyres in this test, not the whole market. These are individual measurements, not weighted overall scores.
| Test | Position in discipline | Result | Gap to best |
|---|---|---|---|
| Dry BrakingLower is better | 14th / 18 | 37.5 m | +2.70 m |
| Wet BrakingLower is better | 15th / 18 | 32.3 m | +3.90 m |
| Wet Braking - ConcreteLower is better | 15th / 18 | 40.9 m | +6.70 m |
| Straight AquaHigher is better | 17th / 18 | 73.2 km/h | -10.50 km/h |
| Curved AquaplaningHigher is better | 17th / 18 | 2.5 m/sec2 | -1.00 m/sec2 |
| NoiseLower is better | 10th / 18 | 72.4 dB | +1.30 dB |
| WearHigher is better | 12th / 18 | 41500 KM | -32,900.00 KM |
| ValueLower is better | 3rd / 18 | 2.02 Price/1000 | +1.00 Price/1000 |
| Fuel ConsumptionLower is better | 2nd / 18 | 5.4 l/100km | +0.10 l/100km |
| AbrasionLower is better | 10th / 18 | 76.3 mg/km/t | +32.40 mg/km/t |
- EU Label
- C/B/72
- Weight
- 9.6 kgs
- Price
- 84.00
Double Coin DC 100
225/40 R18 92W XL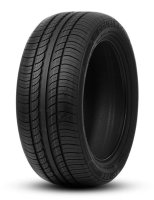
Category scores (% of best)
All discipline results (10)
Discipline positions compare the ranked tyres in this test, not the whole market. These are individual measurements, not weighted overall scores.
| Test | Position in discipline | Result | Gap to best |
|---|---|---|---|
| Dry BrakingLower is better | 18th / 18 | 39.5 m | +4.70 m |
| Wet BrakingLower is better | 18th / 18 | 45.1 m | +16.70 m |
| Wet Braking - ConcreteLower is better | 18th / 18 | 55.2 m | +21.00 m |
| Straight AquaHigher is better | 18th / 18 | 69.3 km/h | -14.40 km/h |
| Curved AquaplaningHigher is better | 18th / 18 | 1.9 m/sec2 | -1.60 m/sec2 |
| NoiseLower is better | 1st / 18 | 71.1 dB | Best in this discipline |
| WearHigher is better | 1st / 18 | 74400 KM | Best in this discipline |
| ValueLower is better | 1st / 18 | 1.02 Price/1000 | Best in this discipline |
| Fuel ConsumptionLower is better | 1st / 18 | 5.3 l/100km | Best in this discipline |
| AbrasionLower is better | 1st / 18 | 43.9 mg/km/t | Best in this discipline |
- EU Label
- C/C/72
- Weight
- 9.7 kgs
- Price
- 76.00
Although it’s a summer test, there is no dry breaking and cornering data.
Yeah, adac don't publish it for some reason. They definitely do it though, you can see on their site they have a dry score.
Dry braking and other data is available by clicking on the tyre within the ranking.
Biggest surprise for me is the Bridgestone. Many other tests devaluate the Potenza Sport because of its high wear and overheating when driven hard, but they don't even mention it (but they do mention it on other tyres). Is it possible that Bridgestone improved the tyre compound? I can hardly imagine that so many (including TyreReviews) did notice this, but ADAC did not. Very strange.
Btw., here is the direct link to the test: https://www.adac.de/rund-ums-fahrzeug/ausstattung-technik-zubehoer/reifen/reifentest/sommerreifen/225-40-r18/
Yes sorry they do have dry braking, I'll check why it's not displayed on this article, but no dry handling times sadly.
Also yes I agree the Bridgestone is very unusual, perhaps it is a new compound. The https://www.tyrereviews.com/Tyre-Tests/2025-AZ-Summer-Tyre-Test.htm test in 225/45 R18 had the Bridgestone where we would expect it based on historic results.