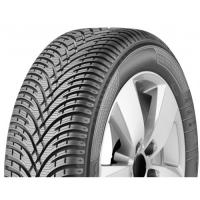
Test Charts / Auto Bild
2019 Auto Bild Winter 17 inch Tyre Test
Compare each discipline in the tested size. See the measured result, position and gap to the best tyre, then read the verdict for the trade-offs behind the finishing order.
- Tested size
- 225/45 R17
- Tyres tested
- 20
- Disciplines
- 11

Read the measurements, not just the rank
Lower is better for braking distances and lap times; higher is better for subjective scores and aquaplaning speed. Bars start at zero. Read the gap alongside the position: adjacent tyres can be separated by very different margins.
Positions and gaps always refer to the full test field within each group. Selecting tyres does not recalculate rankings or change the best-in-test benchmark.
Focus on your tyres
Select tyres to highlight them throughout the charts.
Positions and gaps always refer to the full test field within each group. Selecting tyres does not recalculate rankings or change the best-in-test benchmark.
Dry
2Dry Braking
Dry braking in meters
Lower is better ↓| Position / Tyre | Result | Gap to best |
|---|---|---|
RefReference Summer |
38.4 m | -5.90 m |
| 44.3 m | Best | |
| 44.4 m | +0.10 m | |
| 44.4 m | +0.10 m | |
| 44.5 m | +0.20 m | |
| 44.5 m | +0.20 m | |
| 44.7 m | +0.40 m | |
| 44.7 m | +0.40 m | |
| 44.7 m | +0.40 m | |
| 45.1 m | +0.80 m | |
| 45.2 m | +0.90 m | |
| 45.5 m | +1.20 m | |
| 45.7 m | +1.40 m | |
| 46 m | +1.70 m | |
| 46 m | +1.70 m | |
| 46.3 m | +2.00 m | |
| 46.4 m | +2.10 m | |
| 46.5 m | +2.20 m | |
| 46.7 m | +2.40 m | |
| 46.7 m | +2.40 m | |
| 47.3 m | +3.00 m |
The difference between best and worst was 23.2% (8.9 m ≈ 2 Car Lengths).
Dry Handling
Dry Handling Average Speed
Higher is better ↑| Position / Tyre | Result | Gap to best |
|---|---|---|
RefReference Summer |
84.6 km/h | +1.70 km/h |
| 82.9 km/h | Best | |
| 82.6 km/h | -0.30 km/h | |
| 82.5 km/h | -0.40 km/h | |
| 82.3 km/h | -0.60 km/h | |
| 81.9 km/h | -1.00 km/h | |
| 81.9 km/h | -1.00 km/h | |
| 81.8 km/h | -1.10 km/h | |
| 81.8 km/h | -1.10 km/h | |
| 81.8 km/h | -1.10 km/h | |
| 81.7 km/h | -1.20 km/h | |
| 81.7 km/h | -1.20 km/h | |
| 81.7 km/h | -1.20 km/h | |
| 81.6 km/h | -1.30 km/h | |
| 81.6 km/h | -1.30 km/h | |
| 81.5 km/h | -1.40 km/h | |
| 81.3 km/h | -1.60 km/h | |
| 81.2 km/h | -1.70 km/h | |
| 80.7 km/h | -2.20 km/h | |
| 80.4 km/h | -2.50 km/h | |
| 80.1 km/h | -2.80 km/h |
The difference between best and worst was 5.3% (4.5 Km/H).

Wet
3Wet Braking
Wet braking in meters
Lower is better ↓| Position / Tyre | Result | Gap to best |
|---|---|---|
| 29.2 m | Best | |
RefReference Summer |
30.4 m | +1.20 m |
| 30.4 m | +1.20 m | |
| 30.6 m | +1.40 m | |
| 30.8 m | +1.60 m | |
| 31.2 m | +2.00 m | |
| 31.3 m | +2.10 m | |
| 31.5 m | +2.30 m | |
| 31.5 m | +2.30 m | |
| 31.6 m | +2.40 m | |
| 32 m | +2.80 m | |
| 32 m | +2.80 m | |
| 32.2 m | +3.00 m | |
| 32.2 m | +3.00 m | |
| 32.5 m | +3.30 m | |
| 32.8 m | +3.60 m | |
| 32.9 m | +3.70 m | |
| 33 m | +3.80 m | |
| 33.5 m | +4.30 m | |
| 33.6 m | +4.40 m | |
| 34.2 m | +5.00 m |
The difference between best and worst was 17.1% (5 m ≈ 1.1 Car Lengths).
Wet Handling
Wet Handling Average Speed
Higher is better ↑| Position / Tyre | Result | Gap to best |
|---|---|---|
RefReference Summer |
75.7 km/h | +1.00 km/h |
| 74.7 km/h | Best | |
| 74.3 km/h | -0.40 km/h | |
| 74.1 km/h | -0.60 km/h | |
| 73.7 km/h | -1.00 km/h | |
| 73.1 km/h | -1.60 km/h | |
| 72.8 km/h | -1.90 km/h | |
| 72.6 km/h | -2.10 km/h | |
| 72.5 km/h | -2.20 km/h | |
| 72.5 km/h | -2.20 km/h | |
| 72.4 km/h | -2.30 km/h | |
| 72.3 km/h | -2.40 km/h | |
| 72.1 km/h | -2.60 km/h | |
| 72 km/h | -2.70 km/h | |
| 71.7 km/h | -3.00 km/h | |
| 71.7 km/h | -3.00 km/h | |
| 71.3 km/h | -3.40 km/h | |
| 71.1 km/h | -3.60 km/h | |
| 70.2 km/h | -4.50 km/h | |
| 69.6 km/h | -5.10 km/h | |
| 69.5 km/h | -5.20 km/h |
The difference between best and worst was 8.2% (6.2 Km/H).
Straight Aqua
Float Speed in Km/H
Higher is better ↑| Position / Tyre | Result | Gap to best |
|---|---|---|
| 78 km/h | Best | |
| 76.7 km/h | -1.30 km/h | |
| 75.8 km/h | -2.20 km/h | |
| 74.6 km/h | -3.40 km/h | |
| 74.2 km/h | -3.80 km/h | |
| 73.4 km/h | -4.60 km/h | |
| 73.3 km/h | -4.70 km/h | |
| 72.2 km/h | -5.80 km/h | |
| 71.7 km/h | -6.30 km/h | |
| 71.7 km/h | -6.30 km/h | |
| 70.3 km/h | -7.70 km/h | |
| 70.1 km/h | -7.90 km/h | |
| 69.3 km/h | -8.70 km/h | |
| 68.4 km/h | -9.60 km/h | |
| 68.4 km/h | -9.60 km/h | |
| 68.1 km/h | -9.90 km/h | |
| 66.8 km/h | -11.20 km/h | |
| 66.6 km/h | -11.40 km/h | |
| 65.5 km/h | -12.50 km/h | |
| 62.8 km/h | -15.20 km/h |
The difference between best and worst was 19.5% (15.2 Km/H).
Snow
2Snow Braking
Snow braking in meters
Lower is better ↓| Position / Tyre | Result | Gap to best |
|---|---|---|
| 24 m | Best | |
| 24.1 m | +0.10 m | |
| 24.1 m | +0.10 m | |
| 24.2 m | +0.20 m | |
| 24.3 m | +0.30 m | |
| 24.3 m | +0.30 m | |
| 24.3 m | +0.30 m | |
| 24.3 m | +0.30 m | |
| 24.5 m | +0.50 m | |
| 24.6 m | +0.60 m | |
| 24.6 m | +0.60 m | |
| 24.6 m | +0.60 m | |
| 24.7 m | +0.70 m | |
| 24.7 m | +0.70 m | |
| 24.8 m | +0.80 m | |
| 24.9 m | +0.90 m | |
| 25.1 m | +1.10 m | |
| 25.2 m | +1.20 m | |
| 26 m | +2.00 m | |
| 26.4 m | +2.40 m | |
RefReference Summer |
89.1 m | +65.10 m |
The difference between best and worst was 271.3% (65.1 m ≈ 14.5 Car Lengths).
Snow Handling
Snow handling average speed
Higher is better ↑| Position / Tyre | Result | Gap to best |
|---|---|---|
| 78.4 km/h | Best | |
| 78.4 km/h | Best | |
| 78.3 km/h | -0.10 km/h | |
| 77.8 km/h | -0.60 km/h | |
| 77.6 km/h | -0.80 km/h | |
| 77.4 km/h | -1.00 km/h | |
| 77.3 km/h | -1.10 km/h | |
| 77.3 km/h | -1.10 km/h | |
| 77.3 km/h | -1.10 km/h | |
| 77 km/h | -1.40 km/h | |
| 77 km/h | -1.40 km/h | |
| 77 km/h | -1.40 km/h | |
| 76.9 km/h | -1.50 km/h | |
| 76.6 km/h | -1.80 km/h | |
| 76.5 km/h | -1.90 km/h | |
| 76.4 km/h | -2.00 km/h | |
| 76.3 km/h | -2.10 km/h | |
| 75.6 km/h | -2.80 km/h | |
| 75.3 km/h | -3.10 km/h | |
| 75.3 km/h | -3.10 km/h |
The difference between best and worst was 4% (3.1 Km/H).
Comfort
1Noise
External noise in dB
Lower is better ↓| Position / Tyre | Result | Gap to best |
|---|---|---|
| 68.7 dB | Best | |
| 68.9 dB | +0.20 dB | |
| 69.3 dB | +0.60 dB | |
| 69.6 dB | +0.90 dB | |
RefReference Summer |
69.7 dB | +1.00 dB |
| 69.8 dB | +1.10 dB | |
| 70 dB | +1.30 dB | |
| 70.2 dB | +1.50 dB | |
| 70.3 dB | +1.60 dB | |
| 70.6 dB | +1.90 dB | |
| 71 dB | +2.30 dB | |
| 71.1 dB | +2.40 dB | |
| 71.2 dB | +2.50 dB | |
| 71.6 dB | +2.90 dB | |
| 71.7 dB | +3.00 dB | |
| 72.4 dB | +3.70 dB | |
| 73.3 dB | +4.60 dB | |
| 73.9 dB | +5.20 dB | |
| 74.1 dB | +5.40 dB | |
| 74.5 dB | +5.80 dB | |
| 76.1 dB | +7.40 dB |
The difference between best and worst was 10.8% (7.4 dB).
Value
3Wear
Predicted tread life in KM
Higher is better ↑| Position / Tyre | Result | Gap to best |
|---|---|---|
| 51,250 KM | Best | |
| 45,920 KM | -5,330 KM | |
| 45,100 KM | -6,150 KM | |
| 42,870 KM | -8,380 KM | |
| 42,230 KM | -9,020 KM | |
| 41,820 KM | -9,430 KM | |
| 41,410 KM | -9,840 KM | |
| 41,410 KM | -9,840 KM | |
| 41,410 KM | -9,840 KM | |
| 40,590 KM | -10,660 KM | |
| 40,180 KM | -11,070 KM | |
| 39,970 KM | -11,280 KM | |
| 39,970 KM | -11,280 KM | |
| 39,770 KM | -11,480 KM | |
| 39,360 KM | -11,890 KM | |
| 38,950 KM | -12,300 KM | |
| 38,360 KM | -12,890 KM | |
| 37,310 KM | -13,940 KM | |
| 36,080 KM | -15,170 KM | |
| 35,260 KM | -15,990 KM |
The difference between best and worst was 31.2% (15,990 KM).
Value
Euros/1000km based on cost/wear
Lower is better ↓| Position / Tyre | Result | Gap to best | cost per 1,000 km |
|---|---|---|---|
| 7.62 Price/1000 | Best | €10.64 | |
| 7.67 Price/1000 | +0.05 Price/1000 | €10.92 | |
| 7.88 Price/1000 | +0.26 Price/1000 | €17.28 | |
| 8.31 Price/1000 | +0.69 Price/1000 | €14.73 | |
| 9.25 Price/1000 | +1.63 Price/1000 | €15.14 | |
| 9.33 Price/1000 | +1.71 Price/1000 | €17.61 | |
| 9.5 Price/1000 | +1.88 Price/1000 | €12.61 | |
| 9.66 Price/1000 | +2.04 Price/1000 | €12.70 | |
| 9.66 Price/1000 | +2.04 Price/1000 | €16.11 | |
| 9.93 Price/1000 | +2.31 Price/1000 | €14.05 | |
| 10.15 Price/1000 | +2.53 Price/1000 | €15.56 | |
| 10.25 Price/1000 | +2.63 Price/1000 | €15.14 | |
| 10.35 Price/1000 | +2.73 Price/1000 | €21.43 | |
| 10.71 Price/1000 | +3.09 Price/1000 | €16.18 | |
| 10.87 Price/1000 | +3.25 Price/1000 | €18.03 | |
| 10.89 Price/1000 | +3.27 Price/1000 | €14.83 | |
| 11.25 Price/1000 | +3.63 Price/1000 | €14.75 | |
| 11.57 Price/1000 | +3.95 Price/1000 | €14.52 | |
| 11.64 Price/1000 | +4.02 Price/1000 | €15.75 | |
| 11.69 Price/1000 | +4.07 Price/1000 | €13.39 |
The difference between best and worst was 53.4% (4.07 Price/1000). Over 40,000 km the cheapest tyre to own (Sava Eskimo HP2) works out €432 cheaper than the most expensive (Kumho WinterCraft WP71).
How this is calculated
Assumes a typical car using 8 l/100km (with rolling resistance causing 20% of fuel use), fuel at €1.65 per litre and €70 fitting per set of four. Purchase prices are from the time of the 2019 test; financing costs are excluded.
Rolling Resistance
Rolling resistance in kg t
Lower is better ↓| Position / Tyre | Result | Gap to best | Extra fuel / year |
|---|---|---|---|
| 7.43 kg/t | Best | £0 | |
| 7.77 kg/t | +0.34 kg/t | £20 | |
| 7.78 kg/t | +0.35 kg/t | £21 | |
| 7.8 kg/t | +0.37 kg/t | £22 | |
| 7.81 kg/t | +0.38 kg/t | £23 | |
| 7.85 kg/t | +0.42 kg/t | £25 | |
| 7.95 kg/t | +0.52 kg/t | £31 | |
| 8.04 kg/t | +0.61 kg/t | £36 | |
| 8.11 kg/t | +0.68 kg/t | £40 | |
| 8.11 kg/t | +0.68 kg/t | £40 | |
| 8.28 kg/t | +0.85 kg/t | £50 | |
| 8.44 kg/t | +1.01 kg/t | £60 | |
| 8.56 kg/t | +1.13 kg/t | £67 | |
| 8.57 kg/t | +1.14 kg/t | £68 | |
| 8.77 kg/t | +1.34 kg/t | £79 | |
| 8.8 kg/t | +1.37 kg/t | £81 | |
| 8.97 kg/t | +1.54 kg/t | £91 | |
| 9.29 kg/t | +1.86 kg/t | £110 | |
RefReference Summer |
9.3 kg/t | +1.87 kg/t | £111 |
| 9.59 kg/t | +2.16 kg/t | £128 | |
| 9.99 kg/t | +2.56 kg/t | £152 |
The difference between best and worst was 34.5% (2.56 kg / t). Over 19,000 km a year at £1.45/L, the Kumho WinterCraft WP71 uses about 105 L (£152) more fuel than the Nokian WR Snowproof.
Adjust the assumptions
Calculated estimates, not additional measurements. Use the controls to explore the assumptions. These calculators use the full test field, independently of your tyre selection above.
More tyre tests
Cross-check this test
Where these tyres were tested again, and how the verdict held up.
2019 Winter Tyre Test Market Overview
225/45 R1747 tyres tested
20 of these 20 tyres tested again
2020 Winter Tyre Market Overview - 52 Tyre Braking Test
245/45 R1848 tyres tested
14 of these 20 tyres tested again
2017 50 Winter Tyre Shoot Out
225/50 R1745 tyres tested
12 of these 20 tyres tested again