



The 2018 Gute Fahrt test is a confusing tyre test for a number of reasons. Firstly is tests both summer and all season tyres in the same dry and wet tests, but fails to include the all season class leading Michelin CrossClimate or cover the all season tyres snow performance.
Secondly, even though it is testing the very popular 205/55 R16 tyre size, it uses some strange / old tyre patterns, ie the Bridgestone Turanza T001 which has now been replaced twice, and the Continental EcoContact 5 instead of Premium Contact 5.
Thirdly, it doesn't give any dry and wet handling times or data, it just rates the tyres "very good, good and ok" which doesn't really give much insight, and lastly the tyre with the best overall braking result, the Hankook Ventus Prime 3 was placed seventh overall.
It's debatable as to whether this should be published at all on Tyre Reviews, but it does give some interesting data on how the all season tyres compare to the summer tyres during dry and wet braking, so it was worth inclusion.
If you want to try and make more sense of it, feel free to head over to the Gute Fahrt website and see the full data.
Dry
Dry Braking
Dry braking in meters
Lower is better ↓| Position / Tyre | Result | Gap to best |
|---|---|---|
| 35.3 m | Best | |
| 35.6 m | +0.30 m | |
| 36.3 m | +1.00 m | |
| 36.5 m | +1.20 m | |
| 37 m | +1.70 m | |
| 37.2 m | +1.90 m | |
| 37.2 m | +1.90 m | |
| 37.4 m | +2.10 m | |
| 37.9 m | +2.60 m | |
| 40.4 m | +5.10 m | |
| 41.2 m | +5.90 m | |
| 42.7 m | +7.40 m |
The difference between best and worst was 21% (7.4 m ≈ 1.6 Car Lengths).
Wet
Wet Braking
Wet braking in meters
Lower is better ↓| Position / Tyre | Result | Gap to best |
|---|---|---|
| 42.5 m | Best | |
| 43.4 m | +0.90 m | |
| 44 m | +1.50 m | |
| 44.6 m | +2.10 m | |
| 44.8 m | +2.30 m | |
| 44.8 m | +2.30 m | |
| 45.1 m | +2.60 m | |
| 47.3 m | +4.80 m | |
| 47.9 m | +5.40 m | |
| 48.4 m | +5.90 m | |
| 49 m | +6.50 m | |
| 51.7 m | +9.20 m |
The difference between best and worst was 21.6% (9.2 m ≈ 2 Car Lengths).
Straight Aqua
Float Speed in Km/H
Higher is better ↑| Position / Tyre | Result | Gap to best |
|---|---|---|
| 81.9 km/h | Best | |
| 80.8 km/h | -1.10 km/h | |
| 80.7 km/h | -1.20 km/h | |
| 79.9 km/h | -2.00 km/h | |
| 79.6 km/h | -2.30 km/h | |
| 78.7 km/h | -3.20 km/h | |
| 77.5 km/h | -4.40 km/h | |
| 77.3 km/h | -4.60 km/h | |
| 75.4 km/h | -6.50 km/h | |
| 75.3 km/h | -6.60 km/h | |
| 74 km/h | -7.90 km/h | |
| 71.5 km/h | -10.40 km/h |
The difference between best and worst was 12.7% (10.4 Km/H).

Environment
Rolling Resistance
Rolling resistance in kg t
Lower is better ↓| Position / Tyre | Result | Gap to best | Extra fuel / year |
|---|---|---|---|
| 0.93 kg/t | Best | £0 | |
| 0.94 kg/t | +0.01 kg/t | £5 | |
| 0.95 kg/t | +0.02 kg/t | £9 | |
| 0.97 kg/t | +0.04 kg/t | £19 | |
| 1.05 kg/t | +0.12 kg/t | £57 | |
| 1.07 kg/t | +0.14 kg/t | £66 | |
| 1.12 kg/t | +0.19 kg/t | £90 | |
| 1.12 kg/t | +0.19 kg/t | £90 | |
| 1.14 kg/t | +0.21 kg/t | £100 | |
| 1.15 kg/t | +0.22 kg/t | £104 | |
| 1.16 kg/t | +0.23 kg/t | £109 | |
| 1.16 kg/t | +0.23 kg/t | £109 |
The difference between best and worst was 24.7% (0.23 kg / t). Over 19,000 km a year at £1.45/L, the Nexen N Blue HD Plus uses about 75 L (£109) more fuel than the Continental Eco Contact 5.
Adjust the assumptions
Calculated estimates, not additional measurements. Use the controls to explore the assumptions.
Results
Goodyear EfficientGrip Performance
205/55 R16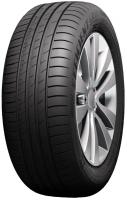
Continental AllSeasonContact
205/55 R16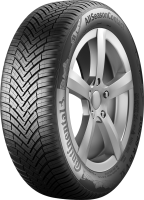
Pirelli Cinturato P7 Blue
205/55 R16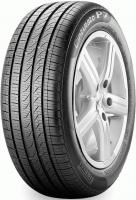
Goodyear Vector 4 Seasons Gen 2
205/55 R16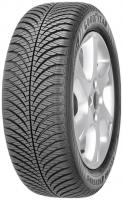
Bridgestone Turanza T001
205/55 R16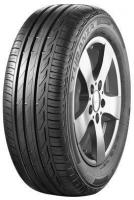
Fulda MultiControl
205/55 R16
Firestone RoadHawk
205/55 R16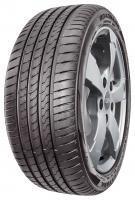
Continental Eco Contact 5
205/55 R16
Dunlop Sport BluResponse
205/55 R16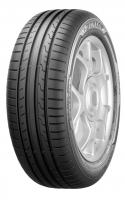
Hankook Ventus Prime 3 K125
205/55 R16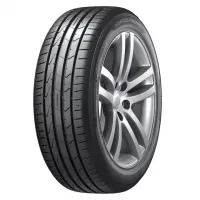
Nexen N Blue HD+
205/55 R16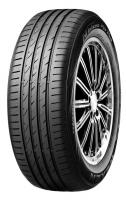
Laufenn S fit EQ
205/55 R16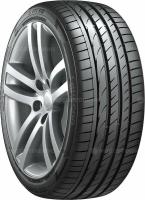
How GOODYEAR in none of these tables is on the first place, but at the final has best results?
We don't know sadly!
I'm asking because, i'm going to buy these tyres, but now I have to think a little bit more..