

Test setup & methodology
The test setting, the conditions recorded and how the results contribute to the score.
Recorded test conditions
Recorded test conditions
- Dry Braking
- 100 → 0 km/h
- Wet Braking
- 100 → 0 km/h
The Best in Test
The Goodyear EfficientGrip Performance 2 won the test by combining good grip in the dry and wet, very low rolling resistance and the best wear on test. Even though it wasn't the cheapest tyre, when AutoBild divided the purchase price by the projected mileage it also proved to be the best value tyre on test, a very impressive showing from Goodyear.
Hankook will be pleased with a second place overall for the new Prime 4. The Prime 3 often had high wear, but the Prime 4 was excellent in the wear test, one of the best tyres in the dry and very good in the wet.
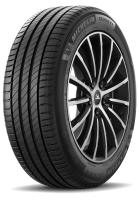
It seems impossible to keep the Michelin Primacy 4 away from the podium of a test, with the French tyre finishing third overall with low wear and a very low rolling resistance as its standout qualities, but thanks to its high purchase price, its calculated value was 20% lower than the Goodyears.
The other notiable inclusion in this test was the ultra low rolling resistance Continental EcoContact 6. Due to the way tyre tests work, this tyre was never going to do well overall thanks to lower levels of wet grip, but the Continental eco tyre did prove to have a significant advantage in rolling resistance, reasonable grip in the dry and wet (remember it beat thirty other tyres in dry and wet braking to get to this test) and surprisingly good levels of wear. If you're looking for a tyre to save petrol, this might be the one for you, but it's definitely not great for sporty handling.
As for the all season tyre, it was the worst in dry braking which was no surprise, but also the worst in both aquaplaning tests, mid pack in dry and wet handling, and mid-pack for rolling resistance. Given this is the only tyre which would offer any sort of grip in snow, it's a fairly impressive result.
Below is the exhaustive data, and be sure to check out the full test on the AutoBild website!
Dry
The new Kumho and Nokian led the way in dry braking, with Bridgestone and Hankook tied behind them.
Dry Braking
Dry braking in meters (100 - 0 km/h)
Lower is better ↓| Position / Tyre | Result | Gap to best | Residual speed |
|---|---|---|---|
| 35.7 m | Best | 0 km/h | |
| 35.7 m | Best | 0 km/h | |
| 35.8 m | +0.10 m | 7 km/h | |
| 35.8 m | +0.10 m | 7 km/h | |
| 35.9 m | +0.20 m | 10 km/h | |
| 36.1 m | +0.40 m | 14 km/h | |
| 36.1 m | +0.40 m | 14 km/h | |
| 36.2 m | +0.50 m | 15 km/h | |
| 36.2 m | +0.50 m | 15 km/h | |
| 36.3 m | +0.60 m | 17 km/h | |
| 36.3 m | +0.60 m | 17 km/h | |
| 36.4 m | +0.70 m | 18 km/h | |
| 36.5 m | +0.80 m | 19 km/h | |
| 36.5 m | +0.80 m | 19 km/h | |
| 36.5 m | +0.80 m | 19 km/h | |
| 36.5 m | +0.80 m | 19 km/h | |
| 36.8 m | +1.10 m | 22 km/h | |
| 37 m | +1.30 m | 24 km/h | |
| 37.2 m | +1.50 m | 26 km/h | |
| 37.3 m | +1.60 m | 27 km/h | |
| 37.3 m | +1.60 m | 27 km/h | |
RefReference All Season |
40.9 m | +5.20 m | 46 km/h |
The difference between best and worst was 14.6% (5.2 m ≈ 1.2 Car Lengths). From 130 km/h, the Maxxis Premitra HP5 would still be travelling at 27 km/h when the Kumho Ecsta HS52 had stopped.
Residual speed is calculated from the measured braking distances, assuming constant deceleration; it is not a separate measurement.
Hankook led the dry handling lap with the fastest average speed, and Michelin was the best of the rest.
Dry Handling
Dry Handling Average Speed
Higher is better ↑| Position / Tyre | Result | Gap to best |
|---|---|---|
| 96 km/h | Best | |
| 95.6 km/h | -0.40 km/h | |
| 95.4 km/h | -0.60 km/h | |
| 95.2 km/h | -0.80 km/h | |
| 95.2 km/h | -0.80 km/h | |
| 95.1 km/h | -0.90 km/h | |
| 95 km/h | -1.00 km/h | |
| 95 km/h | -1.00 km/h | |
| 95 km/h | -1.00 km/h | |
| 95 km/h | -1.00 km/h | |
RefReference All Season |
94.8 km/h | -1.20 km/h |
| 94.7 km/h | -1.30 km/h | |
| 94.7 km/h | -1.30 km/h | |
| 94.5 km/h | -1.50 km/h | |
| 94.4 km/h | -1.60 km/h | |
| 94.2 km/h | -1.80 km/h | |
| 94.2 km/h | -1.80 km/h | |
| 94.1 km/h | -1.90 km/h | |
| 94.1 km/h | -1.90 km/h | |
| 94 km/h | -2.00 km/h | |
| 93.9 km/h | -2.10 km/h | |
| 93.8 km/h | -2.20 km/h |
All the tyres in the Dry Handling test finished less than 3% apart.
Wet
The Bridgestone Turanza T005 consistently leads wet braking testing, and once again it was the best tyre in the test. The new Hankook again placed well, with Falken and Vredestein close behind.
Wet Braking
Wet braking in meters (100 - 0 km/h)
Lower is better ↓| Position / Tyre | Result | Gap to best | Residual speed |
|---|---|---|---|
| 43 m | Best | 0 km/h | |
| 43.5 m | +0.50 m | 14 km/h | |
| 43.6 m | +0.60 m | 15 km/h | |
| 44 m | +1.00 m | 20 km/h | |
| 44.7 m | +1.70 m | 25 km/h | |
| 44.7 m | +1.70 m | 25 km/h | |
| 45 m | +2.00 m | 27 km/h | |
| 45.2 m | +2.20 m | 29 km/h | |
| 45.2 m | +2.20 m | 29 km/h | |
| 45.8 m | +2.80 m | 32 km/h | |
| 45.9 m | +2.90 m | 33 km/h | |
| 46.3 m | +3.30 m | 35 km/h | |
| 46.4 m | +3.40 m | 35 km/h | |
| 46.4 m | +3.40 m | 35 km/h | |
| 46.5 m | +3.50 m | 36 km/h | |
| 46.5 m | +3.50 m | 36 km/h | |
| 46.7 m | +3.70 m | 37 km/h | |
| 48.5 m | +5.50 m | 44 km/h | |
| 48.9 m | +5.90 m | 45 km/h | |
RefReference All Season |
49.9 m | +6.90 m | 48 km/h |
| 51 m | +8.00 m | 51 km/h | |
| 51.1 m | +8.10 m | 52 km/h |
The difference between best and worst was 18.8% (8.1 m ≈ 1.8 Car Lengths). From 130 km/h, the Continental EcoContact 6 would still be travelling at 52 km/h when the Bridgestone Turanza T005 had stopped.
Residual speed is calculated from the measured braking distances, assuming constant deceleration; it is not a separate measurement.
Bridgestone again led the wet in wet handling, with Hankook and this time Nokian rounding out the top three.
Wet Handling
Wet Handling Average Speed
Higher is better ↑| Position / Tyre | Result | Gap to best |
|---|---|---|
| 74.9 km/h | Best | |
| 74.5 km/h | -0.40 km/h | |
| 74.4 km/h | -0.50 km/h | |
| 74.3 km/h | -0.60 km/h | |
| 74.3 km/h | -0.60 km/h | |
| 74 km/h | -0.90 km/h | |
| 73.6 km/h | -1.30 km/h | |
RefReference All Season |
73.6 km/h | -1.30 km/h |
| 73.5 km/h | -1.40 km/h | |
| 73.4 km/h | -1.50 km/h | |
| 73.4 km/h | -1.50 km/h | |
| 73.2 km/h | -1.70 km/h | |
| 73.1 km/h | -1.80 km/h | |
| 73 km/h | -1.90 km/h | |
| 72.6 km/h | -2.30 km/h | |
| 72.4 km/h | -2.50 km/h | |
| 72.3 km/h | -2.60 km/h | |
| 72.1 km/h | -2.80 km/h | |
| 72.1 km/h | -2.80 km/h | |
| 71.6 km/h | -3.30 km/h | |
| 70.9 km/h | -4.00 km/h | |
| 67.7 km/h | -7.20 km/h |
The difference between best and worst was 9.6% (7.2 Km/H).
Wet circle roughly mirrored wet handling.
Wet Circle
Lateral wet grip in m/s squared
Higher is better ↑| Position / Tyre | Result | Gap to best |
|---|---|---|
| 6.74 m/s | Best | |
| 6.64 m/s | -0.10 m/s | |
| 6.61 m/s | -0.13 m/s | |
| 6.59 m/s | -0.15 m/s | |
| 6.49 m/s | -0.25 m/s | |
| 6.43 m/s | -0.31 m/s | |
| 6.38 m/s | -0.36 m/s | |
| 6.34 m/s | -0.40 m/s | |
| 6.29 m/s | -0.45 m/s | |
| 6.27 m/s | -0.47 m/s | |
RefReference All Season |
6.25 m/s | -0.49 m/s |
| 6.23 m/s | -0.51 m/s | |
| 6.23 m/s | -0.51 m/s | |
| 6.2 m/s | -0.54 m/s | |
| 6.19 m/s | -0.55 m/s | |
| 6.16 m/s | -0.58 m/s | |
| 6.11 m/s | -0.63 m/s | |
| 6.01 m/s | -0.73 m/s | |
| 5.97 m/s | -0.77 m/s | |
| 5.94 m/s | -0.80 m/s | |
| 5.88 m/s | -0.86 m/s | |
| 5.68 m/s | -1.06 m/s |
The difference between best and worst was 15.7% (1.06 m/s).
There were varying results for the two aquaplaning tests.
Straight Aqua
Float Speed in Km/H
Higher is better ↑| Position / Tyre | Result | Gap to best |
|---|---|---|
| 88.2 km/h | Best | |
| 88.1 km/h | -0.10 km/h | |
| 87.9 km/h | -0.30 km/h | |
| 87.3 km/h | -0.90 km/h | |
| 86.4 km/h | -1.80 km/h | |
| 86.4 km/h | -1.80 km/h | |
| 86 km/h | -2.20 km/h | |
| 86 km/h | -2.20 km/h | |
| 85.6 km/h | -2.60 km/h | |
| 85.6 km/h | -2.60 km/h | |
| 84.8 km/h | -3.40 km/h | |
| 84.4 km/h | -3.80 km/h | |
| 84.3 km/h | -3.90 km/h | |
| 83.8 km/h | -4.40 km/h | |
| 83.7 km/h | -4.50 km/h | |
| 83.6 km/h | -4.60 km/h | |
| 82.6 km/h | -5.60 km/h | |
| 82.2 km/h | -6.00 km/h | |
| 81.6 km/h | -6.60 km/h | |
| 81.5 km/h | -6.70 km/h | |
| 80.4 km/h | -7.80 km/h | |
RefReference All Season |
79.8 km/h | -8.40 km/h |
The difference between best and worst was 9.5% (8.4 Km/H).
Curved Aquaplaning
Remaining lateral acceleration
Higher is better ↑| Position / Tyre | Result | Gap to best |
|---|---|---|
| 4.85 m/sec2 | Best | |
| 4.83 m/sec2 | -0.02 m/sec2 | |
| 4.59 m/sec2 | -0.26 m/sec2 | |
| 4.54 m/sec2 | -0.31 m/sec2 | |
| 4.53 m/sec2 | -0.32 m/sec2 | |
| 4.51 m/sec2 | -0.34 m/sec2 | |
| 4.47 m/sec2 | -0.38 m/sec2 | |
| 4.45 m/sec2 | -0.40 m/sec2 | |
| 4.37 m/sec2 | -0.48 m/sec2 | |
| 4.34 m/sec2 | -0.51 m/sec2 | |
| 4.28 m/sec2 | -0.57 m/sec2 | |
| 4.27 m/sec2 | -0.58 m/sec2 | |
| 4.17 m/sec2 | -0.68 m/sec2 | |
| 4.15 m/sec2 | -0.70 m/sec2 | |
| 4.14 m/sec2 | -0.71 m/sec2 | |
| 4.12 m/sec2 | -0.73 m/sec2 | |
| 3.98 m/sec2 | -0.87 m/sec2 | |
| 3.97 m/sec2 | -0.88 m/sec2 | |
| 3.87 m/sec2 | -0.98 m/sec2 | |
| 3.75 m/sec2 | -1.10 m/sec2 | |
| 3.68 m/sec2 | -1.17 m/sec2 | |
RefReference All Season |
3.64 m/sec2 | -1.21 m/sec2 |
The difference between best and worst was 24.9% (1.21 m/sec2).

Wear
The test winning Goodyear had a huge lead in wear, with Michelina and Continental rounding out the top three.
Wear
Predicted tread life in KM
Higher is better ↑| Position / Tyre | Result | Gap to best |
|---|---|---|
| 51,340 KM | Best | |
| 44,880 KM | -6,460 KM | |
| 41,480 KM | -9,860 KM | |
| 40,800 KM | -10,540 KM | |
| 39,440 KM | -11,900 KM | |
| 36,380 KM | -14,960 KM | |
| 35,360 KM | -15,980 KM | |
| 35,020 KM | -16,320 KM | |
| 34,340 KM | -17,000 KM | |
| 32,980 KM | -18,360 KM | |
| 31,960 KM | -19,380 KM | |
| 31,960 KM | -19,380 KM | |
| 31,620 KM | -19,720 KM | |
| 31,280 KM | -20,060 KM | |
| 30,600 KM | -20,740 KM | |
| 29,240 KM | -22,100 KM | |
| 27,880 KM | -23,460 KM | |
| 27,540 KM | -23,800 KM | |
| 27,200 KM | -24,140 KM | |
| 26,860 KM | -24,480 KM | |
| 25,840 KM | -25,500 KM |
The difference between best and worst was 49.7% (25,500 KM).
Value is calculated by dividing the purchase price of the tyres by the projected mileage then giving a Euros per 1000km figure.
Value
Euros/1000km based on cost/wear
Lower is better ↓| Position / Tyre | Result | Gap to best | cost per 1,000 km |
|---|---|---|---|
| 10.42 Price/1000 | Best | €18.33 | |
| 10.65 Price/1000 | +0.23 Price/1000 | €25.51 | |
| 11.17 Price/1000 | +0.75 Price/1000 | €29.04 | |
| 11.64 Price/1000 | +1.22 Price/1000 | €21.06 | |
| 12.02 Price/1000 | +1.60 Price/1000 | €31.12 | |
| 12.02 Price/1000 | +1.60 Price/1000 | €25.83 | |
| 12.09 Price/1000 | +1.67 Price/1000 | €26.84 | |
| 12.59 Price/1000 | +2.17 Price/1000 | €19.44 | |
| 12.89 Price/1000 | +2.47 Price/1000 | €30.46 | |
| 13.19 Price/1000 | +2.77 Price/1000 | €27.75 | |
| 13.24 Price/1000 | +2.82 Price/1000 | €26.06 | |
| 13.27 Price/1000 | +2.85 Price/1000 | €25.29 | |
| 13.27 Price/1000 | +2.85 Price/1000 | €30.40 | |
| 13.33 Price/1000 | +2.91 Price/1000 | €30.43 | |
| 13.92 Price/1000 | +3.50 Price/1000 | €29.43 | |
| 13.98 Price/1000 | +3.56 Price/1000 | €15.67 | |
| 14.19 Price/1000 | +3.77 Price/1000 | €28.42 | |
| 14.56 Price/1000 | +4.14 Price/1000 | €28.16 | |
| 15.96 Price/1000 | +5.54 Price/1000 | €23.95 | |
| 16.73 Price/1000 | +6.31 Price/1000 | €31.97 | |
| 18.58 Price/1000 | +8.16 Price/1000 | €34.55 |
The difference between best and worst was 78.3% (8.16 Price/1000). Over 40,000 km the cheapest tyre to own (Continental EcoContact 6) works out €755 cheaper than the most expensive (Nokian PowerProof).
How this is calculated
Assumes a typical car using 8 l/100km (with rolling resistance causing 20% of fuel use), fuel at €1.65 per litre and €70 fitting per set of four. Purchase prices are from the time of the 2022 test; financing costs are excluded.
Environment
The eco bias Continental had a good lead in the rolling resistance test, with Michelin, Bridgestone and Goodyear the best of the "regular" tyres.
Rolling Resistance
Rolling resistance in kg t
Lower is better ↓| Position / Tyre | Result | Gap to best | Extra fuel / year |
|---|---|---|---|
| 5.69 kg/t | Best | £0 | |
| 6.83 kg/t | +1.14 kg/t | £88 | |
| 6.94 kg/t | +1.25 kg/t | £97 | |
| 7.1 kg/t | +1.41 kg/t | £109 | |
| 7.35 kg/t | +1.66 kg/t | £129 | |
| 7.8 kg/t | +2.11 kg/t | £163 | |
| 7.96 kg/t | +2.27 kg/t | £176 | |
| 8.19 kg/t | +2.50 kg/t | £194 | |
| 8.19 kg/t | +2.50 kg/t | £194 | |
| 8.24 kg/t | +2.55 kg/t | £198 | |
| 8.37 kg/t | +2.68 kg/t | £208 | |
| 8.42 kg/t | +2.73 kg/t | £211 | |
| 8.43 kg/t | +2.74 kg/t | £212 | |
| 8.51 kg/t | +2.82 kg/t | £218 | |
| 8.55 kg/t | +2.86 kg/t | £222 | |
| 8.56 kg/t | +2.87 kg/t | £222 | |
RefReference All Season |
8.8 kg/t | +3.11 kg/t | £241 |
| 8.84 kg/t | +3.15 kg/t | £244 | |
| 8.93 kg/t | +3.24 kg/t | £251 | |
| 8.96 kg/t | +3.27 kg/t | £253 | |
| 8.98 kg/t | +3.29 kg/t | £255 | |
| 9.38 kg/t | +3.69 kg/t | £286 |
The difference between best and worst was 64.9% (3.69 kg / t). Over 19,000 km a year at £1.45/L, the Falken ZIEX ZE310 EcoRun uses about 197 L (£286) more fuel than the Continental EcoContact 6.
Adjust the assumptions
Calculated estimates, not additional measurements. Use the controls to explore the assumptions.
Autobild conducted external noise testing at 50 km/h and 80 km/h, these are the results from 50 km/h.
Noise
External noise in dB
Lower is better ↓| Position / Tyre | Result | Gap to best |
|---|---|---|
| 67.1 dB | Best | |
| 67.8 dB | +0.70 dB | |
| 68.1 dB | +1.00 dB | |
| 68.3 dB | +1.20 dB | |
| 68.4 dB | +1.30 dB | |
| 68.5 dB | +1.40 dB | |
| 68.6 dB | +1.50 dB | |
| 68.6 dB | +1.50 dB | |
| 68.8 dB | +1.70 dB | |
| 68.8 dB | +1.70 dB | |
| 68.9 dB | +1.80 dB | |
| 68.9 dB | +1.80 dB | |
| 69 dB | +1.90 dB | |
| 69 dB | +1.90 dB | |
| 69.1 dB | +2.00 dB | |
| 69.2 dB | +2.10 dB | |
| 69.4 dB | +2.30 dB | |
RefReference All Season |
69.7 dB | +2.60 dB |
| 69.7 dB | +2.60 dB | |
| 69.7 dB | +2.60 dB | |
| 69.8 dB | +2.70 dB | |
| 70.1 dB | +3.00 dB |
The difference between best and worst was 4.5% (3 dB).
Results
Goodyear EfficientGrip Performance 2
215/55 R17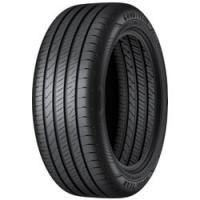
Category scores (% of best)
All discipline results (11)
Discipline positions compare the ranked tyres in this test, not the whole market. These are individual measurements, not weighted overall scores.
| Test | Position in discipline | Result | Gap to best |
|---|---|---|---|
| Dry BrakingLower is better | 17th / 21 | 36.8 m | +1.10 m |
| Dry HandlingHigher is better | 7th / 21 | 95 km/h | -1.00 km/h |
| Wet BrakingLower is better | 13th / 21 | 46.4 m | +3.40 m |
| Wet HandlingHigher is better | 4th / 21 | 74.3 km/h | -0.60 km/h |
| Wet CircleHigher is better | 2nd / 21 | 6.64 m/s | -0.10 m/s |
| Straight AquaHigher is better | 17th / 21 | 82.6 km/h | -5.60 km/h |
| Curved AquaplaningHigher is better | 4th / 21 | 4.54 m/sec2 | -0.31 m/sec2 |
| NoiseLower is better | 9th / 21 | 68.8 dB | +1.70 dB |
| WearHigher is better | 1st / 21 | 51340 KM | Best in this discipline |
| ValueLower is better | 1st / 21 | 10.42 Price/1000 | Best in this discipline |
| Rolling ResistanceLower is better | 4th / 21 | 7.1 kg/t | +1.41 kg/t |
- Price
- 535.00
Hankook Ventus Prime 4
215/55 R17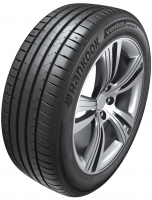
Category scores (% of best)
All discipline results (11)
Discipline positions compare the ranked tyres in this test, not the whole market. These are individual measurements, not weighted overall scores.
| Test | Position in discipline | Result | Gap to best |
|---|---|---|---|
| Dry BrakingLower is better | 3rd / 21 | 35.8 m | +0.10 m |
| Dry HandlingHigher is better | 1st / 21 | 96 km/h | Best in this discipline |
| Wet BrakingLower is better | 2nd / 21 | 43.5 m | +0.50 m |
| Wet HandlingHigher is better | 2nd / 21 | 74.5 km/h | -0.40 km/h |
| Wet CircleHigher is better | 4th / 21 | 6.59 m/s | -0.15 m/s |
| Straight AquaHigher is better | 13th / 21 | 84.3 km/h | -3.90 km/h |
| Curved AquaplaningHigher is better | 17th / 21 | 3.98 m/sec2 | -0.87 m/sec2 |
| NoiseLower is better | 7th / 21 | 68.6 dB | +1.50 dB |
| WearHigher is better | 4th / 21 | 40800 KM | -10,540.00 KM |
| ValueLower is better | 4th / 21 | 11.64 Price/1000 | +1.22 Price/1000 |
| Rolling ResistanceLower is better | 5th / 21 | 7.35 kg/t | +1.66 kg/t |
- Price
- 475.00
Michelin Primacy 4
215/55 R17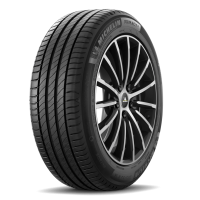
Category scores (% of best)
All discipline results (11)
Discipline positions compare the ranked tyres in this test, not the whole market. These are individual measurements, not weighted overall scores.
| Test | Position in discipline | Result | Gap to best |
|---|---|---|---|
| Dry BrakingLower is better | 8th / 21 | 36.2 m | +0.50 m |
| Dry HandlingHigher is better | 2nd / 21 | 95.6 km/h | -0.40 km/h |
| Wet BrakingLower is better | 10th / 21 | 45.8 m | +2.80 m |
| Wet HandlingHigher is better | 13th / 21 | 73 km/h | -1.90 km/h |
| Wet CircleHigher is better | 13th / 21 | 6.2 m/s | -0.54 m/s |
| Straight AquaHigher is better | 5th / 21 | 86.4 km/h | -1.80 km/h |
| Curved AquaplaningHigher is better | 14th / 21 | 4.15 m/sec2 | -0.70 m/sec2 |
| NoiseLower is better | 4th / 21 | 68.3 dB | +1.20 dB |
| WearHigher is better | 2nd / 21 | 44880 KM | -6,460.00 KM |
| ValueLower is better | 8th / 21 | 12.59 Price/1000 | +2.17 Price/1000 |
| Rolling ResistanceLower is better | 2nd / 21 | 6.83 kg/t | +1.14 kg/t |
- Price
- 565.00
Bridgestone Turanza T005
215/55 R17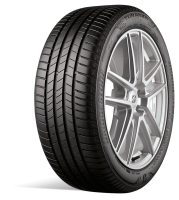
Category scores (% of best)
All discipline results (11)
Discipline positions compare the ranked tyres in this test, not the whole market. These are individual measurements, not weighted overall scores.
| Test | Position in discipline | Result | Gap to best |
|---|---|---|---|
| Dry BrakingLower is better | 3rd / 21 | 35.8 m | +0.10 m |
| Dry HandlingHigher is better | 4th / 21 | 95.2 km/h | -0.80 km/h |
| Wet BrakingLower is better | 1st / 21 | 43 m | Best in this discipline |
| Wet HandlingHigher is better | 1st / 21 | 74.9 km/h | Best in this discipline |
| Wet CircleHigher is better | 1st / 21 | 6.74 m/s | Best in this discipline |
| Straight AquaHigher is better | 12th / 21 | 84.4 km/h | -3.80 km/h |
| Curved AquaplaningHigher is better | 7th / 21 | 4.47 m/sec2 | -0.38 m/sec2 |
| NoiseLower is better | 11th / 21 | 68.9 dB | +1.80 dB |
| WearHigher is better | 11th / 21 | 31960 KM | -19,380.00 KM |
| ValueLower is better | 19th / 21 | 15.96 Price/1000 | +5.54 Price/1000 |
| Rolling ResistanceLower is better | 3rd / 21 | 6.94 kg/t | +1.25 kg/t |
- Price
- 510.00
Falken ZIEX ZE310 EcoRun
215/55 R17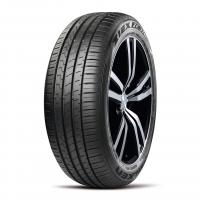
Category scores (% of best)
All discipline results (11)
Discipline positions compare the ranked tyres in this test, not the whole market. These are individual measurements, not weighted overall scores.
| Test | Position in discipline | Result | Gap to best |
|---|---|---|---|
| Dry BrakingLower is better | 13th / 21 | 36.5 m | +0.80 m |
| Dry HandlingHigher is better | 4th / 21 | 95.2 km/h | -0.80 km/h |
| Wet BrakingLower is better | 3rd / 21 | 43.6 m | +0.60 m |
| Wet HandlingHigher is better | 8th / 21 | 73.5 km/h | -1.40 km/h |
| Wet CircleHigher is better | 3rd / 21 | 6.61 m/s | -0.13 m/s |
| Straight AquaHigher is better | 1st / 21 | 88.2 km/h | Best in this discipline |
| Curved AquaplaningHigher is better | 5th / 21 | 4.53 m/sec2 | -0.32 m/sec2 |
| NoiseLower is better | 5th / 21 | 68.4 dB | +1.30 dB |
| WearHigher is better | 7th / 21 | 35360 KM | -15,980.00 KM |
| ValueLower is better | 5th / 21 | 12.02 Price/1000 | +1.60 Price/1000 |
| Rolling ResistanceLower is better | 21st / 21 | 9.38 kg/t | +3.69 kg/t |
- Price
- 425.00
Kumho Ecsta HS52
215/55 R17
Category scores (% of best)
All discipline results (11)
Discipline positions compare the ranked tyres in this test, not the whole market. These are individual measurements, not weighted overall scores.
| Test | Position in discipline | Result | Gap to best |
|---|---|---|---|
| Dry BrakingLower is better | 1st / 21 | 35.7 m | Best in this discipline |
| Dry HandlingHigher is better | 11th / 21 | 94.7 km/h | -1.30 km/h |
| Wet BrakingLower is better | 5th / 21 | 44.7 m | +1.70 m |
| Wet HandlingHigher is better | 14th / 21 | 72.6 km/h | -2.30 km/h |
| Wet CircleHigher is better | 15th / 21 | 6.16 m/s | -0.58 m/s |
| Straight AquaHigher is better | 16th / 21 | 83.6 km/h | -4.60 km/h |
| Curved AquaplaningHigher is better | 18th / 21 | 3.97 m/sec2 | -0.88 m/sec2 |
| NoiseLower is better | 7th / 21 | 68.6 dB | +1.50 dB |
| WearHigher is better | 5th / 21 | 39440 KM | -11,900.00 KM |
| ValueLower is better | 2nd / 21 | 10.65 Price/1000 | +0.23 Price/1000 |
| Rolling ResistanceLower is better | 14th / 21 | 8.51 kg/t | +2.82 kg/t |
- Price
- 420.00
Sava Intensa UHP 2
215/55 R17
Category scores (% of best)
All discipline results (11)
Discipline positions compare the ranked tyres in this test, not the whole market. These are individual measurements, not weighted overall scores.
| Test | Position in discipline | Result | Gap to best |
|---|---|---|---|
| Dry BrakingLower is better | 10th / 21 | 36.3 m | +0.60 m |
| Dry HandlingHigher is better | 6th / 21 | 95.1 km/h | -0.90 km/h |
| Wet BrakingLower is better | 15th / 21 | 46.5 m | +3.50 m |
| Wet HandlingHigher is better | 11th / 21 | 73.2 km/h | -1.70 km/h |
| Wet CircleHigher is better | 9th / 21 | 6.29 m/s | -0.45 m/s |
| Straight AquaHigher is better | 9th / 21 | 85.6 km/h | -2.60 km/h |
| Curved AquaplaningHigher is better | 6th / 21 | 4.51 m/sec2 | -0.34 m/sec2 |
| NoiseLower is better | 16th / 21 | 69.2 dB | +2.10 dB |
| WearHigher is better | 13th / 21 | 31620 KM | -19,720.00 KM |
| ValueLower is better | 5th / 21 | 12.02 Price/1000 | +1.60 Price/1000 |
| Rolling ResistanceLower is better | 8th / 21 | 8.19 kg/t | +2.50 kg/t |
- Price
- 380.00
Dunlop SportMaxx RT 2
215/55 R17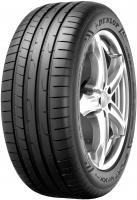
Category scores (% of best)
All discipline results (11)
Discipline positions compare the ranked tyres in this test, not the whole market. These are individual measurements, not weighted overall scores.
| Test | Position in discipline | Result | Gap to best |
|---|---|---|---|
| Dry BrakingLower is better | 6th / 21 | 36.1 m | +0.40 m |
| Dry HandlingHigher is better | 17th / 21 | 94.1 km/h | -1.90 km/h |
| Wet BrakingLower is better | 7th / 21 | 45 m | +2.00 m |
| Wet HandlingHigher is better | 6th / 21 | 74 km/h | -0.90 km/h |
| Wet CircleHigher is better | 5th / 21 | 6.49 m/s | -0.25 m/s |
| Straight AquaHigher is better | 2nd / 21 | 88.1 km/h | -0.10 km/h |
| Curved AquaplaningHigher is better | 9th / 21 | 4.37 m/sec2 | -0.48 m/sec2 |
| NoiseLower is better | 18th / 21 | 69.7 dB | +2.60 dB |
| WearHigher is better | 6th / 21 | 36380 KM | -14,960.00 KM |
| ValueLower is better | 14th / 21 | 13.33 Price/1000 | +2.91 Price/1000 |
| Rolling ResistanceLower is better | 19th / 21 | 8.96 kg/t | +3.27 kg/t |
- Price
- 485.00
BFGoodrich Advantage
215/55 R17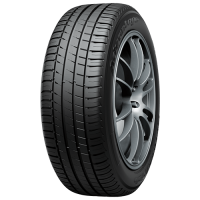
Category scores (% of best)
All discipline results (11)
Discipline positions compare the ranked tyres in this test, not the whole market. These are individual measurements, not weighted overall scores.
| Test | Position in discipline | Result | Gap to best |
|---|---|---|---|
| Dry BrakingLower is better | 10th / 21 | 36.3 m | +0.60 m |
| Dry HandlingHigher is better | 7th / 21 | 95 km/h | -1.00 km/h |
| Wet BrakingLower is better | 18th / 21 | 48.5 m | +5.50 m |
| Wet HandlingHigher is better | 17th / 21 | 72.1 km/h | -2.80 km/h |
| Wet CircleHigher is better | 18th / 21 | 5.97 m/s | -0.77 m/s |
| Straight AquaHigher is better | 14th / 21 | 83.8 km/h | -4.40 km/h |
| Curved AquaplaningHigher is better | 19th / 21 | 3.87 m/sec2 | -0.98 m/sec2 |
| NoiseLower is better | 3rd / 21 | 68.1 dB | +1.00 dB |
| WearHigher is better | 8th / 21 | 35020 KM | -16,320.00 KM |
| ValueLower is better | 18th / 21 | 14.56 Price/1000 | +4.14 Price/1000 |
| Rolling ResistanceLower is better | 8th / 21 | 8.19 kg/t | +2.50 kg/t |
- Price
- 510.00
Fulda SportControl 2
215/55 R17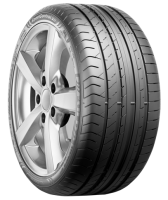
Category scores (% of best)
All discipline results (11)
Discipline positions compare the ranked tyres in this test, not the whole market. These are individual measurements, not weighted overall scores.
| Test | Position in discipline | Result | Gap to best |
|---|---|---|---|
| Dry BrakingLower is better | 13th / 21 | 36.5 m | +0.80 m |
| Dry HandlingHigher is better | 17th / 21 | 94.1 km/h | -1.90 km/h |
| Wet BrakingLower is better | 11th / 21 | 45.9 m | +2.90 m |
| Wet HandlingHigher is better | 15th / 21 | 72.4 km/h | -2.50 km/h |
| Wet CircleHigher is better | 7th / 21 | 6.38 m/s | -0.36 m/s |
| Straight AquaHigher is better | 9th / 21 | 85.6 km/h | -2.60 km/h |
| Curved AquaplaningHigher is better | 12th / 21 | 4.27 m/sec2 | -0.58 m/sec2 |
| NoiseLower is better | 18th / 21 | 69.7 dB | +2.60 dB |
| WearHigher is better | 10th / 21 | 32980 KM | -18,360.00 KM |
| ValueLower is better | 10th / 21 | 13.19 Price/1000 | +2.77 Price/1000 |
| Rolling ResistanceLower is better | 11th / 21 | 8.37 kg/t | +2.68 kg/t |
- Price
- 435.00
Toyo Proxes Comfort
215/55 R17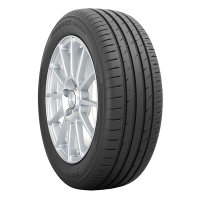
Category scores (% of best)
All discipline results (11)
Discipline positions compare the ranked tyres in this test, not the whole market. These are individual measurements, not weighted overall scores.
| Test | Position in discipline | Result | Gap to best |
|---|---|---|---|
| Dry BrakingLower is better | 5th / 21 | 35.9 m | +0.20 m |
| Dry HandlingHigher is better | 3rd / 21 | 95.4 km/h | -0.60 km/h |
| Wet BrakingLower is better | 12th / 21 | 46.3 m | +3.30 m |
| Wet HandlingHigher is better | 9th / 21 | 73.4 km/h | -1.50 km/h |
| Wet CircleHigher is better | 11th / 21 | 6.23 m/s | -0.51 m/s |
| Straight AquaHigher is better | 19th / 21 | 81.6 km/h | -6.60 km/h |
| Curved AquaplaningHigher is better | 21st / 21 | 3.68 m/sec2 | -1.17 m/sec2 |
| NoiseLower is better | 13th / 21 | 69 dB | +1.90 dB |
| WearHigher is better | 11th / 21 | 31960 KM | -19,380.00 KM |
| ValueLower is better | 15th / 21 | 13.92 Price/1000 | +3.50 Price/1000 |
| Rolling ResistanceLower is better | 16th / 21 | 8.56 kg/t | +2.87 kg/t |
- Price
- 445.00
Debica Presto UHP2
215/55 R17
Category scores (% of best)
All discipline results (11)
Discipline positions compare the ranked tyres in this test, not the whole market. These are individual measurements, not weighted overall scores.
| Test | Position in discipline | Result | Gap to best |
|---|---|---|---|
| Dry BrakingLower is better | 13th / 21 | 36.5 m | +0.80 m |
| Dry HandlingHigher is better | 15th / 21 | 94.2 km/h | -1.80 km/h |
| Wet BrakingLower is better | 15th / 21 | 46.5 m | +3.50 m |
| Wet HandlingHigher is better | 9th / 21 | 73.4 km/h | -1.50 km/h |
| Wet CircleHigher is better | 10th / 21 | 6.27 m/s | -0.47 m/s |
| Straight AquaHigher is better | 15th / 21 | 83.7 km/h | -4.50 km/h |
| Curved AquaplaningHigher is better | 2nd / 21 | 4.83 m/sec2 | -0.02 m/sec2 |
| NoiseLower is better | 15th / 21 | 69.1 dB | +2.00 dB |
| WearHigher is better | 15th / 21 | 30600 KM | -20,740.00 KM |
| ValueLower is better | 11th / 21 | 13.24 Price/1000 | +2.82 Price/1000 |
| Rolling ResistanceLower is better | 7th / 21 | 7.96 kg/t | +2.27 kg/t |
- Price
- 405.00
Kleber Dynaxer HP4
215/55 R17
Category scores (% of best)
All discipline results (11)
Discipline positions compare the ranked tyres in this test, not the whole market. These are individual measurements, not weighted overall scores.
| Test | Position in discipline | Result | Gap to best |
|---|---|---|---|
| Dry BrakingLower is better | 8th / 21 | 36.2 m | +0.50 m |
| Dry HandlingHigher is better | 15th / 21 | 94.2 km/h | -1.80 km/h |
| Wet BrakingLower is better | 17th / 21 | 46.7 m | +3.70 m |
| Wet HandlingHigher is better | 19th / 21 | 71.6 km/h | -3.30 km/h |
| Wet CircleHigher is better | 19th / 21 | 5.94 m/s | -0.80 m/s |
| Straight AquaHigher is better | 7th / 21 | 86 km/h | -2.20 km/h |
| Curved AquaplaningHigher is better | 13th / 21 | 4.17 m/sec2 | -0.68 m/sec2 |
| NoiseLower is better | 2nd / 21 | 67.8 dB | +0.70 dB |
| WearHigher is better | 9th / 21 | 34340 KM | -17,000.00 KM |
| ValueLower is better | 7th / 21 | 12.09 Price/1000 | +1.67 Price/1000 |
| Rolling ResistanceLower is better | 13th / 21 | 8.43 kg/t | +2.74 kg/t |
- Price
- 415.00
Vredestein Ultrac
215/55 R17
Category scores (% of best)
All discipline results (11)
Discipline positions compare the ranked tyres in this test, not the whole market. These are individual measurements, not weighted overall scores.
| Test | Position in discipline | Result | Gap to best |
|---|---|---|---|
| Dry BrakingLower is better | 6th / 21 | 36.1 m | +0.40 m |
| Dry HandlingHigher is better | 7th / 21 | 95 km/h | -1.00 km/h |
| Wet BrakingLower is better | 4th / 21 | 44 m | +1.00 m |
| Wet HandlingHigher is better | 4th / 21 | 74.3 km/h | -0.60 km/h |
| Wet CircleHigher is better | 6th / 21 | 6.43 m/s | -0.31 m/s |
| Straight AquaHigher is better | 5th / 21 | 86.4 km/h | -1.80 km/h |
| Curved AquaplaningHigher is better | 3rd / 21 | 4.59 m/sec2 | -0.26 m/sec2 |
| NoiseLower is better | 21st / 21 | 70.1 dB | +3.00 dB |
| WearHigher is better | 19th / 21 | 27200 KM | -24,140.00 KM |
| ValueLower is better | 20th / 21 | 16.73 Price/1000 | +6.31 Price/1000 |
| Rolling ResistanceLower is better | 12th / 21 | 8.42 kg/t | +2.73 kg/t |
- Price
- 455.00
Laufenn S Fit EQ+
215/55 R17
Category scores (% of best)
All discipline results (11)
Discipline positions compare the ranked tyres in this test, not the whole market. These are individual measurements, not weighted overall scores.
| Test | Position in discipline | Result | Gap to best |
|---|---|---|---|
| Dry BrakingLower is better | 13th / 21 | 36.5 m | +0.80 m |
| Dry HandlingHigher is better | 7th / 21 | 95 km/h | -1.00 km/h |
| Wet BrakingLower is better | 20th / 21 | 51 m | +8.00 m |
| Wet HandlingHigher is better | 20th / 21 | 70.9 km/h | -4.00 km/h |
| Wet CircleHigher is better | 20th / 21 | 5.88 m/s | -0.86 m/s |
| Straight AquaHigher is better | 11th / 21 | 84.8 km/h | -3.40 km/h |
| Curved AquaplaningHigher is better | 15th / 21 | 4.14 m/sec2 | -0.71 m/sec2 |
| NoiseLower is better | 11th / 21 | 68.9 dB | +1.80 dB |
| WearHigher is better | 14th / 21 | 31280 KM | -20,060.00 KM |
| ValueLower is better | 12th / 21 | 13.27 Price/1000 | +2.85 Price/1000 |
| Rolling ResistanceLower is better | 6th / 21 | 7.8 kg/t | +2.11 kg/t |
- Price
- 415.00
Maxxis Premitra HP5
215/55 R17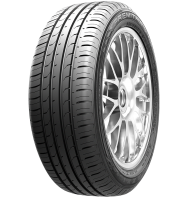
Category scores (% of best)
All discipline results (11)
Discipline positions compare the ranked tyres in this test, not the whole market. These are individual measurements, not weighted overall scores.
| Test | Position in discipline | Result | Gap to best |
|---|---|---|---|
| Dry BrakingLower is better | 20th / 21 | 37.3 m | +1.60 m |
| Dry HandlingHigher is better | 19th / 21 | 94 km/h | -2.00 km/h |
| Wet BrakingLower is better | 8th / 21 | 45.2 m | +2.20 m |
| Wet HandlingHigher is better | 12th / 21 | 73.1 km/h | -1.80 km/h |
| Wet CircleHigher is better | 11th / 21 | 6.23 m/s | -0.51 m/s |
| Straight AquaHigher is better | 3rd / 21 | 87.9 km/h | -0.30 km/h |
| Curved AquaplaningHigher is better | 1st / 21 | 4.85 m/sec2 | Best in this discipline |
| NoiseLower is better | 13th / 21 | 69 dB | +1.90 dB |
| WearHigher is better | 17th / 21 | 27880 KM | -23,460.00 KM |
| ValueLower is better | 12th / 21 | 13.27 Price/1000 | +2.85 Price/1000 |
| Rolling ResistanceLower is better | 17th / 21 | 8.84 kg/t | +3.15 kg/t |
- Price
- 370.00
Nexen N Fera Primus
215/55 R17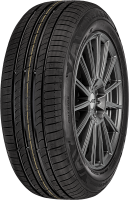
Category scores (% of best)
All discipline results (11)
Discipline positions compare the ranked tyres in this test, not the whole market. These are individual measurements, not weighted overall scores.
| Test | Position in discipline | Result | Gap to best |
|---|---|---|---|
| Dry BrakingLower is better | 19th / 21 | 37.2 m | +1.50 m |
| Dry HandlingHigher is better | 20th / 21 | 93.9 km/h | -2.10 km/h |
| Wet BrakingLower is better | 5th / 21 | 44.7 m | +1.70 m |
| Wet HandlingHigher is better | 7th / 21 | 73.6 km/h | -1.30 km/h |
| Wet CircleHigher is better | 14th / 21 | 6.19 m/s | -0.55 m/s |
| Straight AquaHigher is better | 4th / 21 | 87.3 km/h | -0.90 km/h |
| Curved AquaplaningHigher is better | 10th / 21 | 4.34 m/sec2 | -0.51 m/sec2 |
| NoiseLower is better | 17th / 21 | 69.4 dB | +2.30 dB |
| WearHigher is better | 18th / 21 | 27540 KM | -23,800.00 KM |
| ValueLower is better | 9th / 21 | 12.89 Price/1000 | +2.47 Price/1000 |
| Rolling ResistanceLower is better | 18th / 21 | 8.93 kg/t | +3.24 kg/t |
- Price
- 355.00
Goodride SA57
215/55 R17
Category scores (% of best)
All discipline results (11)
Discipline positions compare the ranked tyres in this test, not the whole market. These are individual measurements, not weighted overall scores.
| Test | Position in discipline | Result | Gap to best |
|---|---|---|---|
| Dry BrakingLower is better | 20th / 21 | 37.3 m | +1.60 m |
| Dry HandlingHigher is better | 11th / 21 | 94.7 km/h | -1.30 km/h |
| Wet BrakingLower is better | 19th / 21 | 48.9 m | +5.90 m |
| Wet HandlingHigher is better | 17th / 21 | 72.1 km/h | -2.80 km/h |
| Wet CircleHigher is better | 17th / 21 | 6.01 m/s | -0.73 m/s |
| Straight AquaHigher is better | 21st / 21 | 80.4 km/h | -7.80 km/h |
| Curved AquaplaningHigher is better | 11th / 21 | 4.28 m/sec2 | -0.57 m/sec2 |
| NoiseLower is better | 9th / 21 | 68.8 dB | +1.70 dB |
| WearHigher is better | 20th / 21 | 26860 KM | -24,480.00 KM |
| ValueLower is better | 3rd / 21 | 11.17 Price/1000 | +0.75 Price/1000 |
| Rolling ResistanceLower is better | 20th / 21 | 8.98 kg/t | +3.29 kg/t |
- Price
- 300.00
Continental EcoContact 6
215/55 R17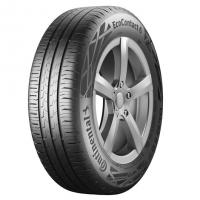
Category scores (% of best)
All discipline results (11)
Discipline positions compare the ranked tyres in this test, not the whole market. These are individual measurements, not weighted overall scores.
| Test | Position in discipline | Result | Gap to best |
|---|---|---|---|
| Dry BrakingLower is better | 12th / 21 | 36.4 m | +0.70 m |
| Dry HandlingHigher is better | 21st / 21 | 93.8 km/h | -2.20 km/h |
| Wet BrakingLower is better | 21st / 21 | 51.1 m | +8.10 m |
| Wet HandlingHigher is better | 21st / 21 | 67.7 km/h | -7.20 km/h |
| Wet CircleHigher is better | 21st / 21 | 5.68 m/s | -1.06 m/s |
| Straight AquaHigher is better | 20th / 21 | 81.5 km/h | -6.70 km/h |
| Curved AquaplaningHigher is better | 20th / 21 | 3.75 m/sec2 | -1.10 m/sec2 |
| NoiseLower is better | 1st / 21 | 67.1 dB | Best in this discipline |
| WearHigher is better | 3rd / 21 | 41480 KM | -9,860.00 KM |
| ValueLower is better | 16th / 21 | 13.98 Price/1000 | +3.56 Price/1000 |
| Rolling ResistanceLower is better | 1st / 21 | 5.69 kg/t | Best in this discipline |
- Price
- 580.00
GT Radial FE2
215/55 R17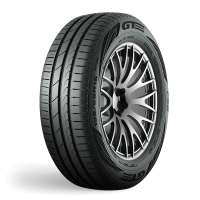
Category scores (% of best)
All discipline results (11)
Discipline positions compare the ranked tyres in this test, not the whole market. These are individual measurements, not weighted overall scores.
| Test | Position in discipline | Result | Gap to best |
|---|---|---|---|
| Dry BrakingLower is better | 18th / 21 | 37 m | +1.30 m |
| Dry HandlingHigher is better | 13th / 21 | 94.5 km/h | -1.50 km/h |
| Wet BrakingLower is better | 13th / 21 | 46.4 m | +3.40 m |
| Wet HandlingHigher is better | 16th / 21 | 72.3 km/h | -2.60 km/h |
| Wet CircleHigher is better | 16th / 21 | 6.11 m/s | -0.63 m/s |
| Straight AquaHigher is better | 18th / 21 | 82.2 km/h | -6.00 km/h |
| Curved AquaplaningHigher is better | 8th / 21 | 4.45 m/sec2 | -0.40 m/sec2 |
| NoiseLower is better | 6th / 21 | 68.5 dB | +1.40 dB |
| WearHigher is better | 16th / 21 | 29240 KM | -22,100.00 KM |
| ValueLower is better | 17th / 21 | 14.19 Price/1000 | +3.77 Price/1000 |
| Rolling ResistanceLower is better | 10th / 21 | 8.24 kg/t | +2.55 kg/t |
- Price
- 415.00
Nokian PowerProof
215/55 R17
Category scores (% of best)
All discipline results (11)
Discipline positions compare the ranked tyres in this test, not the whole market. These are individual measurements, not weighted overall scores.
| Test | Position in discipline | Result | Gap to best |
|---|---|---|---|
| Dry BrakingLower is better | 1st / 21 | 35.7 m | Best in this discipline |
| Dry HandlingHigher is better | 14th / 21 | 94.4 km/h | -1.60 km/h |
| Wet BrakingLower is better | 8th / 21 | 45.2 m | +2.20 m |
| Wet HandlingHigher is better | 3rd / 21 | 74.4 km/h | -0.50 km/h |
| Wet CircleHigher is better | 8th / 21 | 6.34 m/s | -0.40 m/s |
| Straight AquaHigher is better | 7th / 21 | 86 km/h | -2.20 km/h |
| Curved AquaplaningHigher is better | 16th / 21 | 4.12 m/sec2 | -0.73 m/sec2 |
| NoiseLower is better | 20th / 21 | 69.8 dB | +2.70 dB |
| WearHigher is better | 21st / 21 | 25840 KM | -25,500.00 KM |
| ValueLower is better | 21st / 21 | 18.58 Price/1000 | +8.16 Price/1000 |
| Rolling ResistanceLower is better | 15th / 21 | 8.55 kg/t | +2.86 kg/t |
- Price
- 480.00
I was checking out the FALKEN 205/55 R16 ZIEX ZE310AEC 91V, which have a Fuel Efficiency mark A, but it says here it has almost the highest rolling resistance... So, now I'm a bit confused...
This test would have been started in 2021 so it might be that the tyre has had a midlife update.
Got it. Might be :)
Still no Primacy 4+ review...
I tested it in a comparison video on youtube against ps5 and ps4s and auto express have tested it: https://www.tyrereviews.com...
When the Conti EC5 was released, it had spider charts comparing it with the EC3 & a (woeful) "fuel efficiency optimised" experimental tyre. The message was that one can't go too far down the LRR path without serious degradation of wet grip. It seems that that experimental tyre is the parent of the execrable EC6..
Conti EC 6 is already older (Oct. 2018 productions starts, 2019 first sales but developed much earlier), see https://reifenpresse.de/202...
It has already kind of "Evo" further optimized (pattern, fuel consumption, compound, grip and handling) and more quiet successor which is called EC 6Q, at least already in the OEM versions. But I see at the bottom of the reference that currently its available ony in 17-21'...but it was not yet publicly and independently tested, first test results I expect to be published in the spring 2023.
Normally I saw there are still shops selling the older EC5, maybe also in smaller sizes, which are probably no more profitable for the producers, given the huge raise of primary materials, energies and inflation.
You can also use alternatives from the remaining top producers, like e.g. not so much known Hankook K435 Eco 2, Michelin Primacy 4/4+ or Bridgestone Turanza T005 or Eco etc. But probably all producers will increase the prices within the 1st half of this year, at least, so hurry up to buy slightly older stock, if you need it this year.
I do wish that other qualities were optimised a bit more or that the excellent PC5 &/or PC2 were maintained in more smaller sizes as an alternative to the EC6. Presumably the market isn't there. I have used the Kinergy Eco2 (to replace no longer available PC2 in my size) dirt is a decided step down in crispness of response, wet grip & limit behaviour.
.
I am not sure how the Goodyear wins this considering it is way behind the best in terms of performance on the road. Looking at the individual results suggest that is the middle of the pack at most things (apart from wear)
Auto Bild have quite a complicated downgrade system meaning if a tyre is best in every test but one key test where is was "yellow" then it can never finish in the top group. The exact details of this aren't published as far as I know so we have to trust the results.
I remember a website (Hungarian I think) that contained some of the tyre tests where you could value various criteria on your own (e.g. safety parameters in the dry / wet, performance, rolling resistance, estimated mileage). And it changed the rankings according to your criteria. Sadly I can't remember its address anymore, it's been a few years.
It is not just tyre tests, current Euro NCAP also no longer analyses real safety of a given car but checks if it has enough assisting and potentially dangerous gizmos instead.
IF safety was the primary criteria, Vredestein and Nokian would be definitely in the top three whereas Goodyear would have been in the bottom third.
If you ever find that website please share it, I remember it too and loved the solution, I'm trying to implement one on tyre reviews so it would be great to have it as a reference.
Found it, deeply burried at autonavigator.hu.
the most recent being a winter tyre test of 2021 (https://www.autonavigator.h...
Legend, thank you for finding that! :D
Graphs - or texts - for rolling resistance and noise should switch positions. Also, there's no final verdict (pros and cons) for »Bridgestone T005« now. It's nice you mentioned »Auto bild« site and magazine for details, but maybe it would be useful to mark »Volkswagen Passat Variant B8« as test-vehicle.
Well spotted, thank you.