



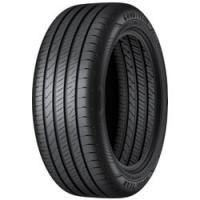
 It's the 50th anniversary of the ADAC tyre test, and to celebrate the German automotive body have tested fifty summer tyres in the popular 205/55 R16 tyre size, and have included wear testing for every tyre!
There's a lot to unpack in this test, so we'll dive straight in! Headline notes, there are two Michelin tyres in this test, the Michelin Primacy 4+ and the energy saving Michelin e.Primacy, the Continental on test is not the new PremiumContact 7, it's the previous model, the Continental PremiumContact 6, and Continental also have the new Continental UltraContact in the test which is meant to be a lower rolling resistance and higher mileage tyre for those who drive a lot of distance!
Test setup & methodology
The test setting, the conditions recorded and how the results contribute to the score.
Recorded test conditions
Recorded test conditions
- Dry Braking
- 100 → 0 km/h
- Wet Braking
- 80 → 0 km/h
- Wet Braking - Concrete
- 80 → 0 km/h
Wear
Wear is a key quality of any tyre - what good is a tyre that has amazing grip if it only lasts a few thousand miles?! Road wear testing is incredibly expensive, and with 50 sets of tyres on test ADAC had to split the tyres between road and machine wearing with control tyres between the two to ensure data correlation.
As usual, Michelin led the wear test, but not with the tyre you'd expect. The Michelin e.Primacy, which starts with lower than average tread depth and is designed for very low fuel use (more on that later) recorded a staggering estimated 71,500kms tread life!
The second best tyre was the impressive Goodyear EfficientGrip Performance 2 which once again highlights the longevity of modern Goodyear products, and the low wearing Michelin Primacy 4+ was just beaten to third by the budget Doublecoin DC99. This also happens to be the best result for the Doublecoin, keep an eye on it later in the test.
Of the known brand names, it was a disappointing result for Uniroyal, Nokian and Dunlop, all projected to have less than half the miles of the best.
Wear
Predicted tread life in KM
Higher is better ↑| Position / Tyre | Result | Gap to best |
|---|---|---|
| 71,500 KM | Best | |
| 65,700 KM | -5,800 KM | |
| 64,800 KM | -6,700 KM | |
| 61,300 KM | -10,200 KM | |
| 55,900 KM | -15,600 KM | |
| 49,700 KM | -21,800 KM | |
| 48,000 KM | -23,500 KM | |
| 47,500 KM | -24,000 KM | |
| 47,500 KM | -24,000 KM | |
| 45,700 KM | -25,800 KM | |
| 45,700 KM | -25,800 KM | |
| 43,500 KM | -28,000 KM | |
| 42,200 KM | -29,300 KM | |
| 41,700 KM | -29,800 KM | |
| 40,800 KM | -30,700 KM | |
| 40,800 KM | -30,700 KM | |
| 40,400 KM | -31,100 KM | |
| 40,000 KM | -31,500 KM | |
| 40,000 KM | -31,500 KM | |
| 40,000 KM | -31,500 KM | |
| 39,500 KM | -32,000 KM | |
| 39,100 KM | -32,400 KM | |
| 38,600 KM | -32,900 KM | |
| 38,600 KM | -32,900 KM | |
| 38,200 KM | -33,300 KM | |
| 37,300 KM | -34,200 KM | |
| 37,300 KM | -34,200 KM | |
| 36,900 KM | -34,600 KM | |
| 36,900 KM | -34,600 KM | |
| 36,000 KM | -35,500 KM | |
| 35,500 KM | -36,000 KM | |
| 35,500 KM | -36,000 KM | |
| 35,100 KM | -36,400 KM | |
| 35,100 KM | -36,400 KM | |
| 34,600 KM | -36,900 KM | |
| 33,700 KM | -37,800 KM | |
| 33,700 KM | -37,800 KM | |
| 33,300 KM | -38,200 KM | |
| 33,300 KM | -38,200 KM | |
| 33,300 KM | -38,200 KM | |
| 32,900 KM | -38,600 KM | |
| 31,500 KM | -40,000 KM | |
| 31,500 KM | -40,000 KM | |
| 29,700 KM | -41,800 KM | |
| 27,500 KM | -44,000 KM | |
| 27,100 KM | -44,400 KM | |
| 27,100 KM | -44,400 KM | |
| 25,300 KM | -46,200 KM | |
49Avon ZV7 |
24,000 KM | -47,500 KM |
| 23,100 KM | -48,400 KM |
The difference between best and worst was 67.7% (48,400 KM).
The advantage of having the prices of the tyres and estimated mileage, you can get an idea of the value of the tyres, based in Euros Per 1000km to see how much you get for your money.
As the Doublecoin was one of the best wearing AND one of the cheapest, it offered exceptional value, but we still wouldn't recommend fitting it unless you're really into sliding around. Of the good tyres on test, it was again the Goodyear and Michelin offering great cost per mile, but the Kumho Ecsta HS52 was up there in the mix too.
Value
Euros/1000km based on cost/wear
Lower is better ↓| Position / Tyre | Result | Gap to best |
|---|---|---|
| 1.03 Price/1000 | Best | |
| 1.21 Price/1000 | +0.18 Price/1000 | |
| 1.47 Price/1000 | +0.44 Price/1000 | |
| 1.56 Price/1000 | +0.53 Price/1000 | |
| 1.56 Price/1000 | +0.53 Price/1000 | |
| 1.57 Price/1000 | +0.54 Price/1000 | |
| 1.64 Price/1000 | +0.61 Price/1000 | |
| 1.67 Price/1000 | +0.64 Price/1000 | |
| 1.73 Price/1000 | +0.70 Price/1000 | |
| 1.77 Price/1000 | +0.74 Price/1000 | |
| 1.83 Price/1000 | +0.80 Price/1000 | |
| 1.83 Price/1000 | +0.80 Price/1000 | |
| 1.89 Price/1000 | +0.86 Price/1000 | |
| 1.89 Price/1000 | +0.86 Price/1000 | |
| 1.94 Price/1000 | +0.91 Price/1000 | |
| 1.96 Price/1000 | +0.93 Price/1000 | |
| 1.99 Price/1000 | +0.96 Price/1000 | |
| 2 Price/1000 | +0.97 Price/1000 | |
| 2.01 Price/1000 | +0.98 Price/1000 | |
| 2.02 Price/1000 | +0.99 Price/1000 | |
| 2.03 Price/1000 | +1.00 Price/1000 | |
| 2.11 Price/1000 | +1.08 Price/1000 | |
| 2.13 Price/1000 | +1.10 Price/1000 | |
| 2.14 Price/1000 | +1.11 Price/1000 | |
| 2.18 Price/1000 | +1.15 Price/1000 | |
| 2.19 Price/1000 | +1.16 Price/1000 | |
| 2.23 Price/1000 | +1.20 Price/1000 | |
| 2.25 Price/1000 | +1.22 Price/1000 | |
| 2.26 Price/1000 | +1.23 Price/1000 | |
| 2.28 Price/1000 | +1.25 Price/1000 | |
| 2.3 Price/1000 | +1.27 Price/1000 | |
| 2.31 Price/1000 | +1.28 Price/1000 | |
| 2.39 Price/1000 | +1.36 Price/1000 | |
| 2.45 Price/1000 | +1.42 Price/1000 | |
| 2.47 Price/1000 | +1.44 Price/1000 | |
| 2.55 Price/1000 | +1.52 Price/1000 | |
| 2.55 Price/1000 | +1.52 Price/1000 | |
| 2.57 Price/1000 | +1.54 Price/1000 | |
| 2.58 Price/1000 | +1.55 Price/1000 | |
| 2.63 Price/1000 | +1.60 Price/1000 | |
| 2.69 Price/1000 | +1.66 Price/1000 | |
| 2.71 Price/1000 | +1.68 Price/1000 | |
| 2.75 Price/1000 | +1.72 Price/1000 | |
| 2.76 Price/1000 | +1.73 Price/1000 | |
| 2.91 Price/1000 | +1.88 Price/1000 | |
| 2.96 Price/1000 | +1.93 Price/1000 | |
| 2.98 Price/1000 | +1.95 Price/1000 | |
| 3.03 Price/1000 | +2.00 Price/1000 | |
| 3.29 Price/1000 | +2.26 Price/1000 | |
50Avon ZV7 |
3.75 Price/1000 | +2.72 Price/1000 |
The difference between best and worst was 264.1% (2.72 Price/1000).
Wet
Often wear comes at the expense of wet grip, but once again Goodyear and Michelin (with the Primacy 4+ at least) are proving to break that trend. ADAC only published their wet braking data, of which they use two surfaces, asphalt and concrete. This is where the Michelin, Goodyear and Continental stretch their legs, but it was also a good grip result for the Cooper, Hankook and ESA Tecar on both surfaces.
Wet Braking
Wet braking in meters (80 - 0 km/h)
Lower is better ↓| Position / Tyre | Result | Gap to best | Residual speed |
|---|---|---|---|
| 34.4 m | Best | 0 km/h | |
| 35 m | +0.60 m | 17 km/h | |
| 35.8 m | +1.40 m | 26 km/h | |
| 35.8 m | +1.40 m | 26 km/h | |
| 36.3 m | +1.90 m | 30 km/h | |
| 36.7 m | +2.30 m | 33 km/h | |
| 36.8 m | +2.40 m | 33 km/h | |
| 36.8 m | +2.40 m | 33 km/h | |
| 36.9 m | +2.50 m | 34 km/h | |
| 37.2 m | +2.80 m | 36 km/h | |
| 37.4 m | +3.00 m | 37 km/h | |
| 37.7 m | +3.30 m | 38 km/h | |
13Avon ZV7 |
38 m | +3.60 m | 40 km/h |
| 38.1 m | +3.70 m | 41 km/h | |
| 38.2 m | +3.80 m | 41 km/h | |
| 38.3 m | +3.90 m | 41 km/h | |
| 38.4 m | +4.00 m | 42 km/h | |
| 39 m | +4.60 m | 45 km/h | |
| 39.1 m | +4.70 m | 45 km/h | |
| 39.5 m | +5.10 m | 47 km/h | |
| 39.8 m | +5.40 m | 48 km/h | |
| 40.2 m | +5.80 m | 49 km/h | |
| 40.2 m | +5.80 m | 49 km/h | |
| 40.3 m | +5.90 m | 50 km/h | |
| 40.6 m | +6.20 m | 51 km/h | |
| 40.8 m | +6.40 m | 51 km/h | |
| 40.9 m | +6.50 m | 52 km/h | |
| 41.1 m | +6.70 m | 52 km/h | |
| 41.4 m | +7.00 m | 53 km/h | |
| 41.4 m | +7.00 m | 53 km/h | |
| 41.5 m | +7.10 m | 54 km/h | |
| 41.7 m | +7.30 m | 54 km/h | |
| 41.8 m | +7.40 m | 55 km/h | |
| 42.2 m | +7.80 m | 56 km/h | |
| 43.1 m | +8.70 m | 58 km/h | |
| 43.5 m | +9.10 m | 59 km/h | |
| 43.6 m | +9.20 m | 60 km/h | |
| 43.7 m | +9.30 m | 60 km/h | |
| 43.9 m | +9.50 m | 60 km/h | |
| 44.2 m | +9.80 m | 61 km/h | |
| 44.3 m | +9.90 m | 61 km/h | |
| 44.5 m | +10.10 m | 62 km/h | |
| 45.3 m | +10.90 m | 64 km/h | |
| 45.9 m | +11.50 m | 65 km/h | |
| 46.4 m | +12.00 m | 66 km/h | |
| 48.4 m | +14.00 m | 70 km/h | |
| 50.9 m | +16.50 m | 74 km/h | |
| 54 m | +19.60 m | 78 km/h | |
| 58.1 m | +23.70 m | 83 km/h | |
| 59.3 m | +24.90 m | 84 km/h |
The difference between best and worst was 72.4% (24.9 m ≈ 5.5 Car Lengths). From 130 km/h, the Double Coin DC99 would still be travelling at 84 km/h when the Continental Premium Contact 6 had stopped.
Residual speed is calculated from the measured braking distances, assuming constant deceleration; it is not a separate measurement.
Wet Braking - Concrete
Wet braking on Concrete in meters (80 - 0 km/h)
Lower is better ↓| Position / Tyre | Result | Gap to best | Residual speed |
|---|---|---|---|
| 35.2 m | Best | 0 km/h | |
| 35.5 m | +0.30 m | 12 km/h | |
| 35.7 m | +0.50 m | 15 km/h | |
| 35.8 m | +0.60 m | 17 km/h | |
| 36 m | +0.80 m | 19 km/h | |
| 36.2 m | +1.00 m | 22 km/h | |
| 36.3 m | +1.10 m | 23 km/h | |
| 37.3 m | +2.10 m | 31 km/h | |
| 37.6 m | +2.40 m | 33 km/h | |
| 37.6 m | +2.40 m | 33 km/h | |
| 37.7 m | +2.50 m | 33 km/h | |
| 37.9 m | +2.70 m | 35 km/h | |
| 37.9 m | +2.70 m | 35 km/h | |
| 38 m | +2.80 m | 35 km/h | |
| 38.4 m | +3.20 m | 38 km/h | |
| 38.7 m | +3.50 m | 39 km/h | |
| 38.8 m | +3.60 m | 40 km/h | |
| 39 m | +3.80 m | 41 km/h | |
| 39.1 m | +3.90 m | 41 km/h | |
| 39.1 m | +3.90 m | 41 km/h | |
| 39.3 m | +4.10 m | 42 km/h | |
| 39.3 m | +4.10 m | 42 km/h | |
21Avon ZV7 |
39.3 m | +4.10 m | 42 km/h |
| 39.5 m | +4.30 m | 43 km/h | |
| 40.1 m | +4.90 m | 45 km/h | |
| 40.2 m | +5.00 m | 46 km/h | |
| 40.5 m | +5.30 m | 47 km/h | |
| 40.6 m | +5.40 m | 47 km/h | |
| 40.6 m | +5.40 m | 47 km/h | |
| 40.9 m | +5.70 m | 49 km/h | |
| 41.1 m | +5.90 m | 49 km/h | |
| 41.3 m | +6.10 m | 50 km/h | |
| 41.5 m | +6.30 m | 51 km/h | |
| 41.7 m | +6.50 m | 51 km/h | |
| 41.9 m | +6.70 m | 52 km/h | |
| 42.9 m | +7.70 m | 55 km/h | |
| 43.1 m | +7.90 m | 56 km/h | |
| 43.3 m | +8.10 m | 56 km/h | |
| 43.3 m | +8.10 m | 56 km/h | |
| 43.4 m | +8.20 m | 57 km/h | |
| 43.8 m | +8.60 m | 58 km/h | |
| 44.1 m | +8.90 m | 58 km/h | |
| 44.2 m | +9.00 m | 59 km/h | |
| 44.4 m | +9.20 m | 59 km/h | |
| 44.8 m | +9.60 m | 60 km/h | |
| 45.7 m | +10.50 m | 62 km/h | |
| 49 m | +13.80 m | 69 km/h | |
| 49.7 m | +14.50 m | 70 km/h | |
| 57.1 m | +21.90 m | 81 km/h | |
| 58.4 m | +23.20 m | 82 km/h |
The difference between best and worst was 65.9% (23.2 m ≈ 5.2 Car Lengths). From 130 km/h, the Double Coin DC99 would still be travelling at 82 km/h when the Continental Premium Contact 6 had stopped.
Residual speed is calculated from the measured braking distances, assuming constant deceleration; it is not a separate measurement.
Straight aquaplaning was led by Uniroyal, with the Doublecoin and Michelin e.Primacy struggling. You can read the result of curved aquaplaning in the results table below.
Straight Aqua
Float Speed in Km/H
Higher is better ↑| Position / Tyre | Result | Gap to best |
|---|---|---|
| 86.7 km/h | Best | |
| 84.6 km/h | -2.10 km/h | |
| 84.6 km/h | -2.10 km/h | |
| 84.5 km/h | -2.20 km/h | |
| 84.1 km/h | -2.60 km/h | |
| 83.6 km/h | -3.10 km/h | |
| 83.5 km/h | -3.20 km/h | |
| 82.8 km/h | -3.90 km/h | |
| 82.5 km/h | -4.20 km/h | |
| 82.4 km/h | -4.30 km/h | |
10Avon ZV7 |
82.4 km/h | -4.30 km/h |
| 82.1 km/h | -4.60 km/h | |
| 81.9 km/h | -4.80 km/h | |
| 81.9 km/h | -4.80 km/h | |
| 81.8 km/h | -4.90 km/h | |
| 81.8 km/h | -4.90 km/h | |
| 81.5 km/h | -5.20 km/h | |
| 81.5 km/h | -5.20 km/h | |
| 81.3 km/h | -5.40 km/h | |
| 81.3 km/h | -5.40 km/h | |
| 81.3 km/h | -5.40 km/h | |
| 80.9 km/h | -5.80 km/h | |
| 80.8 km/h | -5.90 km/h | |
| 80.8 km/h | -5.90 km/h | |
| 80.7 km/h | -6.00 km/h | |
| 80.4 km/h | -6.30 km/h | |
| 80.3 km/h | -6.40 km/h | |
| 80.3 km/h | -6.40 km/h | |
| 80.3 km/h | -6.40 km/h | |
| 80.1 km/h | -6.60 km/h | |
| 80 km/h | -6.70 km/h | |
| 79.9 km/h | -6.80 km/h | |
| 79.7 km/h | -7.00 km/h | |
| 79.6 km/h | -7.10 km/h | |
| 79.3 km/h | -7.40 km/h | |
| 79.3 km/h | -7.40 km/h | |
| 79.2 km/h | -7.50 km/h | |
| 79.2 km/h | -7.50 km/h | |
| 79 km/h | -7.70 km/h | |
| 78.3 km/h | -8.40 km/h | |
| 78.1 km/h | -8.60 km/h | |
| 78.1 km/h | -8.60 km/h | |
| 77.6 km/h | -9.10 km/h | |
| 77.3 km/h | -9.40 km/h | |
| 77.2 km/h | -9.50 km/h | |
| 76.5 km/h | -10.20 km/h | |
| 75 km/h | -11.70 km/h | |
| 72.8 km/h | -13.90 km/h | |
| 71.3 km/h | -15.40 km/h | |
| 70.3 km/h | -16.40 km/h |
The difference between best and worst was 18.9% (16.4 Km/H).
Dry
Continental once again led the way in dry braking, narrowly beating out the Hankook and Michelin e.Primacy.
Dry Braking
Dry braking in meters (100 - 0 km/h)
Lower is better ↓| Position / Tyre | Result | Gap to best | Residual speed |
|---|---|---|---|
| 35.9 m | Best | 0 km/h | |
| 36.6 m | +0.70 m | 18 km/h | |
| 36.7 m | +0.80 m | 19 km/h | |
| 36.7 m | +0.80 m | 19 km/h | |
| 36.9 m | +1.00 m | 21 km/h | |
| 37 m | +1.10 m | 22 km/h | |
| 37.1 m | +1.20 m | 23 km/h | |
| 37.2 m | +1.30 m | 24 km/h | |
| 37.3 m | +1.40 m | 25 km/h | |
| 37.3 m | +1.40 m | 25 km/h | |
| 37.4 m | +1.50 m | 26 km/h | |
| 37.6 m | +1.70 m | 28 km/h | |
| 37.7 m | +1.80 m | 28 km/h | |
| 37.8 m | +1.90 m | 29 km/h | |
| 37.8 m | +1.90 m | 29 km/h | |
| 37.8 m | +1.90 m | 29 km/h | |
| 38 m | +2.10 m | 31 km/h | |
| 38.1 m | +2.20 m | 31 km/h | |
| 38.2 m | +2.30 m | 32 km/h | |
| 38.2 m | +2.30 m | 32 km/h | |
| 38.6 m | +2.70 m | 34 km/h | |
| 38.8 m | +2.90 m | 36 km/h | |
| 39 m | +3.10 m | 37 km/h | |
| 39.1 m | +3.20 m | 37 km/h | |
| 39.1 m | +3.20 m | 37 km/h | |
| 39.3 m | +3.40 m | 38 km/h | |
| 39.3 m | +3.40 m | 38 km/h | |
28Avon ZV7 |
39.4 m | +3.50 m | 39 km/h |
| 39.4 m | +3.50 m | 39 km/h | |
| 39.4 m | +3.50 m | 39 km/h | |
| 39.4 m | +3.50 m | 39 km/h | |
| 39.5 m | +3.60 m | 39 km/h | |
| 39.5 m | +3.60 m | 39 km/h | |
| 39.5 m | +3.60 m | 39 km/h | |
| 39.6 m | +3.70 m | 40 km/h | |
| 39.7 m | +3.80 m | 40 km/h | |
| 39.8 m | +3.90 m | 41 km/h | |
| 39.8 m | +3.90 m | 41 km/h | |
| 39.9 m | +4.00 m | 41 km/h | |
| 40.1 m | +4.20 m | 42 km/h | |
| 40.2 m | +4.30 m | 43 km/h | |
| 40.2 m | +4.30 m | 43 km/h | |
| 40.3 m | +4.40 m | 43 km/h | |
| 40.5 m | +4.60 m | 44 km/h | |
| 40.8 m | +4.90 m | 45 km/h | |
| 40.8 m | +4.90 m | 45 km/h | |
| 41 m | +5.10 m | 46 km/h | |
| 41.4 m | +5.50 m | 47 km/h | |
| 42.5 m | +6.60 m | 51 km/h | |
| 42.9 m | +7.00 m | 53 km/h |
The difference between best and worst was 19.5% (7 m ≈ 1.6 Car Lengths). From 130 km/h, the Premiorri Solazo would still be travelling at 53 km/h when the Continental Premium Contact 6 had stopped.
Residual speed is calculated from the measured braking distances, assuming constant deceleration; it is not a separate measurement.

Environment
As the environmental impact of all industry is becoming ever more important, the big tyre tests are now measuring "abrasion" which is how much rubber, measured in weight, the tyre loses. While a high mileage tyre should lead in this category, it isn't always a straight correlation as the tyres have different amounts of material in them.
The best in test was the e.Primacy, and ignoring the budget Michelin also did very well with the Primacy 4+, but Continentals new high mileage tyre, the UltraContact, also performed extremely well.
Abrasion
Weight of Tyre Wear Particles Lost (mg/km/t)
Lower is better ↓| Position / Tyre | Result | Gap to best |
|---|---|---|
| 34.8 mg/km/t | Best | |
| 45.9 mg/km/t | +11.10 mg/km/t | |
| 52.5 mg/km/t | +17.70 mg/km/t | |
| 53.7 mg/km/t | +18.90 mg/km/t | |
| 61.3 mg/km/t | +26.50 mg/km/t | |
| 63.5 mg/km/t | +28.70 mg/km/t | |
| 67 mg/km/t | +32.20 mg/km/t | |
| 67.6 mg/km/t | +32.80 mg/km/t | |
| 68.7 mg/km/t | +33.90 mg/km/t | |
| 69.5 mg/km/t | +34.70 mg/km/t | |
| 70.1 mg/km/t | +35.30 mg/km/t | |
| 71.2 mg/km/t | +36.40 mg/km/t | |
| 72.2 mg/km/t | +37.40 mg/km/t | |
| 72.6 mg/km/t | +37.80 mg/km/t | |
| 73.3 mg/km/t | +38.50 mg/km/t | |
| 73.3 mg/km/t | +38.50 mg/km/t | |
| 73.6 mg/km/t | +38.80 mg/km/t | |
| 73.6 mg/km/t | +38.80 mg/km/t | |
| 74 mg/km/t | +39.20 mg/km/t | |
| 74 mg/km/t | +39.20 mg/km/t | |
| 74.3 mg/km/t | +39.50 mg/km/t | |
| 75.7 mg/km/t | +40.90 mg/km/t | |
| 75.7 mg/km/t | +40.90 mg/km/t | |
| 75.7 mg/km/t | +40.90 mg/km/t | |
| 75.9 mg/km/t | +41.10 mg/km/t | |
| 76.1 mg/km/t | +41.30 mg/km/t | |
| 78.2 mg/km/t | +43.40 mg/km/t | |
| 78.9 mg/km/t | +44.10 mg/km/t | |
| 79.3 mg/km/t | +44.50 mg/km/t | |
| 79.3 mg/km/t | +44.50 mg/km/t | |
| 80 mg/km/t | +45.20 mg/km/t | |
| 80.2 mg/km/t | +45.40 mg/km/t | |
| 80.6 mg/km/t | +45.80 mg/km/t | |
| 81.4 mg/km/t | +46.60 mg/km/t | |
| 81.7 mg/km/t | +46.90 mg/km/t | |
| 82.1 mg/km/t | +47.30 mg/km/t | |
| 83.8 mg/km/t | +49.00 mg/km/t | |
| 87 mg/km/t | +52.20 mg/km/t | |
| 87.3 mg/km/t | +52.50 mg/km/t | |
| 88.1 mg/km/t | +53.30 mg/km/t | |
| 90.9 mg/km/t | +56.10 mg/km/t | |
| 92.2 mg/km/t | +57.40 mg/km/t | |
| 93.2 mg/km/t | +58.40 mg/km/t | |
| 94.3 mg/km/t | +59.50 mg/km/t | |
| 96.1 mg/km/t | +61.30 mg/km/t | |
| 96.8 mg/km/t | +62.00 mg/km/t | |
| 97.7 mg/km/t | +62.90 mg/km/t | |
| 101 mg/km/t | +66.20 mg/km/t | |
| 112.6 mg/km/t | +77.80 mg/km/t | |
50Avon ZV7 |
126 mg/km/t | +91.20 mg/km/t |
The difference between best and worst was 262.1% (91.2 mg/km/t).
Fuel consumption was measured in a real world test rather than a machine rolling resistance test, and, well, there was a disappointingly small range of results. The total spread was 5.5 litres per 100km to 5.9 litres per 100km.
Given the relatively small real world advantage a tyre like the e.Primacy has in this test over a tyre like the Bridgestone Turanza T005, but the large disadvantage it has in wet grip, it makes me wonder if ultra low rolling resistance tyres are really the correct choice for anyone.
Fuel Consumption
Fuel consumption in Litres per 100 km
Lower is better ↓| Position / Tyre | Result | Gap to best | Extra fuel / year |
|---|---|---|---|
| 5.5 l/100km | Best | £0 | |
| 5.5 l/100km | Best | £0 | |
| 5.6 l/100km | +0.10 l/100km | £28 | |
| 5.6 l/100km | +0.10 l/100km | £28 | |
| 5.6 l/100km | +0.10 l/100km | £28 | |
| 5.6 l/100km | +0.10 l/100km | £28 | |
| 5.6 l/100km | +0.10 l/100km | £28 | |
| 5.6 l/100km | +0.10 l/100km | £28 | |
| 5.6 l/100km | +0.10 l/100km | £28 | |
| 5.7 l/100km | +0.20 l/100km | £55 | |
| 5.7 l/100km | +0.20 l/100km | £55 | |
| 5.7 l/100km | +0.20 l/100km | £55 | |
| 5.7 l/100km | +0.20 l/100km | £55 | |
| 5.7 l/100km | +0.20 l/100km | £55 | |
| 5.7 l/100km | +0.20 l/100km | £55 | |
| 5.7 l/100km | +0.20 l/100km | £55 | |
| 5.7 l/100km | +0.20 l/100km | £55 | |
| 5.7 l/100km | +0.20 l/100km | £55 | |
| 5.7 l/100km | +0.20 l/100km | £55 | |
| 5.7 l/100km | +0.20 l/100km | £55 | |
| 5.7 l/100km | +0.20 l/100km | £55 | |
| 5.7 l/100km | +0.20 l/100km | £55 | |
| 5.7 l/100km | +0.20 l/100km | £55 | |
| 5.7 l/100km | +0.20 l/100km | £55 | |
| 5.7 l/100km | +0.20 l/100km | £55 | |
| 5.7 l/100km | +0.20 l/100km | £55 | |
| 5.7 l/100km | +0.20 l/100km | £55 | |
| 5.8 l/100km | +0.30 l/100km | £83 | |
| 5.8 l/100km | +0.30 l/100km | £83 | |
| 5.8 l/100km | +0.30 l/100km | £83 | |
| 5.8 l/100km | +0.30 l/100km | £83 | |
| 5.8 l/100km | +0.30 l/100km | £83 | |
| 5.8 l/100km | +0.30 l/100km | £83 | |
| 5.8 l/100km | +0.30 l/100km | £83 | |
| 5.8 l/100km | +0.30 l/100km | £83 | |
| 5.8 l/100km | +0.30 l/100km | £83 | |
28Avon ZV7 |
5.8 l/100km | +0.30 l/100km | £83 |
| 5.8 l/100km | +0.30 l/100km | £83 | |
| 5.8 l/100km | +0.30 l/100km | £83 | |
| 5.8 l/100km | +0.30 l/100km | £83 | |
| 5.8 l/100km | +0.30 l/100km | £83 | |
| 5.8 l/100km | +0.30 l/100km | £83 | |
| 5.9 l/100km | +0.40 l/100km | £110 | |
| 5.9 l/100km | +0.40 l/100km | £110 | |
| 5.9 l/100km | +0.40 l/100km | £110 | |
| 5.9 l/100km | +0.40 l/100km | £110 | |
| 5.9 l/100km | +0.40 l/100km | £110 | |
| 5.9 l/100km | +0.40 l/100km | £110 | |
| 5.9 l/100km | +0.40 l/100km | £110 | |
| 5.9 l/100km | +0.40 l/100km | £110 |
The difference between best and worst was 7.3% (0.4 l/100km). Over 19,000 km a year at £1.45/L, the Cooper Zeon CS8 uses about 76 L (£110) more fuel than the Michelin e.Primacy.
Adjust the assumptions
Calculated estimates, not additional measurements. Use the controls to explore the assumptions.
Finally external noise was measured, but for the sake of avoiding another long chart, you can find the data below. The e.Primacy was impressively quiet, and the Petlas impressively loud!
Results
You can find the full results below, with some of the testers notes on key tyres. If you want to see the full test we strongly suggest you learn German and head over to the ADAC website here.
Goodyear EfficientGrip Performance 2
205/55 R16 91VEnvironmental balance: In the environmental balance, the Goodyear Efficient Grip Performance 2 scores with above-average mileage in the wear test and low abrasion. The efficiency is also impressive thanks to the low tire weight and low fuel consumption. When it comes to noise, the Goodyear performs satisfactorily.
Category scores (% of best)
All discipline results (11)
Discipline positions compare the ranked tyres in this test, not the whole market. These are individual measurements, not weighted overall scores.
| Test | Position in discipline | Result | Gap to best |
|---|---|---|---|
| Dry BrakingLower is better | 13th / 50 | 37.7 m | +1.80 m |
| Wet BrakingLower is better | 11th / 50 | 37.4 m | +3.00 m |
| Wet Braking - ConcreteLower is better | 5th / 50 | 36 m | +0.80 m |
| Straight AquaHigher is better | 27th / 50 | 80.3 km/h | -6.40 km/h |
| Curved AquaplaningHigher is better | 19th / 50 | 3.5 m/sec2 | -0.50 m/sec2 |
| NoiseLower is better | 15th / 50 | 70.6 dB | +1.50 dB |
| Tyre WeightLower is better | 11th / 50 | 8.3 Kg | +0.70 Kg |
| WearHigher is better | 2nd / 50 | 65700 KM | -5,800.00 KM |
| ValueLower is better | 8th / 50 | 1.67 Price/1000 | +0.64 Price/1000 |
| Fuel ConsumptionLower is better | 10th / 50 | 5.7 l/100km | +0.20 l/100km |
| AbrasionLower is better | 5th / 50 | 61.3 mg/km/t | +26.50 mg/km/t |
- EU Label
- B/A/69
- Price
- 110.00
Continental Premium Contact 6
205/55 R16 91V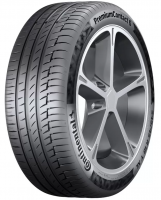
Environmental balance: In terms of the environmental balance, the PremiumContact 6 just missed out on a good rating. In the wear test, it delivers a good predicted mileage and its abrasion is also low, in terms of efficiency it just misses a good rating due to the tyre weight. When it comes to noise, it also performs satisfactorily.
Category scores (% of best)
All discipline results (11)
Discipline positions compare the ranked tyres in this test, not the whole market. These are individual measurements, not weighted overall scores.
| Test | Position in discipline | Result | Gap to best |
|---|---|---|---|
| Dry BrakingLower is better | 1st / 50 | 35.9 m | Best in this discipline |
| Wet BrakingLower is better | 1st / 50 | 34.4 m | Best in this discipline |
| Wet Braking - ConcreteLower is better | 1st / 50 | 35.2 m | Best in this discipline |
| Straight AquaHigher is better | 27th / 50 | 80.3 km/h | -6.40 km/h |
| Curved AquaplaningHigher is better | 33rd / 50 | 3.3 m/sec2 | -0.70 m/sec2 |
| NoiseLower is better | 33rd / 50 | 71.4 dB | +2.30 dB |
| Tyre WeightLower is better | 36th / 50 | 8.9 Kg | +1.30 Kg |
| WearHigher is better | 6th / 50 | 49700 KM | -21,800.00 KM |
| ValueLower is better | 32nd / 50 | 2.31 Price/1000 | +1.28 Price/1000 |
| Fuel ConsumptionLower is better | 28th / 50 | 5.8 l/100km | +0.30 l/100km |
| AbrasionLower is better | 10th / 50 | 69.5 mg/km/t | +34.70 mg/km/t |
- EU Label
- C/A/71
- Price
- 115.00
Michelin Primacy 4+
205/55 R16 91V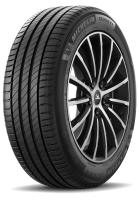
Environmental balance: In the environmental balance, the Primacy 4+ secures the second best rating in the test (best: Michelin e.Primacy). Its predicted mileage is classified as very good and its abrasion is also low.
Category scores (% of best)
All discipline results (11)
Discipline positions compare the ranked tyres in this test, not the whole market. These are individual measurements, not weighted overall scores.
| Test | Position in discipline | Result | Gap to best |
|---|---|---|---|
| Dry BrakingLower is better | 5th / 50 | 36.9 m | +1.00 m |
| Wet BrakingLower is better | 6th / 50 | 36.7 m | +2.30 m |
| Wet Braking - ConcreteLower is better | 11th / 50 | 37.7 m | +2.50 m |
| Straight AquaHigher is better | 7th / 50 | 83.5 km/h | -3.20 km/h |
| Curved AquaplaningHigher is better | 14th / 50 | 3.6 m/sec2 | -0.40 m/sec2 |
| NoiseLower is better | 12th / 50 | 70.5 dB | +1.40 dB |
| Tyre WeightLower is better | 26th / 50 | 8.6 Kg | +1.00 Kg |
| WearHigher is better | 4th / 50 | 61300 KM | -10,200.00 KM |
| ValueLower is better | 16th / 50 | 1.96 Price/1000 | +0.93 Price/1000 |
| Fuel ConsumptionLower is better | 28th / 50 | 5.8 l/100km | +0.30 l/100km |
| AbrasionLower is better | 4th / 50 | 53.7 mg/km/t | +18.90 mg/km/t |
- EU Label
- C/A/69
- Price
- 120.00
Bridgestone Turanza T005
205/55 R16 91V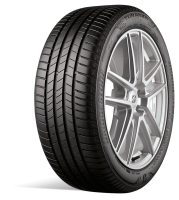
Environmental balance: The Bridgestone Turanza T005 achieves a good result in the environmental balance. It shines in terms of efficiency thanks to its low weight and fuel consumption, but its predicted mileage is rated as just good.
Category scores (% of best)
All discipline results (11)
Discipline positions compare the ranked tyres in this test, not the whole market. These are individual measurements, not weighted overall scores.
| Test | Position in discipline | Result | Gap to best |
|---|---|---|---|
| Dry BrakingLower is better | 9th / 50 | 37.3 m | +1.40 m |
| Wet BrakingLower is better | 12th / 50 | 37.7 m | +3.30 m |
| Wet Braking - ConcreteLower is better | 19th / 50 | 39.1 m | +3.90 m |
| Straight AquaHigher is better | 8th / 50 | 82.8 km/h | -3.90 km/h |
| Curved AquaplaningHigher is better | 19th / 50 | 3.5 m/sec2 | -0.50 m/sec2 |
| NoiseLower is better | 44th / 50 | 72.3 dB | +3.20 dB |
| Tyre WeightLower is better | 3rd / 50 | 7.7 Kg | +0.10 Kg |
| WearHigher is better | 17th / 50 | 40400 KM | -31,100.00 KM |
| ValueLower is better | 43rd / 50 | 2.75 Price/1000 | +1.72 Price/1000 |
| Fuel ConsumptionLower is better | 3rd / 50 | 5.6 l/100km | +0.10 l/100km |
| AbrasionLower is better | 15th / 50 | 73.3 mg/km/t | +38.50 mg/km/t |
- EU Label
- B/A/71
- Price
- 111.00
Nokian WetProof
205/55 R16 91V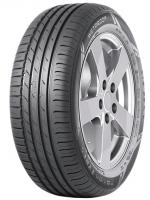
Environmental balance: In terms of environmental balance, the Wetproof does not get more than a satisfactory rating. Both its predicted mileage and its abrasion are classified as only satisfactory in relation to the test field. Thanks to the low tire weight and low fuel consumption, however, it achieves a good rating for efficiency.
Category scores (% of best)
All discipline results (11)
Discipline positions compare the ranked tyres in this test, not the whole market. These are individual measurements, not weighted overall scores.
| Test | Position in discipline | Result | Gap to best |
|---|---|---|---|
| Dry BrakingLower is better | 14th / 50 | 37.8 m | +1.90 m |
| Wet BrakingLower is better | 3rd / 50 | 35.8 m | +1.40 m |
| Wet Braking - ConcreteLower is better | 8th / 50 | 37.3 m | +2.10 m |
| Straight AquaHigher is better | 2nd / 50 | 84.6 km/h | -2.10 km/h |
| Curved AquaplaningHigher is better | 19th / 50 | 3.5 m/sec2 | -0.50 m/sec2 |
| NoiseLower is better | 15th / 50 | 70.6 dB | +1.50 dB |
| Tyre WeightLower is better | 11th / 50 | 8.3 Kg | +0.70 Kg |
| WearHigher is better | 31st / 50 | 35500 KM | -36,000.00 KM |
| ValueLower is better | 34th / 50 | 2.45 Price/1000 | +1.42 Price/1000 |
| Fuel ConsumptionLower is better | 28th / 50 | 5.8 l/100km | +0.30 l/100km |
| AbrasionLower is better | 41st / 50 | 90.9 mg/km/t | +56.10 mg/km/t |
- EU Label
- C/A/68
- Price
- 87.00
Falken ZIEX ZE310 EcoRun
205/55 R16 91V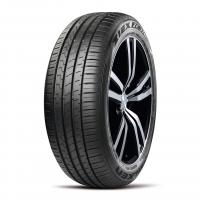
Environmental balance: When it comes to the environmental balance, the ZIEX ZE310 does not get more than a satisfactory result. It does get good ratings for its predicted mileage and abrasion, but since it's quite heavy in comparison, it doesn't get more than a satisfactory rating for efficiency. In terms of sustainability, the tire produced in Turkey does not go beyond an adequate assessment.
Category scores (% of best)
All discipline results (11)
Discipline positions compare the ranked tyres in this test, not the whole market. These are individual measurements, not weighted overall scores.
| Test | Position in discipline | Result | Gap to best |
|---|---|---|---|
| Dry BrakingLower is better | 11th / 50 | 37.4 m | +1.50 m |
| Wet BrakingLower is better | 7th / 50 | 36.8 m | +2.40 m |
| Wet Braking - ConcreteLower is better | 4th / 50 | 35.8 m | +0.60 m |
| Straight AquaHigher is better | 33rd / 50 | 79.7 km/h | -7.00 km/h |
| Curved AquaplaningHigher is better | 19th / 50 | 3.5 m/sec2 | -0.50 m/sec2 |
| NoiseLower is better | 42nd / 50 | 71.9 dB | +2.80 dB |
| Tyre WeightLower is better | 40th / 50 | 9 Kg | +1.40 Kg |
| WearHigher is better | 15th / 50 | 40800 KM | -30,700.00 KM |
| ValueLower is better | 25th / 50 | 2.18 Price/1000 | +1.15 Price/1000 |
| Fuel ConsumptionLower is better | 43rd / 50 | 5.9 l/100km | +0.40 l/100km |
| AbrasionLower is better | 22nd / 50 | 75.7 mg/km/t | +40.90 mg/km/t |
- EU Label
- C/A/67
- Price
- 89.00
Continental UltraContact
205/55 R16 91V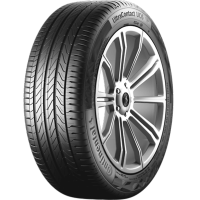
Environmental balance: In the environmental balance, the UltraContact secures one of the best results in the test. His predicted mileage is classified as very good, and he only just misses a very good rating for wear. The tire also scores with its low weight and low fuel consumption.
Category scores (% of best)
All discipline results (11)
Discipline positions compare the ranked tyres in this test, not the whole market. These are individual measurements, not weighted overall scores.
| Test | Position in discipline | Result | Gap to best |
|---|---|---|---|
| Dry BrakingLower is better | 7th / 50 | 37.1 m | +1.20 m |
| Wet BrakingLower is better | 16th / 50 | 38.3 m | +3.90 m |
| Wet Braking - ConcreteLower is better | 16th / 50 | 38.7 m | +3.50 m |
| Straight AquaHigher is better | 46th / 50 | 76.5 km/h | -10.20 km/h |
| Curved AquaplaningHigher is better | 46th / 50 | 2.9 m/sec2 | -1.10 m/sec2 |
| NoiseLower is better | 23rd / 50 | 71 dB | +1.90 dB |
| Tyre WeightLower is better | 9th / 50 | 8.2 Kg | +0.60 Kg |
| WearHigher is better | 5th / 50 | 55900 KM | -15,600.00 KM |
| ValueLower is better | 20th / 50 | 2.02 Price/1000 | +0.99 Price/1000 |
| Fuel ConsumptionLower is better | 10th / 50 | 5.7 l/100km | +0.20 l/100km |
| AbrasionLower is better | 3rd / 50 | 52.5 mg/km/t | +17.70 mg/km/t |
- EU Label
- B/A/69
- Price
- 113.00
Kumho Ecsta HS52
205/55 R16 91V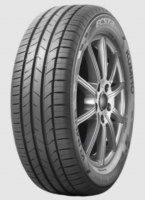
Environmental balance: When it comes to the environmental balance, the Kumho does not get more than a satisfactory result. Although it scores in terms of predicted mileage and abrasion, but offers only satisfactory efficiency due to the higher tire weight. In terms of sustainability, the tire produced in China is rated as sufficient.
Category scores (% of best)
All discipline results (11)
Discipline positions compare the ranked tyres in this test, not the whole market. These are individual measurements, not weighted overall scores.
| Test | Position in discipline | Result | Gap to best |
|---|---|---|---|
| Dry BrakingLower is better | 3rd / 50 | 36.7 m | +0.80 m |
| Wet BrakingLower is better | 17th / 50 | 38.4 m | +4.00 m |
| Wet Braking - ConcreteLower is better | 9th / 50 | 37.6 m | +2.40 m |
| Straight AquaHigher is better | 13th / 50 | 81.9 km/h | -4.80 km/h |
| Curved AquaplaningHigher is better | 33rd / 50 | 3.3 m/sec2 | -0.70 m/sec2 |
| NoiseLower is better | 23rd / 50 | 71 dB | +1.90 dB |
| Tyre WeightLower is better | 41st / 50 | 9.1 Kg | +1.50 Kg |
| WearHigher is better | 12th / 50 | 43500 KM | -28,000.00 KM |
| ValueLower is better | 13th / 50 | 1.89 Price/1000 | +0.86 Price/1000 |
| Fuel ConsumptionLower is better | 43rd / 50 | 5.9 l/100km | +0.40 l/100km |
| AbrasionLower is better | 29th / 50 | 79.3 mg/km/t | +44.50 mg/km/t |
- EU Label
- C/A/71
- Price
- 82.00
Hankook Ventus Prime 4
205/55 R16 91V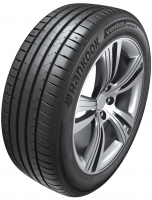
Environmental balance: In the environmental balance, the Ventus Prime4 gets a good rating for the predicted mileage and for its abrasion. In terms of efficiency, on the other hand, it loses out due to its relatively high weight. All in all, it does not go beyond a satisfactory result in terms of the environmental balance.
Category scores (% of best)
All discipline results (11)
Discipline positions compare the ranked tyres in this test, not the whole market. These are individual measurements, not weighted overall scores.
| Test | Position in discipline | Result | Gap to best |
|---|---|---|---|
| Dry BrakingLower is better | 2nd / 50 | 36.6 m | +0.70 m |
| Wet BrakingLower is better | 3rd / 50 | 35.8 m | +1.40 m |
| Wet Braking - ConcreteLower is better | 2nd / 50 | 35.5 m | +0.30 m |
| Straight AquaHigher is better | 43rd / 50 | 77.6 km/h | -9.10 km/h |
| Curved AquaplaningHigher is better | 39th / 50 | 3.2 m/sec2 | -0.80 m/sec2 |
| NoiseLower is better | 38th / 50 | 71.7 dB | +2.60 dB |
| Tyre WeightLower is better | 41st / 50 | 9.1 Kg | +1.50 Kg |
| WearHigher is better | 13th / 50 | 42200 KM | -29,300.00 KM |
| ValueLower is better | 22nd / 50 | 2.11 Price/1000 | +1.08 Price/1000 |
| Fuel ConsumptionLower is better | 28th / 50 | 5.8 l/100km | +0.30 l/100km |
| AbrasionLower is better | 8th / 50 | 67.6 mg/km/t | +32.80 mg/km/t |
- EU Label
- C/A/69
- Price
- 89.00
Nexen N Fera Primus
205/55 R16 91V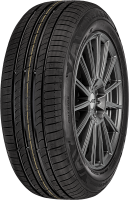
Environmental balance: In terms of environmental balance, the Nexen does not get more than a satisfactory result. Both its predicted mileage and its abrasion are classified as satisfactory.
Category scores (% of best)
All discipline results (11)
Discipline positions compare the ranked tyres in this test, not the whole market. These are individual measurements, not weighted overall scores.
| Test | Position in discipline | Result | Gap to best |
|---|---|---|---|
| Dry BrakingLower is better | 19th / 50 | 38.2 m | +2.30 m |
| Wet BrakingLower is better | 15th / 50 | 38.2 m | +3.80 m |
| Wet Braking - ConcreteLower is better | 12th / 50 | 37.9 m | +2.70 m |
| Straight AquaHigher is better | 4th / 50 | 84.5 km/h | -2.20 km/h |
| Curved AquaplaningHigher is better | 8th / 50 | 3.7 m/sec2 | -0.30 m/sec2 |
| NoiseLower is better | 18th / 50 | 70.7 dB | +1.60 dB |
| Tyre WeightLower is better | 19th / 50 | 8.4 Kg | +0.80 Kg |
| WearHigher is better | 38th / 50 | 33300 KM | -38,200.00 KM |
| ValueLower is better | 39th / 50 | 2.58 Price/1000 | +1.55 Price/1000 |
| Fuel ConsumptionLower is better | 10th / 50 | 5.7 l/100km | +0.20 l/100km |
| AbrasionLower is better | 40th / 50 | 88.1 mg/km/t | +53.30 mg/km/t |
- EU Label
- D/A/71
- Price
- 86.00
Kenda Kenetica Pro KR210
205/55 R16 91V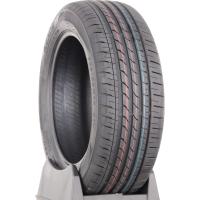
Environmental balance: When it comes to the environmental balance, the Kenda does not get beyond a satisfactory result. Both its predicted mileage and its abrasion are classified as satisfactory. In terms of sustainability, the tire produced in Taiwan is rated as sufficient.
Category scores (% of best)
All discipline results (11)
Discipline positions compare the ranked tyres in this test, not the whole market. These are individual measurements, not weighted overall scores.
| Test | Position in discipline | Result | Gap to best |
|---|---|---|---|
| Dry BrakingLower is better | 32nd / 50 | 39.5 m | +3.60 m |
| Wet BrakingLower is better | 22nd / 50 | 40.2 m | +5.80 m |
| Wet Braking - ConcreteLower is better | 25th / 50 | 40.1 m | +4.90 m |
| Straight AquaHigher is better | 5th / 50 | 84.1 km/h | -2.60 km/h |
| Curved AquaplaningHigher is better | 8th / 50 | 3.7 m/sec2 | -0.30 m/sec2 |
| NoiseLower is better | 23rd / 50 | 71 dB | +1.90 dB |
| Tyre WeightLower is better | 36th / 50 | 8.9 Kg | +1.30 Kg |
| WearHigher is better | 33rd / 50 | 35100 KM | -36,400.00 KM |
| ValueLower is better | 28th / 50 | 2.25 Price/1000 | +1.22 Price/1000 |
| Fuel ConsumptionLower is better | 10th / 50 | 5.7 l/100km | +0.20 l/100km |
| AbrasionLower is better | 38th / 50 | 87 mg/km/t | +52.20 mg/km/t |
- EU Label
- C/B/69
- Price
- 79.00
Kleber Dynaxer HP4
205/55 R16 91V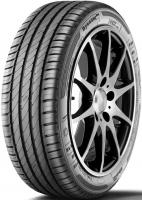
Environmental balance: In the environmental balance, the Dynaxer HP4 secures a good result in the test. Both its predicted mileage and its abrasion are rated as good. The tire also scores with its low fuel consumption, but it just misses out on a good rating in terms of weight.
Category scores (% of best)
All discipline results (11)
Discipline positions compare the ranked tyres in this test, not the whole market. These are individual measurements, not weighted overall scores.
| Test | Position in discipline | Result | Gap to best |
|---|---|---|---|
| Dry BrakingLower is better | 9th / 50 | 37.3 m | +1.40 m |
| Wet BrakingLower is better | 22nd / 50 | 40.2 m | +5.80 m |
| Wet Braking - ConcreteLower is better | 24th / 50 | 39.5 m | +4.30 m |
| Straight AquaHigher is better | 19th / 50 | 81.3 km/h | -5.40 km/h |
| Curved AquaplaningHigher is better | 8th / 50 | 3.7 m/sec2 | -0.30 m/sec2 |
| NoiseLower is better | 8th / 50 | 70.3 dB | +1.20 dB |
| Tyre WeightLower is better | 34th / 50 | 8.8 Kg | +1.20 Kg |
| WearHigher is better | 7th / 50 | 48000 KM | -23,500.00 KM |
| ValueLower is better | 11th / 50 | 1.83 Price/1000 | +0.80 Price/1000 |
| Fuel ConsumptionLower is better | 10th / 50 | 5.7 l/100km | +0.20 l/100km |
| AbrasionLower is better | 6th / 50 | 63.5 mg/km/t | +28.70 mg/km/t |
- EU Label
- C/A/68
- Price
- 88.00
Fulda EcoControl HP2
205/55 R16 91V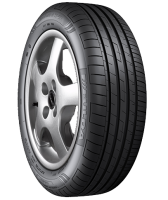
Environmental balance: In the environmental balance, the EcoControl HP2 secures a good result in the test. Both its predicted mileage and its abrasion are rated as good. In addition, it can also get a good result with its low fuel consumption and low weight in terms of efficiency.
Category scores (% of best)
All discipline results (11)
Discipline positions compare the ranked tyres in this test, not the whole market. These are individual measurements, not weighted overall scores.
| Test | Position in discipline | Result | Gap to best |
|---|---|---|---|
| Dry BrakingLower is better | 17th / 50 | 38 m | +2.10 m |
| Wet BrakingLower is better | 26th / 50 | 40.8 m | +6.40 m |
| Wet Braking - ConcreteLower is better | 31st / 50 | 41.1 m | +5.90 m |
| Straight AquaHigher is better | 23rd / 50 | 80.8 km/h | -5.90 km/h |
| Curved AquaplaningHigher is better | 3rd / 50 | 3.8 m/sec2 | -0.20 m/sec2 |
| NoiseLower is better | 30th / 50 | 71.2 dB | +2.10 dB |
| Tyre WeightLower is better | 5th / 50 | 7.9 Kg | +0.30 Kg |
| WearHigher is better | 8th / 50 | 47500 KM | -24,000.00 KM |
| ValueLower is better | 13th / 50 | 1.89 Price/1000 | +0.86 Price/1000 |
| Fuel ConsumptionLower is better | 28th / 50 | 5.8 l/100km | +0.30 l/100km |
| AbrasionLower is better | 11th / 50 | 70.1 mg/km/t | +35.30 mg/km/t |
- EU Label
- C/B/70
- Price
- 90.00
Toyo Proxes Comfort
205/55 R16 91V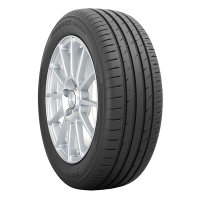
Environmental balance: In the environmental balance, the Proxes Comfort secured a good result in the test. Both its predicted mileage and its abrasion are rated as good. In addition, it can also get a good result with its low fuel consumption and low weight in terms of efficiency. In terms of sustainability, the tire produced in Japan does not go beyond a sufficient result.
Category scores (% of best)
All discipline results (11)
Discipline positions compare the ranked tyres in this test, not the whole market. These are individual measurements, not weighted overall scores.
| Test | Position in discipline | Result | Gap to best |
|---|---|---|---|
| Dry BrakingLower is better | 14th / 50 | 37.8 m | +1.90 m |
| Wet BrakingLower is better | 25th / 50 | 40.6 m | +6.20 m |
| Wet Braking - ConcreteLower is better | 17th / 50 | 38.8 m | +3.60 m |
| Straight AquaHigher is better | 40th / 50 | 78.3 km/h | -8.40 km/h |
| Curved AquaplaningHigher is better | 19th / 50 | 3.5 m/sec2 | -0.50 m/sec2 |
| NoiseLower is better | 10th / 50 | 70.4 dB | +1.30 dB |
| Tyre WeightLower is better | 11th / 50 | 8.3 Kg | +0.70 Kg |
| WearHigher is better | 14th / 50 | 41700 KM | -29,800.00 KM |
| ValueLower is better | 19th / 50 | 2.01 Price/1000 | +0.98 Price/1000 |
| Fuel ConsumptionLower is better | 28th / 50 | 5.8 l/100km | +0.30 l/100km |
| AbrasionLower is better | 25th / 50 | 75.9 mg/km/t | +41.10 mg/km/t |
- EU Label
- C/A/70
- Price
- 84.00
Debica Presto HP 2
205/55 R16 91V
Environmental balance: In the environmental balance, the Presto HP 2 secures a good result in the test. Both its predicted mileage and its abrasion are rated as good. In addition, it can also get a good result with its fuel consumption and low weight in terms of efficiency.
Category scores (% of best)
All discipline results (11)
Discipline positions compare the ranked tyres in this test, not the whole market. These are individual measurements, not weighted overall scores.
| Test | Position in discipline | Result | Gap to best |
|---|---|---|---|
| Dry BrakingLower is better | 28th / 50 | 39.4 m | +3.50 m |
| Wet BrakingLower is better | 33rd / 50 | 41.8 m | +7.40 m |
| Wet Braking - ConcreteLower is better | 34th / 50 | 41.7 m | +6.50 m |
| Straight AquaHigher is better | 12th / 50 | 82.1 km/h | -4.60 km/h |
| Curved AquaplaningHigher is better | 2nd / 50 | 3.9 m/sec2 | -0.10 m/sec2 |
| NoiseLower is better | 28th / 50 | 71.1 dB | +2.00 dB |
| Tyre WeightLower is better | 8th / 50 | 8.1 Kg | +0.50 Kg |
| WearHigher is better | 10th / 50 | 45700 KM | -25,800.00 KM |
| ValueLower is better | 10th / 50 | 1.77 Price/1000 | +0.74 Price/1000 |
| Fuel ConsumptionLower is better | 43rd / 50 | 5.9 l/100km | +0.40 l/100km |
| AbrasionLower is better | 19th / 50 | 74 mg/km/t | +39.20 mg/km/t |
- EU Label
- D/B/70
- Price
- 81.00
Dunlop Sport BluResponse
205/55 R16 91V
Category scores (% of best)
All discipline results (11)
Discipline positions compare the ranked tyres in this test, not the whole market. These are individual measurements, not weighted overall scores.
| Test | Position in discipline | Result | Gap to best |
|---|---|---|---|
| Dry BrakingLower is better | 14th / 50 | 37.8 m | +1.90 m |
| Wet BrakingLower is better | 31st / 50 | 41.5 m | +7.10 m |
| Wet Braking - ConcreteLower is better | 26th / 50 | 40.2 m | +5.00 m |
| Straight AquaHigher is better | 9th / 50 | 82.5 km/h | -4.20 km/h |
| Curved AquaplaningHigher is better | 3rd / 50 | 3.8 m/sec2 | -0.20 m/sec2 |
| NoiseLower is better | 39th / 50 | 71.8 dB | +2.70 dB |
| Tyre WeightLower is better | 3rd / 50 | 7.7 Kg | +0.10 Kg |
| WearHigher is better | 28th / 50 | 36900 KM | -34,600.00 KM |
| ValueLower is better | 47th / 50 | 2.98 Price/1000 | +1.95 Price/1000 |
| Fuel ConsumptionLower is better | 10th / 50 | 5.7 l/100km | +0.20 l/100km |
| AbrasionLower is better | 32nd / 50 | 80.2 mg/km/t | +45.40 mg/km/t |
- EU Label
- B/A/68
- Price
- 110.00
Pirelli Cinturato P7 C2
205/55 R16 91V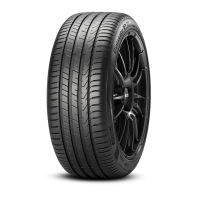
Environmental balance: The Cinturato P7 C2 also missed out on a good result in terms of the environmental balance. His predicted mileage is still rated as good, but he does not get more than a satisfactory result when it comes to abrasion. It doesn't help that its fuel consumption and weight are rated as good.
Category scores (% of best)
All discipline results (11)
Discipline positions compare the ranked tyres in this test, not the whole market. These are individual measurements, not weighted overall scores.
| Test | Position in discipline | Result | Gap to best |
|---|---|---|---|
| Dry BrakingLower is better | 6th / 50 | 37 m | +1.10 m |
| Wet BrakingLower is better | 24th / 50 | 40.3 m | +5.90 m |
| Wet Braking - ConcreteLower is better | 19th / 50 | 39.1 m | +3.90 m |
| Straight AquaHigher is better | 15th / 50 | 81.8 km/h | -4.90 km/h |
| Curved AquaplaningHigher is better | 8th / 50 | 3.7 m/sec2 | -0.30 m/sec2 |
| NoiseLower is better | 12th / 50 | 70.5 dB | +1.40 dB |
| Tyre WeightLower is better | 29th / 50 | 8.7 Kg | +1.10 Kg |
| WearHigher is better | 21st / 50 | 39500 KM | -32,000.00 KM |
| ValueLower is better | 42nd / 50 | 2.71 Price/1000 | +1.68 Price/1000 |
| Fuel ConsumptionLower is better | 10th / 50 | 5.7 l/100km | +0.20 l/100km |
| AbrasionLower is better | 36th / 50 | 82.1 mg/km/t | +47.30 mg/km/t |
- EU Label
- C/A/69
- Price
- 107.00
Sava Intensa HP2
205/55 R16 91V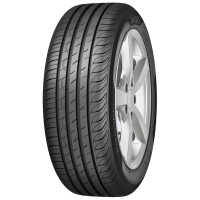
Category scores (% of best)
All discipline results (11)
Discipline positions compare the ranked tyres in this test, not the whole market. These are individual measurements, not weighted overall scores.
| Test | Position in discipline | Result | Gap to best |
|---|---|---|---|
| Dry BrakingLower is better | 19th / 50 | 38.2 m | +2.30 m |
| Wet BrakingLower is better | 27th / 50 | 40.9 m | +6.50 m |
| Wet Braking - ConcreteLower is better | 30th / 50 | 40.9 m | +5.70 m |
| Straight AquaHigher is better | 19th / 50 | 81.3 km/h | -5.40 km/h |
| Curved AquaplaningHigher is better | 3rd / 50 | 3.8 m/sec2 | -0.20 m/sec2 |
| NoiseLower is better | 34th / 50 | 71.5 dB | +2.40 dB |
| Tyre WeightLower is better | 6th / 50 | 8 Kg | +0.40 Kg |
| WearHigher is better | 23rd / 50 | 38600 KM | -32,900.00 KM |
| ValueLower is better | 27th / 50 | 2.23 Price/1000 | +1.20 Price/1000 |
| Fuel ConsumptionLower is better | 10th / 50 | 5.7 l/100km | +0.20 l/100km |
| AbrasionLower is better | 34th / 50 | 81.4 mg/km/t | +46.60 mg/km/t |
- EU Label
- C/B/70
- Price
- 86.00
Semperit Speed Life 3
205/55 R16 91V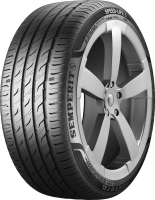
Category scores (% of best)
All discipline results (11)
Discipline positions compare the ranked tyres in this test, not the whole market. These are individual measurements, not weighted overall scores.
| Test | Position in discipline | Result | Gap to best |
|---|---|---|---|
| Dry BrakingLower is better | 36th / 50 | 39.7 m | +3.80 m |
| Wet BrakingLower is better | 10th / 50 | 37.2 m | +2.80 m |
| Wet Braking - ConcreteLower is better | 3rd / 50 | 35.7 m | +0.50 m |
| Straight AquaHigher is better | 15th / 50 | 81.8 km/h | -4.90 km/h |
| Curved AquaplaningHigher is better | 3rd / 50 | 3.8 m/sec2 | -0.20 m/sec2 |
| NoiseLower is better | 18th / 50 | 70.7 dB | +1.60 dB |
| Tyre WeightLower is better | 22nd / 50 | 8.5 Kg | +0.90 Kg |
| WearHigher is better | 18th / 50 | 40000 KM | -31,500.00 KM |
| ValueLower is better | 30th / 50 | 2.28 Price/1000 | +1.25 Price/1000 |
| Fuel ConsumptionLower is better | 28th / 50 | 5.8 l/100km | +0.30 l/100km |
| AbrasionLower is better | 29th / 50 | 79.3 mg/km/t | +44.50 mg/km/t |
- EU Label
- C/B/71
- Price
- 91.00
Firestone RoadHawk
205/55 R16 91V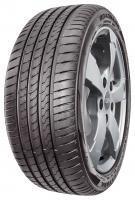
Category scores (% of best)
All discipline results (11)
Discipline positions compare the ranked tyres in this test, not the whole market. These are individual measurements, not weighted overall scores.
| Test | Position in discipline | Result | Gap to best |
|---|---|---|---|
| Dry BrakingLower is better | 18th / 50 | 38.1 m | +2.20 m |
| Wet BrakingLower is better | 32nd / 50 | 41.7 m | +7.30 m |
| Wet Braking - ConcreteLower is better | 28th / 50 | 40.6 m | +5.40 m |
| Straight AquaHigher is better | 6th / 50 | 83.6 km/h | -3.10 km/h |
| Curved AquaplaningHigher is better | 3rd / 50 | 3.8 m/sec2 | -0.20 m/sec2 |
| NoiseLower is better | 47th / 50 | 72.4 dB | +3.30 dB |
| Tyre WeightLower is better | 1st / 50 | 7.6 Kg | Best in this discipline |
| WearHigher is better | 25th / 50 | 38200 KM | -33,300.00 KM |
| ValueLower is better | 31st / 50 | 2.3 Price/1000 | +1.27 Price/1000 |
| Fuel ConsumptionLower is better | 43rd / 50 | 5.9 l/100km | +0.40 l/100km |
| AbrasionLower is better | 9th / 50 | 68.7 mg/km/t | +33.90 mg/km/t |
- EU Label
- C/A/70
- Price
- 88.00
BFGoodrich Advantage
205/55 R16 91V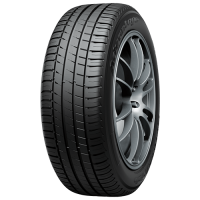
Category scores (% of best)
All discipline results (11)
Discipline positions compare the ranked tyres in this test, not the whole market. These are individual measurements, not weighted overall scores.
| Test | Position in discipline | Result | Gap to best |
|---|---|---|---|
| Dry BrakingLower is better | 8th / 50 | 37.2 m | +1.30 m |
| Wet BrakingLower is better | 21st / 50 | 39.8 m | +5.40 m |
| Wet Braking - ConcreteLower is better | 18th / 50 | 39 m | +3.80 m |
| Straight AquaHigher is better | 19th / 50 | 81.3 km/h | -5.40 km/h |
| Curved AquaplaningHigher is better | 19th / 50 | 3.5 m/sec2 | -0.50 m/sec2 |
| NoiseLower is better | 44th / 50 | 72.3 dB | +3.20 dB |
| Tyre WeightLower is better | 29th / 50 | 8.7 Kg | +1.10 Kg |
| WearHigher is better | 26th / 50 | 37300 KM | -34,200.00 KM |
| ValueLower is better | 38th / 50 | 2.57 Price/1000 | +1.54 Price/1000 |
| Fuel ConsumptionLower is better | 10th / 50 | 5.7 l/100km | +0.20 l/100km |
| AbrasionLower is better | 12th / 50 | 71.2 mg/km/t | +36.40 mg/km/t |
- EU Label
- C/A/70
- Price
- 96.00
GT Radial FE2
205/55 R16 91V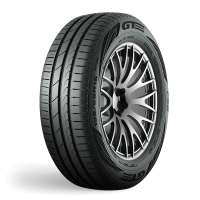
Category scores (% of best)
All discipline results (11)
Discipline positions compare the ranked tyres in this test, not the whole market. These are individual measurements, not weighted overall scores.
| Test | Position in discipline | Result | Gap to best |
|---|---|---|---|
| Dry BrakingLower is better | 28th / 50 | 39.4 m | +3.50 m |
| Wet BrakingLower is better | 28th / 50 | 41.1 m | +6.70 m |
| Wet Braking - ConcreteLower is better | 32nd / 50 | 41.3 m | +6.10 m |
| Straight AquaHigher is better | 17th / 50 | 81.5 km/h | -5.20 km/h |
| Curved AquaplaningHigher is better | 19th / 50 | 3.5 m/sec2 | -0.50 m/sec2 |
| NoiseLower is better | 36th / 50 | 71.6 dB | +2.50 dB |
| Tyre WeightLower is better | 29th / 50 | 8.7 Kg | +1.10 Kg |
| WearHigher is better | 33rd / 50 | 35100 KM | -36,400.00 KM |
| ValueLower is better | 17th / 50 | 1.99 Price/1000 | +0.96 Price/1000 |
| Fuel ConsumptionLower is better | 10th / 50 | 5.7 l/100km | +0.20 l/100km |
| AbrasionLower is better | 37th / 50 | 83.8 mg/km/t | +49.00 mg/km/t |
- EU Label
- C/A/69
- Price
- 70.00
ESA Tecar Spirit Pro
205/55 R16 91V
Category scores (% of best)
All discipline results (11)
Discipline positions compare the ranked tyres in this test, not the whole market. These are individual measurements, not weighted overall scores.
| Test | Position in discipline | Result | Gap to best |
|---|---|---|---|
| Dry BrakingLower is better | 32nd / 50 | 39.5 m | +3.60 m |
| Wet BrakingLower is better | 5th / 50 | 36.3 m | +1.90 m |
| Wet Braking - ConcreteLower is better | 6th / 50 | 36.2 m | +1.00 m |
| Straight AquaHigher is better | 17th / 50 | 81.5 km/h | -5.20 km/h |
| Curved AquaplaningHigher is better | 14th / 50 | 3.6 m/sec2 | -0.40 m/sec2 |
| NoiseLower is better | 23rd / 50 | 71 dB | +1.90 dB |
| Tyre WeightLower is better | 19th / 50 | 8.4 Kg | +0.80 Kg |
| WearHigher is better | 10th / 50 | 45700 KM | -25,800.00 KM |
| ValueLower is better | 3rd / 50 | 1.47 Price/1000 | +0.44 Price/1000 |
| Fuel ConsumptionLower is better | 3rd / 50 | 5.6 l/100km | +0.10 l/100km |
| AbrasionLower is better | 21st / 50 | 74.3 mg/km/t | +39.50 mg/km/t |
- EU Label
- C/A/71
- Price
- 67.00
Barum Bravuris 5HM
205/55 R16 91V
Category scores (% of best)
All discipline results (11)
Discipline positions compare the ranked tyres in this test, not the whole market. These are individual measurements, not weighted overall scores.
| Test | Position in discipline | Result | Gap to best |
|---|---|---|---|
| Dry BrakingLower is better | 47th / 50 | 41 m | +5.10 m |
| Wet BrakingLower is better | 29th / 50 | 41.4 m | +7.00 m |
| Wet Braking - ConcreteLower is better | 35th / 50 | 41.9 m | +6.70 m |
| Straight AquaHigher is better | 26th / 50 | 80.4 km/h | -6.30 km/h |
| Curved AquaplaningHigher is better | 19th / 50 | 3.5 m/sec2 | -0.50 m/sec2 |
| NoiseLower is better | 47th / 50 | 72.4 dB | +3.30 dB |
| Tyre WeightLower is better | 11th / 50 | 8.3 Kg | +0.70 Kg |
| WearHigher is better | 30th / 50 | 36000 KM | -35,500.00 KM |
| ValueLower is better | 33rd / 50 | 2.39 Price/1000 | +1.36 Price/1000 |
| Fuel ConsumptionLower is better | 3rd / 50 | 5.6 l/100km | +0.10 l/100km |
| AbrasionLower is better | 35th / 50 | 81.7 mg/km/t | +46.90 mg/km/t |
- EU Label
- C/B/71
- Price
- 86.00
Viking Protech Newgen
205/55 R16 91V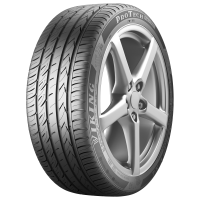
Category scores (% of best)
All discipline results (11)
Discipline positions compare the ranked tyres in this test, not the whole market. These are individual measurements, not weighted overall scores.
| Test | Position in discipline | Result | Gap to best |
|---|---|---|---|
| Dry BrakingLower is better | 43rd / 50 | 40.3 m | +4.40 m |
| Wet BrakingLower is better | 40th / 50 | 44.2 m | +9.80 m |
| Wet Braking - ConcreteLower is better | 33rd / 50 | 41.5 m | +6.30 m |
| Straight AquaHigher is better | 31st / 50 | 80 km/h | -6.70 km/h |
| Curved AquaplaningHigher is better | 14th / 50 | 3.6 m/sec2 | -0.40 m/sec2 |
| NoiseLower is better | 15th / 50 | 70.6 dB | +1.50 dB |
| Tyre WeightLower is better | 11th / 50 | 8.3 Kg | +0.70 Kg |
| WearHigher is better | 18th / 50 | 40000 KM | -31,500.00 KM |
| ValueLower is better | 18th / 50 | 2 Price/1000 | +0.97 Price/1000 |
| Fuel ConsumptionLower is better | 28th / 50 | 5.8 l/100km | +0.30 l/100km |
| AbrasionLower is better | 27th / 50 | 78.2 mg/km/t | +43.40 mg/km/t |
- EU Label
- C/B/71
- Price
- 80.00
Norauto Prevensys 4
205/55 R16 91V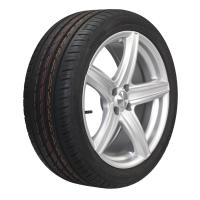
Category scores (% of best)
All discipline results (11)
Discipline positions compare the ranked tyres in this test, not the whole market. These are individual measurements, not weighted overall scores.
| Test | Position in discipline | Result | Gap to best |
|---|---|---|---|
| Dry BrakingLower is better | 23rd / 50 | 39 m | +3.10 m |
| Wet BrakingLower is better | 9th / 50 | 36.9 m | +2.50 m |
| Wet Braking - ConcreteLower is better | 12th / 50 | 37.9 m | +2.70 m |
| Straight AquaHigher is better | 27th / 50 | 80.3 km/h | -6.40 km/h |
| Curved AquaplaningHigher is better | 8th / 50 | 3.7 m/sec2 | -0.30 m/sec2 |
| NoiseLower is better | 6th / 50 | 70.1 dB | +1.00 dB |
| Tyre WeightLower is better | 22nd / 50 | 8.5 Kg | +0.90 Kg |
| WearHigher is better | 31st / 50 | 35500 KM | -36,000.00 KM |
| ValueLower is better | 11th / 50 | 1.83 Price/1000 | +0.80 Price/1000 |
| Fuel ConsumptionLower is better | 28th / 50 | 5.8 l/100km | +0.30 l/100km |
| AbrasionLower is better | 44th / 50 | 94.3 mg/km/t | +59.50 mg/km/t |
- EU Label
- C/A/71
- Price
- 65.00
Apollo Alnac 4g
205/55 R16 91V
Category scores (% of best)
All discipline results (11)
Discipline positions compare the ranked tyres in this test, not the whole market. These are individual measurements, not weighted overall scores.
| Test | Position in discipline | Result | Gap to best |
|---|---|---|---|
| Dry BrakingLower is better | 26th / 50 | 39.3 m | +3.40 m |
| Wet BrakingLower is better | 34th / 50 | 42.2 m | +7.80 m |
| Wet Braking - ConcreteLower is better | 28th / 50 | 40.6 m | +5.40 m |
| Straight AquaHigher is better | 13th / 50 | 81.9 km/h | -4.80 km/h |
| Curved AquaplaningHigher is better | 19th / 50 | 3.5 m/sec2 | -0.50 m/sec2 |
| NoiseLower is better | 30th / 50 | 71.2 dB | +2.10 dB |
| Tyre WeightLower is better | 19th / 50 | 8.4 Kg | +0.80 Kg |
| WearHigher is better | 44th / 50 | 29700 KM | -41,800.00 KM |
| ValueLower is better | 48th / 50 | 3.03 Price/1000 | +2.00 Price/1000 |
| Fuel ConsumptionLower is better | 10th / 50 | 5.7 l/100km | +0.20 l/100km |
| AbrasionLower is better | 39th / 50 | 87.3 mg/km/t | +52.50 mg/km/t |
- EU Label
- C/C/70
- Price
- 90.00
General Altimax One S
205/55 R16 91V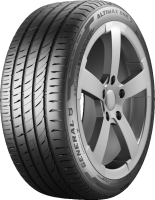
Category scores (% of best)
All discipline results (11)
Discipline positions compare the ranked tyres in this test, not the whole market. These are individual measurements, not weighted overall scores.
| Test | Position in discipline | Result | Gap to best |
|---|---|---|---|
| Dry BrakingLower is better | 41st / 50 | 40.2 m | +4.30 m |
| Wet BrakingLower is better | 39th / 50 | 43.9 m | +9.50 m |
| Wet Braking - ConcreteLower is better | 38th / 50 | 43.3 m | +8.10 m |
| Straight AquaHigher is better | 41st / 50 | 78.1 km/h | -8.60 km/h |
| Curved AquaplaningHigher is better | 19th / 50 | 3.5 m/sec2 | -0.50 m/sec2 |
| NoiseLower is better | 10th / 50 | 70.4 dB | +1.30 dB |
| Tyre WeightLower is better | 11th / 50 | 8.3 Kg | +0.70 Kg |
| WearHigher is better | 15th / 50 | 40800 KM | -30,700.00 KM |
| ValueLower is better | 6th / 50 | 1.57 Price/1000 | +0.54 Price/1000 |
| Fuel ConsumptionLower is better | 10th / 50 | 5.7 l/100km | +0.20 l/100km |
| AbrasionLower is better | 22nd / 50 | 75.7 mg/km/t | +40.90 mg/km/t |
- EU Label
- C/B/71
- Price
- 64.00
Giti GitiSynergyH2
205/55 R16 91V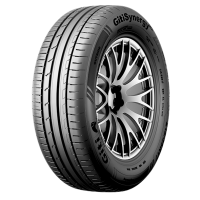
Category scores (% of best)
All discipline results (11)
Discipline positions compare the ranked tyres in this test, not the whole market. These are individual measurements, not weighted overall scores.
| Test | Position in discipline | Result | Gap to best |
|---|---|---|---|
| Dry BrakingLower is better | 28th / 50 | 39.4 m | +3.50 m |
| Wet BrakingLower is better | 36th / 50 | 43.5 m | +9.10 m |
| Wet Braking - ConcreteLower is better | 38th / 50 | 43.3 m | +8.10 m |
| Straight AquaHigher is better | 10th / 50 | 82.4 km/h | -4.30 km/h |
| Curved AquaplaningHigher is better | 14th / 50 | 3.6 m/sec2 | -0.40 m/sec2 |
| NoiseLower is better | 39th / 50 | 71.8 dB | +2.70 dB |
| Tyre WeightLower is better | 36th / 50 | 8.9 Kg | +1.30 Kg |
| WearHigher is better | 23rd / 50 | 38600 KM | -32,900.00 KM |
| ValueLower is better | 15th / 50 | 1.94 Price/1000 | +0.91 Price/1000 |
| Fuel ConsumptionLower is better | 10th / 50 | 5.7 l/100km | +0.20 l/100km |
| AbrasionLower is better | 33rd / 50 | 80.6 mg/km/t | +45.80 mg/km/t |
- EU Label
- C/A/71
- Price
- 75.00
Petlas Imperium PT515
205/55 R16 91V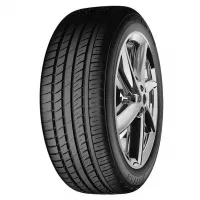
Category scores (% of best)
All discipline results (11)
Discipline positions compare the ranked tyres in this test, not the whole market. These are individual measurements, not weighted overall scores.
| Test | Position in discipline | Result | Gap to best |
|---|---|---|---|
| Dry BrakingLower is better | 26th / 50 | 39.3 m | +3.40 m |
| Wet BrakingLower is better | 37th / 50 | 43.6 m | +9.20 m |
| Wet Braking - ConcreteLower is better | 37th / 50 | 43.1 m | +7.90 m |
| Straight AquaHigher is better | 35th / 50 | 79.3 km/h | -7.40 km/h |
| Curved AquaplaningHigher is better | 33rd / 50 | 3.3 m/sec2 | -0.70 m/sec2 |
| NoiseLower is better | 50th / 50 | 73.6 dB | +4.50 dB |
| Tyre WeightLower is better | 46th / 50 | 9.2 Kg | +1.60 Kg |
| WearHigher is better | 8th / 50 | 47500 KM | -24,000.00 KM |
| ValueLower is better | 4th / 50 | 1.56 Price/1000 | +0.53 Price/1000 |
| Fuel ConsumptionLower is better | 43rd / 50 | 5.9 l/100km | +0.40 l/100km |
| AbrasionLower is better | 14th / 50 | 72.6 mg/km/t | +37.80 mg/km/t |
- EU Label
- C/B/71
- Price
- 74.00
Uniroyal RainSport 5
205/55 R16 91V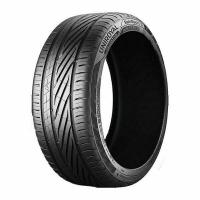
Environmental balance: In terms of environmental balance, the Uniroyal RainSport 5 is also clearly rated as satisfactory. Both its predicted mileage and its abrasion are classified as satisfactory. The efficiency is still rated as good thanks to the relatively low fuel consumption and weight.
Category scores (% of best)
All discipline results (11)
Discipline positions compare the ranked tyres in this test, not the whole market. These are individual measurements, not weighted overall scores.
| Test | Position in discipline | Result | Gap to best |
|---|---|---|---|
| Dry BrakingLower is better | 24th / 50 | 39.1 m | +3.20 m |
| Wet BrakingLower is better | 7th / 50 | 36.8 m | +2.40 m |
| Wet Braking - ConcreteLower is better | 7th / 50 | 36.3 m | +1.10 m |
| Straight AquaHigher is better | 1st / 50 | 86.7 km/h | Best in this discipline |
| Curved AquaplaningHigher is better | 1st / 50 | 4 m/sec2 | Best in this discipline |
| NoiseLower is better | 22nd / 50 | 70.9 dB | +1.80 dB |
| Tyre WeightLower is better | 22nd / 50 | 8.5 Kg | +0.90 Kg |
| WearHigher is better | 38th / 50 | 33300 KM | -38,200.00 KM |
| ValueLower is better | 44th / 50 | 2.76 Price/1000 | +1.73 Price/1000 |
| Fuel ConsumptionLower is better | 43rd / 50 | 5.9 l/100km | +0.40 l/100km |
| AbrasionLower is better | 43rd / 50 | 93.2 mg/km/t | +58.40 mg/km/t |
- EU Label
- C/A/71
- Price
- 92.00
Hifly HF201
205/55 R16 91V
Category scores (% of best)
All discipline results (11)
Discipline positions compare the ranked tyres in this test, not the whole market. These are individual measurements, not weighted overall scores.
| Test | Position in discipline | Result | Gap to best |
|---|---|---|---|
| Dry BrakingLower is better | 37th / 50 | 39.8 m | +3.90 m |
| Wet BrakingLower is better | 42nd / 50 | 44.5 m | +10.10 m |
| Wet Braking - ConcreteLower is better | 36th / 50 | 42.9 m | +7.70 m |
| Straight AquaHigher is better | 37th / 50 | 79.2 km/h | -7.50 km/h |
| Curved AquaplaningHigher is better | 40th / 50 | 3.1 m/sec2 | -0.90 m/sec2 |
| NoiseLower is better | 8th / 50 | 70.3 dB | +1.20 dB |
| Tyre WeightLower is better | 26th / 50 | 8.6 Kg | +1.00 Kg |
| WearHigher is better | 22nd / 50 | 39100 KM | -32,400.00 KM |
| ValueLower is better | 7th / 50 | 1.64 Price/1000 | +0.61 Price/1000 |
| Fuel ConsumptionLower is better | 43rd / 50 | 5.9 l/100km | +0.40 l/100km |
| AbrasionLower is better | 17th / 50 | 73.6 mg/km/t | +38.80 mg/km/t |
- EU Label
- D/C/71
- Price
- 64.00
Cooper Zeon CS8
205/55 R16 91V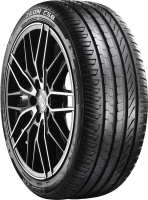
Category scores (% of best)
All discipline results (11)
Discipline positions compare the ranked tyres in this test, not the whole market. These are individual measurements, not weighted overall scores.
| Test | Position in discipline | Result | Gap to best |
|---|---|---|---|
| Dry BrakingLower is better | 21st / 50 | 38.6 m | +2.70 m |
| Wet BrakingLower is better | 2nd / 50 | 35 m | +0.60 m |
| Wet Braking - ConcreteLower is better | 9th / 50 | 37.6 m | +2.40 m |
| Straight AquaHigher is better | 22nd / 50 | 80.9 km/h | -5.80 km/h |
| Curved AquaplaningHigher is better | 33rd / 50 | 3.3 m/sec2 | -0.70 m/sec2 |
| NoiseLower is better | 7th / 50 | 70.2 dB | +1.10 dB |
| Tyre WeightLower is better | 49th / 50 | 9.6 Kg | +2.00 Kg |
| WearHigher is better | 42nd / 50 | 31500 KM | -40,000.00 KM |
| ValueLower is better | 40th / 50 | 2.63 Price/1000 | +1.60 Price/1000 |
| Fuel ConsumptionLower is better | 43rd / 50 | 5.9 l/100km | +0.40 l/100km |
| AbrasionLower is better | 47th / 50 | 97.7 mg/km/t | +62.90 mg/km/t |
- EU Label
- D/A/70
- Price
- 83.00
Westlake Z 107
205/55 R16 91V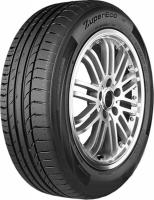
Category scores (% of best)
All discipline results (11)
Discipline positions compare the ranked tyres in this test, not the whole market. These are individual measurements, not weighted overall scores.
| Test | Position in discipline | Result | Gap to best |
|---|---|---|---|
| Dry BrakingLower is better | 24th / 50 | 39.1 m | +3.20 m |
| Wet BrakingLower is better | 29th / 50 | 41.4 m | +7.00 m |
| Wet Braking - ConcreteLower is better | 15th / 50 | 38.4 m | +3.20 m |
| Straight AquaHigher is better | 2nd / 50 | 84.6 km/h | -2.10 km/h |
| Curved AquaplaningHigher is better | 8th / 50 | 3.7 m/sec2 | -0.30 m/sec2 |
| NoiseLower is better | 34th / 50 | 71.5 dB | +2.40 dB |
| Tyre WeightLower is better | 26th / 50 | 8.6 Kg | +1.00 Kg |
| WearHigher is better | 46th / 50 | 27100 KM | -44,400.00 KM |
| ValueLower is better | 41st / 50 | 2.69 Price/1000 | +1.66 Price/1000 |
| Fuel ConsumptionLower is better | 28th / 50 | 5.8 l/100km | +0.30 l/100km |
| AbrasionLower is better | 42nd / 50 | 92.2 mg/km/t | +57.40 mg/km/t |
- EU Label
- D/B/71
- Price
- 73.00
Minerva Radial 209
205/55 R16 91V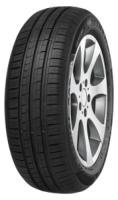
Category scores (% of best)
All discipline results (11)
Discipline positions compare the ranked tyres in this test, not the whole market. These are individual measurements, not weighted overall scores.
| Test | Position in discipline | Result | Gap to best |
|---|---|---|---|
| Dry BrakingLower is better | 45th / 50 | 40.8 m | +4.90 m |
| Wet BrakingLower is better | 43rd / 50 | 45.3 m | +10.90 m |
| Wet Braking - ConcreteLower is better | 45th / 50 | 44.8 m | +9.60 m |
| Straight AquaHigher is better | 30th / 50 | 80.1 km/h | -6.60 km/h |
| Curved AquaplaningHigher is better | 30th / 50 | 3.4 m/sec2 | -0.60 m/sec2 |
| NoiseLower is better | 30th / 50 | 71.2 dB | +2.10 dB |
| Tyre WeightLower is better | 11th / 50 | 8.3 Kg | +0.70 Kg |
| WearHigher is better | 35th / 50 | 34600 KM | -36,900.00 KM |
| ValueLower is better | 24th / 50 | 2.14 Price/1000 | +1.11 Price/1000 |
| Fuel ConsumptionLower is better | 10th / 50 | 5.7 l/100km | +0.20 l/100km |
| AbrasionLower is better | 17th / 50 | 73.6 mg/km/t | +38.80 mg/km/t |
- EU Label
- D/B/70
- Price
- 74.00
King Meiler Sport 1 KM
205/55 R16 91V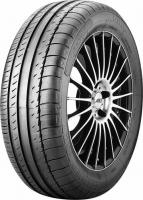
Category scores (% of best)
All discipline results (11)
Discipline positions compare the ranked tyres in this test, not the whole market. These are individual measurements, not weighted overall scores.
| Test | Position in discipline | Result | Gap to best |
|---|---|---|---|
| Dry BrakingLower is better | 35th / 50 | 39.6 m | +3.70 m |
| Wet BrakingLower is better | 35th / 50 | 43.1 m | +8.70 m |
| Wet Braking - ConcreteLower is better | 40th / 50 | 43.4 m | +8.20 m |
| Straight AquaHigher is better | 32nd / 50 | 79.9 km/h | -6.80 km/h |
| Curved AquaplaningHigher is better | 40th / 50 | 3.1 m/sec2 | -0.90 m/sec2 |
| NoiseLower is better | 28th / 50 | 71.1 dB | +2.00 dB |
| Tyre WeightLower is better | 34th / 50 | 8.8 Kg | +1.20 Kg |
| WearHigher is better | 28th / 50 | 36900 KM | -34,600.00 KM |
| ValueLower is better | 21st / 50 | 2.03 Price/1000 | +1.00 Price/1000 |
| Fuel ConsumptionLower is better | 1st / 50 | 5.5 l/100km | Best in this discipline |
| AbrasionLower is better | 28th / 50 | 78.9 mg/km/t | +44.10 mg/km/t |
- Price
- 75.00
Tomket Sport 3 Series 3
205/55 R16 91V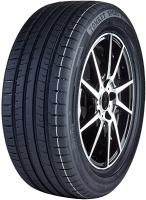
Category scores (% of best)
All discipline results (11)
Discipline positions compare the ranked tyres in this test, not the whole market. These are individual measurements, not weighted overall scores.
| Test | Position in discipline | Result | Gap to best |
|---|---|---|---|
| Dry BrakingLower is better | 22nd / 50 | 38.8 m | +2.90 m |
| Wet BrakingLower is better | 41st / 50 | 44.3 m | +9.90 m |
| Wet Braking - ConcreteLower is better | 44th / 50 | 44.4 m | +9.20 m |
| Straight AquaHigher is better | 44th / 50 | 77.3 km/h | -9.40 km/h |
| Curved AquaplaningHigher is better | 40th / 50 | 3.1 m/sec2 | -0.90 m/sec2 |
| NoiseLower is better | 36th / 50 | 71.6 dB | +2.50 dB |
| Tyre WeightLower is better | 1st / 50 | 7.6 Kg | Best in this discipline |
| WearHigher is better | 42nd / 50 | 31500 KM | -40,000.00 KM |
| ValueLower is better | 23rd / 50 | 2.13 Price/1000 | +1.10 Price/1000 |
| Fuel ConsumptionLower is better | 3rd / 50 | 5.6 l/100km | +0.10 l/100km |
| AbrasionLower is better | 22nd / 50 | 75.7 mg/km/t | +40.90 mg/km/t |
- EU Label
- C/B/69
- Price
- 67.00
Michelin e.Primacy
205/55 R16 91V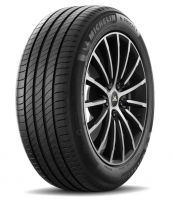
Environmental balance: In terms of environmental balance, the e.Primacy sets the standard in the test field. It offers a very high predicted mileage, gets a very good rating for the lowest wear and also scores points in terms of efficiency with very low fuel consumption and low tire weight. The Michelin e.Primacy also sets the bar high when it comes to sustainability and is the only tire that just barely misses a good rating. It offers a very high predicted mileage, gets a very good rating for the lowest wear and also scores points in terms of efficiency with very low fuel consumption and low tire weight. The Michelin e.Primacy also sets the bar high when it comes to sustainability and is the only tire that just barely misses a good rating. It offers a very high predicted mileage, gets a very good rating for the lowest wear and also scores points in terms of efficiency with very low fuel consumption and low tire weight. The Michelin e.Primacy also sets the bar high when it comes to sustainability and is the only tire that just barely misses a good rating.
Category scores (% of best)
All discipline results (11)
Discipline positions compare the ranked tyres in this test, not the whole market. These are individual measurements, not weighted overall scores.
| Test | Position in discipline | Result | Gap to best |
|---|---|---|---|
| Dry BrakingLower is better | 3rd / 50 | 36.7 m | +0.80 m |
| Wet BrakingLower is better | 38th / 50 | 43.7 m | +9.30 m |
| Wet Braking - ConcreteLower is better | 41st / 50 | 43.8 m | +8.60 m |
| Straight AquaHigher is better | 48th / 50 | 72.8 km/h | -13.90 km/h |
| Curved AquaplaningHigher is better | 47th / 50 | 2.8 m/sec2 | -1.20 m/sec2 |
| NoiseLower is better | 2nd / 50 | 69.8 dB | +0.70 dB |
| Tyre WeightLower is better | 6th / 50 | 8 Kg | +0.40 Kg |
| WearHigher is better | 1st / 50 | 71500 KM | Best in this discipline |
| ValueLower is better | 9th / 50 | 1.73 Price/1000 | +0.70 Price/1000 |
| Fuel ConsumptionLower is better | 1st / 50 | 5.5 l/100km | Best in this discipline |
| AbrasionLower is better | 1st / 50 | 34.8 mg/km/t | Best in this discipline |
- EU Label
- A/B/69
- Price
- 124.00
Laufenn S Fit EQ+
205/55 R16 91V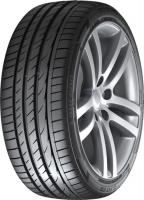
Category scores (% of best)
All discipline results (11)
Discipline positions compare the ranked tyres in this test, not the whole market. These are individual measurements, not weighted overall scores.
| Test | Position in discipline | Result | Gap to best |
|---|---|---|---|
| Dry BrakingLower is better | 12th / 50 | 37.6 m | +1.70 m |
| Wet BrakingLower is better | 20th / 50 | 39.5 m | +5.10 m |
| Wet Braking - ConcreteLower is better | 21st / 50 | 39.3 m | +4.10 m |
| Straight AquaHigher is better | 41st / 50 | 78.1 km/h | -8.60 km/h |
| Curved AquaplaningHigher is better | 30th / 50 | 3.4 m/sec2 | -0.60 m/sec2 |
| NoiseLower is better | 23rd / 50 | 71 dB | +1.90 dB |
| Tyre WeightLower is better | 9th / 50 | 8.2 Kg | +0.60 Kg |
| WearHigher is better | 48th / 50 | 25300 KM | -46,200.00 KM |
| ValueLower is better | 46th / 50 | 2.96 Price/1000 | +1.93 Price/1000 |
| Fuel ConsumptionLower is better | 28th / 50 | 5.8 l/100km | +0.30 l/100km |
| AbrasionLower is better | 46th / 50 | 96.8 mg/km/t | +62.00 mg/km/t |
- EU Label
- C/B/71
- Price
- 75.00
Delinte DH2
205/55 R16 91V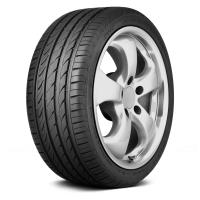
Category scores (% of best)
All discipline results (11)
Discipline positions compare the ranked tyres in this test, not the whole market. These are individual measurements, not weighted overall scores.
| Test | Position in discipline | Result | Gap to best |
|---|---|---|---|
| Dry BrakingLower is better | 32nd / 50 | 39.5 m | +3.60 m |
| Wet BrakingLower is better | 14th / 50 | 38.1 m | +3.70 m |
| Wet Braking - ConcreteLower is better | 14th / 50 | 38 m | +2.80 m |
| Straight AquaHigher is better | 45th / 50 | 77.2 km/h | -9.50 km/h |
| Curved AquaplaningHigher is better | 49th / 50 | 2.7 m/sec2 | -1.30 m/sec2 |
| NoiseLower is better | 1st / 50 | 69.1 dB | Best in this discipline |
| Tyre WeightLower is better | 29th / 50 | 8.7 Kg | +1.10 Kg |
| WearHigher is better | 45th / 50 | 27500 KM | -44,000.00 KM |
| ValueLower is better | 36th / 50 | 2.55 Price/1000 | +1.52 Price/1000 |
| Fuel ConsumptionLower is better | 3rd / 50 | 5.6 l/100km | +0.10 l/100km |
| AbrasionLower is better | 45th / 50 | 96.1 mg/km/t | +61.30 mg/km/t |
- EU Label
- B/B/71
- Price
- 70.00
Zeetex ZT1000
205/55 R16 91V
Category scores (% of best)
All discipline results (11)
Discipline positions compare the ranked tyres in this test, not the whole market. These are individual measurements, not weighted overall scores.
| Test | Position in discipline | Result | Gap to best |
|---|---|---|---|
| Dry BrakingLower is better | 39th / 50 | 39.9 m | +4.00 m |
| Wet BrakingLower is better | 18th / 50 | 39 m | +4.60 m |
| Wet Braking - ConcreteLower is better | 21st / 50 | 39.3 m | +4.10 m |
| Straight AquaHigher is better | 35th / 50 | 79.3 km/h | -7.40 km/h |
| Curved AquaplaningHigher is better | 40th / 50 | 3.1 m/sec2 | -0.90 m/sec2 |
| NoiseLower is better | 2nd / 50 | 69.8 dB | +0.70 dB |
| Tyre WeightLower is better | 29th / 50 | 8.7 Kg | +1.10 Kg |
| WearHigher is better | 50th / 50 | 23100 KM | -48,400.00 KM |
| ValueLower is better | 49th / 50 | 3.29 Price/1000 | +2.26 Price/1000 |
| Fuel ConsumptionLower is better | 10th / 50 | 5.7 l/100km | +0.20 l/100km |
| AbrasionLower is better | 49th / 50 | 112.6 mg/km/t | +77.80 mg/km/t |
- EU Label
- E/C/71
- Price
- 76.00
Avon ZV7
205/55 R16 91V
Category scores (% of best)
All discipline results (11)
Discipline positions compare the ranked tyres in this test, not the whole market. These are individual measurements, not weighted overall scores.
| Test | Position in discipline | Result | Gap to best |
|---|---|---|---|
| Dry BrakingLower is better | 28th / 50 | 39.4 m | +3.50 m |
| Wet BrakingLower is better | 13th / 50 | 38 m | +3.60 m |
| Wet Braking - ConcreteLower is better | 21st / 50 | 39.3 m | +4.10 m |
| Straight AquaHigher is better | 10th / 50 | 82.4 km/h | -4.30 km/h |
| Curved AquaplaningHigher is better | 30th / 50 | 3.4 m/sec2 | -0.60 m/sec2 |
| NoiseLower is better | 39th / 50 | 71.8 dB | +2.70 dB |
| Tyre WeightLower is better | 47th / 50 | 9.3 Kg | +1.70 Kg |
| WearHigher is better | 49th / 50 | 24000 KM | -47,500.00 KM |
| ValueLower is better | 50th / 50 | 3.75 Price/1000 | +2.72 Price/1000 |
| Fuel ConsumptionLower is better | 28th / 50 | 5.8 l/100km | +0.30 l/100km |
| AbrasionLower is better | 50th / 50 | 126 mg/km/t | +91.20 mg/km/t |
- EU Label
- D/A/70
- Price
- 90.00
Radar RPX800
205/55 R16 91V
Category scores (% of best)
All discipline results (11)
Discipline positions compare the ranked tyres in this test, not the whole market. These are individual measurements, not weighted overall scores.
| Test | Position in discipline | Result | Gap to best |
|---|---|---|---|
| Dry BrakingLower is better | 44th / 50 | 40.5 m | +4.60 m |
| Wet BrakingLower is better | 19th / 50 | 39.1 m | +4.70 m |
| Wet Braking - ConcreteLower is better | 27th / 50 | 40.5 m | +5.30 m |
| Straight AquaHigher is better | 39th / 50 | 79 km/h | -7.70 km/h |
| Curved AquaplaningHigher is better | 45th / 50 | 3 m/sec2 | -1.00 m/sec2 |
| NoiseLower is better | 4th / 50 | 69.9 dB | +0.80 dB |
| Tyre WeightLower is better | 36th / 50 | 8.9 Kg | +1.30 Kg |
| WearHigher is better | 46th / 50 | 27100 KM | -44,400.00 KM |
| ValueLower is better | 35th / 50 | 2.47 Price/1000 | +1.44 Price/1000 |
| Fuel ConsumptionLower is better | 28th / 50 | 5.8 l/100km | +0.30 l/100km |
| AbrasionLower is better | 48th / 50 | 101 mg/km/t | +66.20 mg/km/t |
- EU Label
- C/A/71
- Price
- 67.00
Rotalla RH01 E Pace
205/55 R16 91V
Category scores (% of best)
All discipline results (11)
Discipline positions compare the ranked tyres in this test, not the whole market. These are individual measurements, not weighted overall scores.
| Test | Position in discipline | Result | Gap to best |
|---|---|---|---|
| Dry BrakingLower is better | 40th / 50 | 40.1 m | +4.20 m |
| Wet BrakingLower is better | 44th / 50 | 45.9 m | +11.50 m |
| Wet Braking - ConcreteLower is better | 43rd / 50 | 44.2 m | +9.00 m |
| Straight AquaHigher is better | 23rd / 50 | 80.8 km/h | -5.90 km/h |
| Curved AquaplaningHigher is better | 33rd / 50 | 3.3 m/sec2 | -0.70 m/sec2 |
| NoiseLower is better | 18th / 50 | 70.7 dB | +1.60 dB |
| Tyre WeightLower is better | 22nd / 50 | 8.5 Kg | +0.90 Kg |
| WearHigher is better | 41st / 50 | 32900 KM | -38,600.00 KM |
| ValueLower is better | 26th / 50 | 2.19 Price/1000 | +1.16 Price/1000 |
| Fuel ConsumptionLower is better | 10th / 50 | 5.7 l/100km | +0.20 l/100km |
| AbrasionLower is better | 15th / 50 | 73.3 mg/km/t | +38.50 mg/km/t |
- EU Label
- C/B/69
- Price
- 72.00
Berlin Tires Summer UHP 1 G2
205/55 R16 91V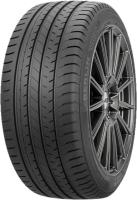
Category scores (% of best)
All discipline results (11)
Discipline positions compare the ranked tyres in this test, not the whole market. These are individual measurements, not weighted overall scores.
| Test | Position in discipline | Result | Gap to best |
|---|---|---|---|
| Dry BrakingLower is better | 45th / 50 | 40.8 m | +4.90 m |
| Wet BrakingLower is better | 48th / 50 | 54 m | +19.60 m |
| Wet Braking - ConcreteLower is better | 47th / 50 | 49 m | +13.80 m |
| Straight AquaHigher is better | 47th / 50 | 75 km/h | -11.70 km/h |
| Curved AquaplaningHigher is better | 40th / 50 | 3.1 m/sec2 | -0.90 m/sec2 |
| NoiseLower is better | 21st / 50 | 70.8 dB | +1.70 dB |
| Tyre WeightLower is better | 41st / 50 | 9.1 Kg | +1.50 Kg |
| WearHigher is better | 38th / 50 | 33300 KM | -38,200.00 KM |
| ValueLower is better | 4th / 50 | 1.56 Price/1000 | +0.53 Price/1000 |
| Fuel ConsumptionLower is better | 10th / 50 | 5.7 l/100km | +0.20 l/100km |
| AbrasionLower is better | 31st / 50 | 80 mg/km/t | +45.20 mg/km/t |
- EU Label
- D/B/71
- Price
- 52.00
Lassa DriveWays
205/55 R16 91V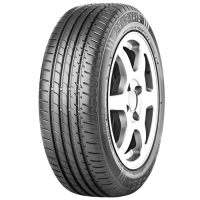
Category scores (% of best)
All discipline results (11)
Discipline positions compare the ranked tyres in this test, not the whole market. These are individual measurements, not weighted overall scores.
| Test | Position in discipline | Result | Gap to best |
|---|---|---|---|
| Dry BrakingLower is better | 41st / 50 | 40.2 m | +4.30 m |
| Wet BrakingLower is better | 45th / 50 | 46.4 m | +12.00 m |
| Wet Braking - ConcreteLower is better | 42nd / 50 | 44.1 m | +8.90 m |
| Straight AquaHigher is better | 25th / 50 | 80.7 km/h | -6.00 km/h |
| Curved AquaplaningHigher is better | 33rd / 50 | 3.3 m/sec2 | -0.70 m/sec2 |
| NoiseLower is better | 44th / 50 | 72.3 dB | +3.20 dB |
| Tyre WeightLower is better | 41st / 50 | 9.1 Kg | +1.50 Kg |
| WearHigher is better | 36th / 50 | 33700 KM | -37,800.00 KM |
| ValueLower is better | 45th / 50 | 2.91 Price/1000 | +1.88 Price/1000 |
| Fuel ConsumptionLower is better | 3rd / 50 | 5.6 l/100km | +0.10 l/100km |
| AbrasionLower is better | 26th / 50 | 76.1 mg/km/t | +41.30 mg/km/t |
- EU Label
- B/B/71
- Price
- 98.00
Evergreen DynaComfort EH226
205/55 R16 91V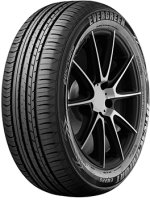
Category scores (% of best)
All discipline results (11)
Discipline positions compare the ranked tyres in this test, not the whole market. These are individual measurements, not weighted overall scores.
| Test | Position in discipline | Result | Gap to best |
|---|---|---|---|
| Dry BrakingLower is better | 48th / 50 | 41.4 m | +5.50 m |
| Wet BrakingLower is better | 47th / 50 | 50.9 m | +16.50 m |
| Wet Braking - ConcreteLower is better | 48th / 50 | 49.7 m | +14.50 m |
| Straight AquaHigher is better | 37th / 50 | 79.2 km/h | -7.50 km/h |
| Curved AquaplaningHigher is better | 19th / 50 | 3.5 m/sec2 | -0.50 m/sec2 |
| NoiseLower is better | 12th / 50 | 70.5 dB | +1.40 dB |
| Tyre WeightLower is better | 41st / 50 | 9.1 Kg | +1.50 Kg |
| WearHigher is better | 18th / 50 | 40000 KM | -31,500.00 KM |
| ValueLower is better | 36th / 50 | 2.55 Price/1000 | +1.52 Price/1000 |
| Fuel ConsumptionLower is better | 28th / 50 | 5.8 l/100km | +0.30 l/100km |
| AbrasionLower is better | 13th / 50 | 72.2 mg/km/t | +37.40 mg/km/t |
- EU Label
- D/C/68
- Price
- 102.00
Riken Road Performance
205/55 R16 91V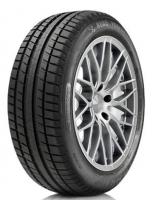
Category scores (% of best)
All discipline results (11)
Discipline positions compare the ranked tyres in this test, not the whole market. These are individual measurements, not weighted overall scores.
| Test | Position in discipline | Result | Gap to best |
|---|---|---|---|
| Dry BrakingLower is better | 37th / 50 | 39.8 m | +3.90 m |
| Wet BrakingLower is better | 46th / 50 | 48.4 m | +14.00 m |
| Wet Braking - ConcreteLower is better | 46th / 50 | 45.7 m | +10.50 m |
| Straight AquaHigher is better | 34th / 50 | 79.6 km/h | -7.10 km/h |
| Curved AquaplaningHigher is better | 14th / 50 | 3.6 m/sec2 | -0.40 m/sec2 |
| NoiseLower is better | 43rd / 50 | 72.1 dB | +3.00 dB |
| Tyre WeightLower is better | 11th / 50 | 8.3 Kg | +0.70 Kg |
| WearHigher is better | 36th / 50 | 33700 KM | -37,800.00 KM |
| ValueLower is better | 29th / 50 | 2.26 Price/1000 | +1.23 Price/1000 |
| Fuel ConsumptionLower is better | 10th / 50 | 5.7 l/100km | +0.20 l/100km |
| AbrasionLower is better | 7th / 50 | 67 mg/km/t | +32.20 mg/km/t |
- EU Label
- C/C/71
- Price
- 76.00
Double Coin DC99
205/55 R16 91V
Category scores (% of best)
All discipline results (11)
Discipline positions compare the ranked tyres in this test, not the whole market. These are individual measurements, not weighted overall scores.
| Test | Position in discipline | Result | Gap to best |
|---|---|---|---|
| Dry BrakingLower is better | 49th / 50 | 42.5 m | +6.60 m |
| Wet BrakingLower is better | 50th / 50 | 59.3 m | +24.90 m |
| Wet Braking - ConcreteLower is better | 50th / 50 | 58.4 m | +23.20 m |
| Straight AquaHigher is better | 50th / 50 | 70.3 km/h | -16.40 km/h |
| Curved AquaplaningHigher is better | 49th / 50 | 2.7 m/sec2 | -1.30 m/sec2 |
| NoiseLower is better | 5th / 50 | 70 dB | +0.90 dB |
| Tyre WeightLower is better | 47th / 50 | 9.3 Kg | +1.70 Kg |
| WearHigher is better | 3rd / 50 | 64800 KM | -6,700.00 KM |
| ValueLower is better | 1st / 50 | 1.03 Price/1000 | Best in this discipline |
| Fuel ConsumptionLower is better | 3rd / 50 | 5.6 l/100km | +0.10 l/100km |
| AbrasionLower is better | 2nd / 50 | 45.9 mg/km/t | +11.10 mg/km/t |
- EU Label
- C/C/70
- Price
- 67.00
Premiorri Solazo
205/55 R16 91V
Category scores (% of best)
All discipline results (11)
Discipline positions compare the ranked tyres in this test, not the whole market. These are individual measurements, not weighted overall scores.
| Test | Position in discipline | Result | Gap to best |
|---|---|---|---|
| Dry BrakingLower is better | 50th / 50 | 42.9 m | +7.00 m |
| Wet BrakingLower is better | 49th / 50 | 58.1 m | +23.70 m |
| Wet Braking - ConcreteLower is better | 49th / 50 | 57.1 m | +21.90 m |
| Straight AquaHigher is better | 49th / 50 | 71.3 km/h | -15.40 km/h |
| Curved AquaplaningHigher is better | 47th / 50 | 2.8 m/sec2 | -1.20 m/sec2 |
| NoiseLower is better | 49th / 50 | 72.5 dB | +3.40 dB |
| Tyre WeightLower is better | 50th / 50 | 9.9 Kg | +2.30 Kg |
| WearHigher is better | 26th / 50 | 37300 KM | -34,200.00 KM |
| ValueLower is better | 2nd / 50 | 1.21 Price/1000 | +0.18 Price/1000 |
| Fuel ConsumptionLower is better | 28th / 50 | 5.8 l/100km | +0.30 l/100km |
| AbrasionLower is better | 19th / 50 | 74 mg/km/t | +39.20 mg/km/t |
- EU Label
- D/B/70
- Price
- 45.00
We like this simple chart explanation. As a Athens concrete contractor , our work also needs good testing and data. The picture helps kids and adults understand. We think learning about tires is helpful and fun.
Yokohama GLING GLING!!
Question cannot find answer: When / why do tire mfg companies no longer show both min psi with the max psi.
While I understand one tire may max at 51psi but asked to inflate to your own car guide (like 32-34psi), there must be a minimum psi that the mfg would say its my falt for driving (say at 20psi) where the integeraty of the tire would be challenged.
That's a good question I don't know the answer to.
At a guess, the biggest issue with low PSI is the tyre debeading from the rim, so perhaps manufacturers don't want the liability of saying for example 20psi and the tyre comes off the rim at 22psi due to poor wheel or big impact.
really liked your video testing the impact of adding weight to pickup truck rear axle. I think that it would be a very interesting and popular video if you performed a similar test on a FWD vehicle to evaluate how adding mass over the rear axle affects braking distances on snow or ice. There just does not seem to be a solid answer to this question, and therefore actual testing would be very valuable info. I think it would be most useful if the test was performed with snow tires installed, and even better if the effect of studded tires could also be included as an additional variable (could potentially change the results of the added mass). Thanks
That's certainly an interesting test idea, but I'm not sure I've ever heard anyone suggest adding weight to the boot of a FWD vehicle so I'm not sure how relevant it would be.
Thanks for the reply. I think that if you google this question you can actually find tons and tons of online conversations and debate regarding this question, along with tons of opinions for or against. Lots of people do add weight to the trunk of FWD vehicles hoping to increase rear wheel braking grip and reduce the risk of having the rear swing out. Maybe its a Canadian/Nordic thing?. The problem is that it is not completely obvious if this is net beneficial, or if the extra inertia completely offsets the benefit of the extra traction.
Thanks for such epic test.
If EC6 join these test will be better
Sadly, once again, they sort of set wear above safety making the test nice for fleet managers but bad news for customers.
What is the true average annual mileage of a privately owned car in central Europe? Around 10.000 km / year, there are some drivers that do more and there are many more that do even less. I'm talking about private, not company cars. Let's get back to the average. Say, 4k km are done on winter set, so 6.000 km / year on summer tyres. There is absolutely no chance those like the Goodyears would be worn out unless being absolute threat to everything on the road after ten or even more years. Actually they will be unsafe in half the time (own experience with previous Goodyear Efficientgrip Performance model - great when new, completely lost traction after five years causing extremely extended braking distances and wheel spinning on slippery surfaces even for cautious and gentle drivers. Borrowed a pair of new, confirmed the old tyres to be the problem, so they had to go. Who would voluntarily reaplce tyres with still half of tread depth as I did?
Currently I am using Nokian Wetproof (which are praised for braking distances and excellent wet and dry grip which I can confirm) but these (and Vredestein Ultrac) are usually devaluated for low expected mileage around 30.000 km. Honestly, I'd happily replace worn tyres every five or six years if they are as safe as when new instead of being rear-ended by hypermilers with 'eternal' Michelin or Goodyear on traffic lights.
Sadly, such pressure on extreme wear durability inevitably leads to tyres being worse and less safe for private customers.
Interesting comment, thanks for sharing. I think in the UK the average mileage is around 10,000 miles, so 16,000km and there's no switch to a winter tyre for 98% of people. That means 80,000km is achievable in the 5 year recommended life of a tyre.
How these tyres perform after 5 years at 2mm is another question that's sadly very hard to answer.
Nokian tyres are usually pretty safe bet overall, and especially for those whose mileage is low. If one really wants to maintain maximum safety, they need to have over 3mm tread left and tyre shouldn't be more than 4 years old*. Maybe even less if they are exposed to sunlight 365 days a year. So, if your mileage is low, and tyre does not wear too much on that 3-4 years period, you are good to go, but if your mileage is high (some people actually drive 30k, even 50k in one summer), you probably want to get one of those more durable tyres.
*) I always have this at minimum on our family car...but my "commuter" can have anything, because I don't have to drive it on highway.
That's a lot of data to digest! At ADAC's link we've got at the page's bottom the test pdf's where there's even more data relating to dry and wet performance, the way ADAC usually presents it. Unfortunately, they went through a lot of effort and money to test all these tyres when they could have tested a smaller amount of them but of many different premium and budgets models (and even different weight/speed indexes for each model). For instance: the Contis EC5, EC6, PC5, Michelin Pilot Sport 4, Primacy 4, Goodyear EGP, Hankook Prime 3, Pirelli Cinturato P1 Verde, Bridgestone Ecopia EP150 and Turanza ECO, Maxxis Premitra HP5 and Mecotra 3, Falken Sincera SN832, Yokohama BluEarth GT and BluEarth-ES, Vredestein Ultra, etc. So much money wasted in so many crappy tyres!... Maybe I'm being ungrateful, but on my opinion, this is not a great way to celebrate 50 years of tyre testing!
Two things: first, the performance of the P7C2 is oddly out of alignment with TR's own assessment; second, might we have the descriptive commentary for the other tyres?
I meant to write something about that in the article, I guess I forgot. We got the new compound P7C2, ADAC didn't as they tested before us.
You can find the descriptive commentary on the ADAC site linked just above the results, I sadly don't have the time to copy and paste it across, it's surprisingly time consuming :) I'll try and get it added in the coming weeks.